Use of Prenasal Thickness, Nasal Bone Length and Their Ratio in Diagnosing Down Syndrome at 16-25 weeks' of gestation in India: A Retrospective, Observational, Case Control Study
Funding: The authors received no specific funding for this work.
ABSTRACT
Background
It is found to have association of facial parameters with trisomy 21 fetuses (T 21). We have compared prenasal thickness (PNT), nasal bone length (NBL), and the PNT:NBL ratio of normal fetuses with fetuses with trisomy 21 (T 21) between 16 and 25 weeks of gestation as a diagnostic tool for T 21.
Methods
Facial profile images in the two dimensional (2D) gray scale were assessed to measure fetal NBL and PNT between 16 and 25 weeks of gestation. The PNT:NBL ratio of the fetuses was calculated. Nomograms were constructed from the data of morphologically normal fetuses at live birth. The PNT, NBL, and PNT:NBL ratio of fetuses with confirmed T 21 (n = 31) and morphologically normal fetuses at live birth (controls, n = 3485) were compared.
Results
Nomograms for PNT, NBL, and the PNT:NBL ratio were constructed. In T 21 fetuses, PNT (> 95th percentile), NBL (< 5th percentile), and the PNT:NBL ratio (> 95th percentile) showed a sensitivity of 25%, 29%, and 45% for PNT, NBL, and PNT:NBL, respectively, and specificity of 95%, 96%, and 94%, for PNT, NBL, and PNT:NBL, respectively. All of these markers showed a negative predictive value of 99%.
Conclusion
PNT, NBL, and the PNT:NBL ratio have high diagnostic value for fetuses with Down syndrome and can be incorporated easily in the current second trimester screening protocol for T 21. PNT, NBL, and the PNT:NBL ratio are more specific markers for Down syndrome than those used in previous studies.
Abbreviations
-
- 2D
-
- two dimensional
-
- 3D
-
- three dimensional
-
- NBL
-
- nasal bone length
-
- PNT
-
- prenasal thickness
-
- POG
-
- period of gestation
-
- T 21
-
- trisomy 21
1 Introduction
Down syndrome or trisomy 21 (T 21) is the most common aneuploidy. Langdon Down first described this syndrome in 1866, and it is characterized by an excessive amount of skin [1].
In India, the prevalence of Down syndrome varies from 1:700 to 1:1800 depending upon the region and available data [2]. Down syndrome involves a considerable social and financial burden on the family. The focus of screening for Down syndrome has shifted universally to first trimester ultrasound markers and biochemical studies.
In spite of these advances, in India, screening the population in the first trimester is difficult because of the various social and administrative constraints and a lack of adequate, skilled staff required for first trimester ultrasound screening.
Ultrasound remains the most readily available modality of screening and diagnosing fetuses with various chromosomal and structural anomalies for most couples in India. Currently, the second trimester is the most common window for such screening. An absent/hypoplastic nasal bone, increased nuchal fold, short femur, short humerus, intracardiac echogenic focus, echogenic bowel, hydronephrosis, ventriculomegaly, and aberrant right subclavian artery are the main ultrasound markers used to assign a risk of Down syndrome in the second trimester [3]. According to the International Society for Prenatal Diagnosis, a combination of the nuchal fold, nasal bone length (NBL), and prenasal thickness (PNT) along with biochemical markers, such as alfa fetoprotein, free beta human chorionic gonadotropin, unconjugated estriol, and inhibin A, leads to a detection rate of 90% [4].
The facial profile is one of the parameters routinely observed during the second trimester while screening the fetus for anomalies. In T 21 fetuses, NBL tends to be smaller and PNT tends to be greater than those in normal fetuses. De Jong-Pleij et al. [5] hypothesized that the PNT:NBL ratio may be a useful marker for T 21 screening.
Various studies have shown that PNT, NBL, and the PNT:NBL ratio are sensitive markers for detecting Down syndrome [6-9]. However, few studies have examined these parameters in the Indian population. Therefore, this study aimed to investigate these parameters in fetuses and to estimate their utility in diagnosing those with Down syndrome in India.
2 Materials and Methods
2.1 Inclusion Criteria
We included women who were scanned by ultrasound between 16 and 25 weeks of gestation and had their PNT and NBL measured as part of routine scanning from January 2013 to October 2019 at referral centers. We only included fetuses with available data of PNT and NBL along with images and postnatal fetal outcomes because this was a retrospective, observational study. We included morphologically normal, live neonates who were evaluated after delivery (confirmed from the hospital records or by telephone). These normal fetuses also had measurements for PNT, NBL, and the PNT:NBL ratio at 16–25 weeks of gestation. Nomograms were constructed from the data of these normal fetuses for PNT, NBL, and the PNT:NBL ratio. All women provided routine informed consent before a scan to have their data anonymized and information included in clinical studies. A waiver to provide ethical approval was obtained from the institutional ethical committee because this was a retrospective, observational reanalysis of routine data only, without disclosure of the patient's identity.
NBL and PNT were measured in the routine midsagittal facial profile view as described by Maymon et al. [8, 10], Szabó et al. [11], and Sonek et al. [12, 13]. The transducer was placed parallel to the nasal bone. The angle of insonation was maintained close to 45°. Adequate magnification and gain were used to optimize the image. The aim of scanning was to achieve the correct midsagittal plane and measure the exact margins of the skin and the nasal bone. The exact midsagittal plane was determined by identifying the nose, upper and lower lips, maxilla, and chin anteriorly and the secondary palate with the overlying vomeral bone posteriorly [14]. NBL was measured as the margins of the proximal and the distal ends of the white ossification line of the nasal bone as shown in fetal images (Figure 1). The PNT was measured as the shortest distance from the lower margin of the frontal bone (nasion) to the outer surface of the overlying skin. All anomaly scans were performed by the sonographers certified by the Fetal Medicine Foundation UK.
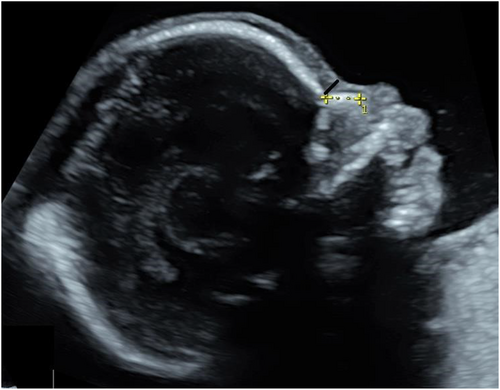
Midsagittal view of face showing nasal bone length (yellow line) and PNT (black line) of normal fetus.
In normal and T 21 fetuses, data were retrieved from an obstetric database (astraia gmbh), and the images were stored in the hospital picture archiving and communication system server from the database and our records. In T 21 fetuses, an invasive test was performed and the karyotype was confirmed. The outcome of pregnancies for normal fetuses was obtained from hospital records and telephone records.
2.2 Exclusion Criteria
Absent nasal bone increases the likelihood ratio and is considered as a high risk of aneuploidies [15]. Therefore, in our center, women with this condition were offered invasive tests as the standard protocol. Consequently, these women were excluded from our study. We also excluded fetuses with the diagnosis of other chromosomal anomalies affecting PNT, NBL, and their ratio and abnormal nasal bone elongation.
All fetuses with confirmed T 21 by invasive tests and the karyotype had their images retrieved and the measurements were rechecked by a second operator (Fetal Medicine Foundation, UK certified). Initially, all images were measured independently by all sonographers. We attempted to eliminate interobserver and intraobserver variation by retrieving the images that showed variations in parameter measurements. The retrieved images had PNT and NBL measured again by all sonographers after adequate magnification to reach a consensus to minimize interobserver and intraobserver variations. We compared the parameters of cases (fetuses diagnosed with T 21) with normal fetuses after matching their period of gestation (POG) to minimize bias.
2.3 Statistical Analysis
Correlations were calculated by Pearson's correlation test. The unpaired Student t-test was used to test the statistical significance of the difference of the mean of two groups. Scatter plots were used (Figures 2-4) to graph PNT, NBL, and the PNT:NBL ratio against gestational age for T 21 and normal fetuses. Detection rates were calculated for each of the parameters at a fixed false positive rate of 5%. Data were analyzed using the statistical software SPSS (version 23.0, IBM, New York, USA), R-3.2.0, and Excel for Windows 2016 (Microsoft Corp., Washington, USA). p < 0.05 was considered statistically significant. We constructed nomograms for PNT, NBL, and the PNT:NBL ratio for the 5th, 50th, and 95th percentiles for the respective POG (Appendix A: Table A1).
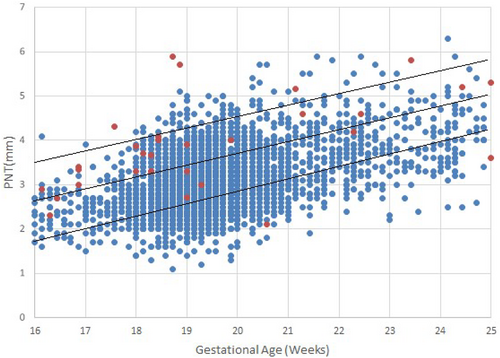
Scatter plot for PNT of normal (blue dots) and T 21 (red dots) at respective gestational age (Upper, middle, and lower black lines represent 95th, 50th, and 5th centile, respectively). PNT, prenasal thickness; T 21, trisomy 21.
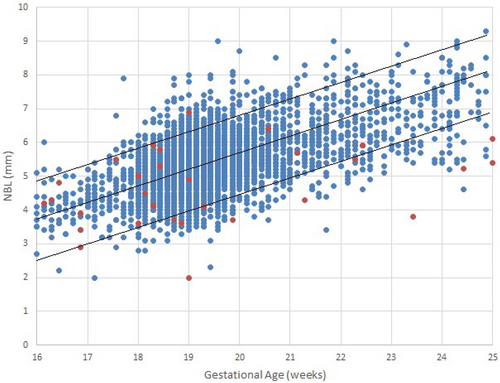
Scatter plot for NBL of normal (blue dots) and T 21 (red dots) at respective gestational age (Upper, middle, and lower black lines represent 95th, 50th, and 5th centile, respectively). NBL, nasal bone length; T 21, trisomy 21.
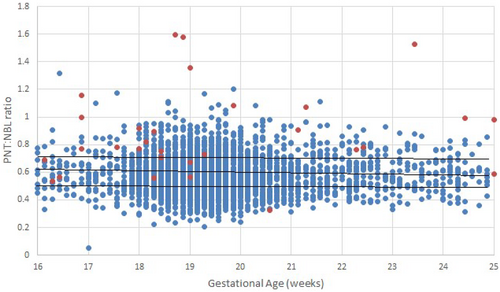
Scatter plot for the PNT:NBL ratio of normal (blue dots) and T 21 (red dots) at respective gestational age (Upper, middle, and lower black lines represent 95th, 50th, and 5th centile, respectively). NBL, nasal bone length; PNT, prenasal thickness; T 21, trisomy 21.
3 Results
We studied 31 T 21 fetuses and 3485 morphologically normal fetuses with a live birth. The majority of the images studied were from 18 to 20 weeks of gestation because of the legal requirements in India (Figure 5).
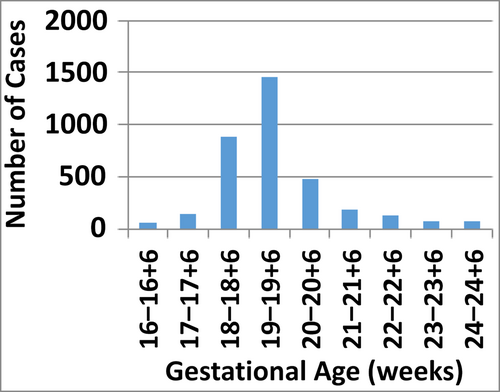
Population distribution of the number of morphologically normal fetuses with gestational age in weeks.
We found a sensitivity of 25% and 29% for PNT and NBL, respectively, for detecting T 21 fetuses (Table 1). In our study, the sensitivity and specificity for detecting T 21 using PNT and NBL, was found to be 25% and 29% respectively. The specificity for detecting T 21 using PNT, NBL and PNT:NBL ratio was found to be 94%, 96%, and 94% respectively with false positive rate of 5%.
| Soft markers | Sensitivity (%) | Specificity (%) | NPV (%) | PPV (%) |
|---|---|---|---|---|
| PNT > 95th percentile | 25.81 | 94.98 | 99.31 | 4.37 |
| NBL < 5th percentile | 29.03 | 96.21 | 99.35 | 6.38 |
| PNT:NBL ratio > 95th percentile | 45.16 | 94.72 | 99.49 | 7.07 |
- Abbreviations: NBL, nasal bone length; NPV, negative predictive value; PNT, prenasal thickness; PPV, positive predictive value; T 21, trisomy 21.
NBL, PNT, and the PNT:NBL ratio had a high negative predictive value (each 99%) but a low positive predictive value (4%–7%). We also constructed nomograms (Table A1) for PNT, NBL, and the PNT:NBL ratio and scatter plots (Figures 2-4), which are readily available for the bedside assessment of the risk of T 21. The PNT:NBL ratio decreased as gestational age advanced. In the nomograms (Table A1), we found that as the POG increased, NBL and PNT linearly increased, but the PNT:NBL ratio did not vary as much as the individual markers. The PNT:NBL ratio remained 0.77 for 16–18+6, 0.76 for 19–21+6, 0.75 for 22–23+6, and 0.74 for 24–24+6 weeks of gestation. The majority of our population consisted of fetuses aged between 18 and 20 weeks of gestation in accordance with the routine protocol of screening fetuses for anomalies between this POG as recommended by the legal screening norms in India.
4 Discussion
Various studies have analyzed 3D and 2D images as a screening tool for Down syndrome in addition to various population-specific nomograms for NBL and PNT [16-18]. However, to the best of our knowledge, no studies have investigated the role of these parameters in the Indian population. We constructed nomograms using a large database of PNT, NBL, and the PNT:NBL ratio in normal fetuses (n = 3485) at the 5th, 50th, and 95th percentiles according to gestational age. This study aimed to simplify the diagnostic tools for determining T 21 in fetuses by taking measurements from the facial profile, which is an integral part of routine scans to rule out anomalies because it has a short learning curve. In T 21 fetuses, NBL tends to be smaller, whereas PNT tends to be greater than those in normal fetuses.
De Jong-Pleij et al. [5] proposed that the PNT:NBL ratio may be a useful marker for T 21 screening. Persico et al. [6], Miguelez et al. [8], and Maymon et al. [9] evaluated the role of PNT alone as a screening tool for T 21 fetuses. Persico et al. prospectively analyzed 3D ultrasound images of 135 normal fetuses and compared them with 26 fetuses with T 21 [6]. In their study, they found a sensitivity of 71% for PNT in detecting T 21 fetuses and PNT was above the 95th percentile in 73% of T 21 fetuses [6].
Maymon et al. retrospectively analyzed 2D images of 850 normal fetuses and 80 T 21 fetuses and calculated the multiple of the median values. They found that 35% of T 21 fetuses had a multiple of the median above the 95th percentile for PNT [9].
Miguelez et al. examined PNT in 105 T 21 fetuses and compared it with 1385 unaffected pregnancies. They found that PNT has a detection rate for T 21 fetuses of 35%, 51%, and 60% with a false positive rate of 1%, 3%, and 5%, respectively [8].
Vos et al. [7] retrospectively studied 2D and 3D images of 159 confirmed T 21 fetuses and compared their images with those in a previously available database. Their study showed that the PNT:NBL ratio had the highest detection rate (86.2%) compared with PNT (63.4%) and NBL (61.9%).
De Jong-Pleij et al. hypothesized that NBL is shorter and PNT is larger in T 21 fetuses than in normal fetuses [5]. Therefore, the PNT:NBL ratio may be a sensitive and specific marker in detecting T 21 fetuses. They performed a retrospective study and compared 106 normal fetuses with 30 T 21 fetuses. These authors studied 10 2D images and 20 3D images of T 21 fetuses. They found that the PNT:NBL ratio was stable throughout gestation, with a mean of 0.61 for normal fetuses and 1.5 for T 21 fetuses. The detection rate was 100% with a 5% false positive rate for the PNT:NBL ratio. The detection rates for PNT and NBL were 77% and 67%, respectively.
Szabó et al. [11] prospectively studied the role of PNT, NBL, and their ratio for detecting T 21. Their study comprised of 1330 euploid fetuses and 33 T 21 fetuses. PNT, NBL, and the PNT:NBL ratio showed a sensitivity of 76%, 76%, and 97% with a false positive rate of 1.8%, 2.3%, and 0.9%, respectively, and a specificity of 98%–99%.
These studies mentioned above are summarized in Table 2.
| Study | Images (3D/2D) | Type of study (P/R) | Normal versus T 21 (number of cases) | Sensitivity (%) | ||
|---|---|---|---|---|---|---|
| PNT | NBL | PNT:NBL ratio | ||||
| Persico et al. [6] | 3D | P | 135; 26 | 71 | — | — |
| Maymon et al. [10] | 2D + 3D | R | 850; 80 | 35 | — | — |
| De Jong-Pleij et al. [5] | 2D + 3D | R | 106; 30 | 77 | 67 | 100 |
| Szabó A et al. [11] | 2D | P | 1330; 33 | 76 | 76 | 97 |
| Vos et al. [7] | 2D + 3D | R | 159; data of previous studies | 63.4 | 61.9 | 86.2 |
| Sharma et al. [19] | 2D | P | 450; 45 | 42 | 51 | 65 |
| Altunkeser et al. [23] | 2D | P | 340; 11 | 91 | 100 | 100 |
| Our study | 2D | R | 3485; 31 | 25.81 | 29.03 | 45.16 |
- Abbreviations: 2D, 2 dimensional; 3D, 3 dimensional; NBL, nasal bone length; P, prospective; PNT, prenasal thickness; R, retrospective; T 21, trisomy 21.
The NBL was slightly higher in our study population than that in a study by Sharma et al. [19] of the Indian population. The study by Sharma et al. had a mixed population from North and South India. In contrast, the majority of the population in our study was from North India. This difference in populations between studies may be the reason for this minor variation in NBL.
In contrast to previous studies [5-9], our study showed a low sensitivity (25% for PNT, 29% for NBL, and 45% for the PNT:NBL ratio) but a high specificity (95%–96%) and negative predictive value (99%) in detecting T 21 cases. NBL measurement obtained by 2D ultrasound is usually larger than that with 3D ultrasound image measurements, and this difference is less for PNT [20, 21]. This finding may be one of the reasons for a higher PNT:NBL ratio in our study as compared to previous studies [20, 21] because these studies had mixed 2D and 3D images. We believe that in the Indian population, 2D images should be used because grayscale scanning is the most prevalent form of scanning even in smaller centers with infrequent use of 3D across India.
Our study design is similar to that in a study by Szabó et al. [11]. They found a specificity of 98%–99% for the NBL:PNT ratio, and we have comparable specificity of 95%–96% but a low sensitivity. Ethnic variation may be the reason for this finding. A further prospective study is required to evaluate these geographic and ethnic variations and also between different regions within India.
A study of facial parameters in the Indian population by Mylavarapu et al. [22] compared 450 normal fetuses with 45 fetuses with Down syndrome. They also found a low sensitivity of 40%–60% for PNT, NBL, and the PNT:NBL ratio, with a high specificity of 96%–99% for these parameters, similar to our study.
A study by Akalın et al. [16] studied the role of PNT, NBL, and the PNT:NBL ratio in the Turkish population and also concluded that the use of population-specific nomograms may lead to a higher accuracy in detecting Down syndrome.
In our study, PNT and NBL showed a positive correlation with gestational age, which is similar to other studies [16-18]. The PNT:NBL ratio did not vary much 0.74–0.77 and it had a negative correlation with gestational age in our study. This finding is in contrast to a study by Altunkeser and Kazım Körez [23] in which this ratio remained static with gestational age and they found that it was more useful than PNT or NBL alone.
In nomograms (Table A1), we found that as the POG increased, NBL and PNT increased, but the PNT:NBL ratio did not vary as much as the individual markers. The majority of our population consisted of fetuses aged between 18 and 20 weeks of gestation in accordance with the routine protocol of screening fetuses for anomalies between this POG. This time may be the only window to screen fetuses in low resource settings in the Indian population. Therefore, we have intended to simplify the diagnostic modality for Down syndrome in this set up using the facial profile, which is one of the most important parameters to examine at 18–20 weeks of gestation in a routine scan. The 2D fetal facial profile is the easiest image to obtain and it has a short learning curve. In a single image of the facial profile, PNT and NBL can be measured, and calculating their ratio is easy to determine the risk of aneuploidy. If nomograms are available, they can be easily compared. And if they cross the threshold of the 95th percentile, they have a high predictive value for Down syndrome.
4.1 Strengths and Limitations
A strength of this study is that we constructed nomograms (Table A1) for PNT and NBL using a large Indian dataset and measured the PNT:NBL ratio. This ratio can be used as a readily available bedside reference in low resource settings in India with no need of any software or Internet access. Couples can be counseled about options of further testing, such as noninvasive prenatal tests or invasive tests in case of fetuses with a high risk of T 21.
A limitation to this study is referral bias because our center mainly treats referred patients. Further prospective trials are required to evaluate the role of PNT, NBL, and the PNT:NBL ratio in a low-risk general population. Future studies based upon a large database of T 21 fetuses need to be performed. Additionally, other parameters, such as ventriculomegaly, a short humerus, a short femur, echogenic bowel, and pyelectasis, should be combined with facial parameters.
4.2 Implications
PNT and NBL can be easily measured in a 2D facial profile view in a second trimester ultrasound scan. This type of scanning provides one of the most common and easily achievable images at the time of scanning for anomalies and it has a short learning curve. Additionally, this type of imaging provides an opportunity to examine NBL and PNT and allows an easy calculation of the PNT:NBL ratio. The percentiles for PNT, NBL, and the PNT:NBL ratio can be easily calculated from a nomogram for use as a bedside reference without any need for Internet connection or software, especially in a low resource setting. Based on these diagnostic parameters, if a fetus has a high risk of T 21, further testing, such as additional ultrasound markers and blood tests (quadruple test or noninvasive prenatal tests), can be offered.
If we combine biochemical markers (such as alpha-fetoprotein, human chorionic gonadotropin, estriol, and inhibin-A.) and other soft markers, such as nuchal fold thickness and the humerus and femur length, for the screening of T 21 in the second trimester, it is comparable with first trimester combined screening [4, 24].
Hypoplastic nasal bone (< 5th percentile), an increased PNT (PNT > 95th percentile), and a single value of the PNT:NBL ratio > 0.77, which is the highest value (> the 95th percentile), may indicate an increased risk of T 21 in a low resource setting. Further testing may be offered in such settings. Figure 1 shows NBL and PNT measurements in a normal fetus. Figures 6-8 show a fetus with T 21 who has hypoplastic nasal bone, increased PNT, or a PNT:NBL ratio > 95th percentile.
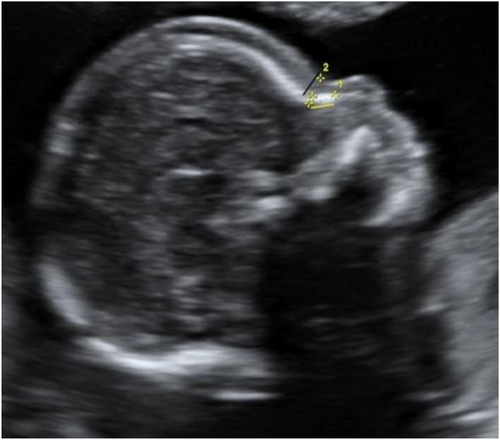
T 21 fetus midsaggital view of face showing NBL (yellow line) and PNT (black line) with hypoplastic nasal bone and increased PNT:NBL ratio. Confirmed T 21 fetus; GA–19 W 2 D, NBL–4.1 mm (< 5th centile*), PNT–3.3 mm (50th centile*), PNT:NBL ratio–0.80 (> 95th centile*). *Percentiles as per nomogram (Table A1). NBL, nasal bone length; PNT, prenasal thickness; T 21, trisomy 21.
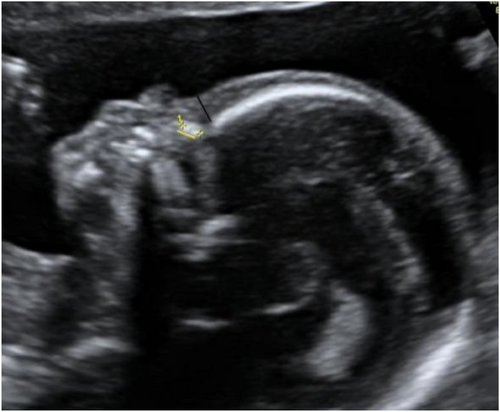
T 21 fetus midsaggital view of face showing NBL (yellow line) and PNT (black line) with hypoplastic nasal bone, increased PNT and PNT:NBL ratio. Confirmed T 21 fetus; GA–18 W 3 D, NBL–2.8 mm (< 5th centile*), PNT–3.9 mm (> 95th centile*), PNT:NBL ratio–1.39 (> 95th centile*). * Percentiles as per nomogram (Table A1). NBL, nasal bone length; PNT, prenasal thickness; T 21, trisomy 21.
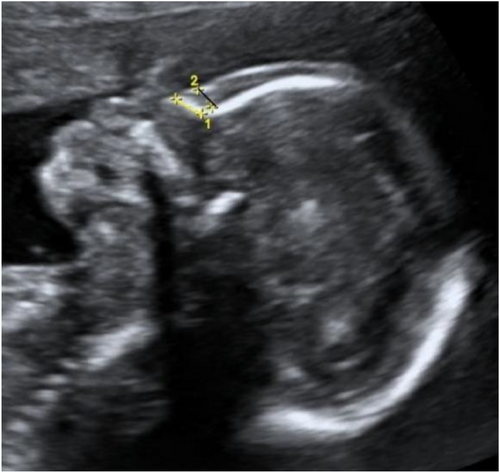
T 21 fetus midsaggital view of face showing nasal bone length (yellow line) and PNT (black line) with increased PNT and PNT:NBL ratio. Confirmed T 21 fetus; POG–18 W 3 D, NBL–5.8 mm (50–95th centile*), PNT–4.8 mm (> 95th centile*), PNT: NBL ratio–0.82 (> 95th centile*). *Percentiles as per nomogram (Table A1). NBL, nasal bone length; PNT, prenasal thickness; POG, period of gestation; T 21, trisomy 21.
5 Conclusion
Two-dimensional measurements of PNT, NBL, and the PNT:NBL ratio are easily obtainable measurements by ultrasound scanning, with a short learning curve, to screen for T 21 fetuses. Further testing (e.g., scans for additional markers, blood tests such as the quadruple test/noninvasive prenatal test or an invasive test) may be offered in such settings. Our study shows that PNT, NBL, and the PNT:NBL ratio have a high specificity and negative predictive value and can be easily incorporated in the current second trimester screening protocol to diagnose T 21 fetuses. However, future studies with a large database of T 21 fetuses and normal fetuses in different populations (e.g., Asian, European, and African) are required to determine the utility of these parameters in different population groups.
Author Contributions
Mhaske Nilesh Madhukar: data curation (equal), formal analysis (equal), project administration (equal), software (equal), validation (equal), writing – original draft (equal), writing – review and editing (equal). Akshatha Sharma: data curation (equal), formal analysis (equal), supervision (equal), validation (equal). Rachna Gupta: data curation (equal), formal analysis (equal), supervision (equal), validation (equal). Smriti Prasad: data curation (equal), formal analysis (equal). Anita Kaul: conceptualization (equal), formal analysis (equal), methodology (equal), supervision (equal), validation (equal), visualization (equal), writing – original draft (equal), writing – review and editing (equal).
Acknowledgments
Ms Himanshi, Ms Bhavana, and Ms Deeksha (Apollo Centre for Fetal Medicine, Indraprastha Aplollo Hospital, New Delhi, India) had assisted in retrieving and arranging the data.
Ethics Statement
A waiver to provide ethical approval was obtained from the institutional ethical committee because this was a retrospective, observational reanalysis of routine data only, without disclosure of the patient's identity.
Consent
All women provided routine informed consent before a scan to have their data anonymized and information included in clinical studies.
Conflicts of Interest
The authors declare no conflicts of interest.
Appendix A
Nomogram for NBL, PNT and PNT:NBL ratio readily available as a bedside referance in detecting T 21 fetuses at 16–25 weeks gestation in Indian fetuses.
| NBL (mm) | PNT (mm) | PNT:NBL ratio | |||||||
|---|---|---|---|---|---|---|---|---|---|
| Gestational Age (weeks) | 5th centile | 50th centile | 95th centile | 5th centile | 50th centile | 95th centile | 5th centile | 50th centile | 95th centile |
| 16 + 0 | 2.98 | 3.80 | 4.60 | 1.61 | 2.21 | 2.71 | 0.48 | 0.63 | 0.77 |
| 16 + 1 | 3.05 | 4.05 | 4.73 | 1.63 | 2.25 | 2.75 | 0.48 | 0.63 | 0.77 |
| 16 + 2 | 3.09 | 4.10 | 4.75 | 1.65 | 2.29 | 2.80 | 0.48 | 0.63 | 0.77 |
| 16 + 3 | 3.14 | 4.14 | 4.80 | 1.68 | 3.36 | 2.84 | 0.48 | 0.63 | 0.77 |
| 16 + 4 | 3.20 | 4.19 | 4.85 | 1.71 | 2.42 | 2.91 | 0.48 | 0.63 | 0.77 |
| 16 + 5 | 3.24 | 4.23 | 4.88 | 1.73 | 2.48 | 2.96 | 0.48 | 0.63 | 0.77 |
| 16 + 6 | 3.27 | 4.29 | 4.97 | 1.77 | 2.55 | 3.00 | 0.48 | 0.63 | 0.77 |
| 17 + 0 | 3.30 | 4.35 | 5.06 | 1.80 | 2.59 | 3.06 | 0.48 | 0.63 | 0.77 |
| 17 + 1 | 3.34 | 4.40 | 5.23 | 1.84 | 2.63 | 3.11 | 0.48 | 0.63 | 0.77 |
| 17 + 2 | 3.36 | 4.45 | 5.32 | 1.85 | 2.67 | 3.17 | 0.48 | 0.63 | 0.77 |
| 17 + 3 | 3.40 | 4.53 | 5.47 | 1.88 | 2.71 | 3.22 | 0.48 | 0.63 | 0.77 |
| 17 + 4 | 3.47 | 4.60 | 5.52 | 1.92 | 2.76 | 3.25 | 0.48 | 0.63 | 0.77 |
| 17 + 5 | 3.53 | 4.69 | 5.68 | 1.95 | 2.82 | 3.31 | 0.48 | 0.63 | 0.77 |
| 17 + 6 | 3.56 | 4.75 | 5.77 | 2.05 | 2.85 | 3.36 | 0.48 | 0.63 | 0.77 |
| 18 + 0 | 3.60 | 4.80 | 5.86 | 2.08 | 2.00 | 3.43 | 0.48 | 0.63 | 0.77 |
| 18 + 1 | 3.68 | 4.83 | 5.91 | 2.13 | 2.96 | 3.51 | 0.48 | 0.63 | 0.77 |
| 18 + 2 | 3.73 | 4.96 | 6.04 | 2.16 | 3.01 | 3.66 | 0.48 | 0.63 | 0.77 |
| 18 + 3 | 3.85 | 5.02 | 6.11 | 2.20 | 3.04 | 3.72 | 0.48 | 0.63 | 0.77 |
| 18 + 4 | 3.85 | 5.10 | 6.18 | 2.23 | 3.10 | 3.76 | 0.48 | 0.63 | 0.77 |
| 18 + 5 | 3.90 | 5.23 | 6.24 | 2.27 | 3.14 | 3.84 | 0.48 | 0.63 | 0.77 |
| 18 + 6 | 3.96 | 5.28 | 6.29 | 2.31 | 3.19 | 3.90 | 0.48 | 0.63 | 0.77 |
| 19 + 0 | 4.08 | 5.30 | 6.33 | 2.34 | 3.25 | 3.96 | 0.47 | 0.62 | 0.76 |
| 19 + 1 | 4.13 | 5.37 | 6.37 | 2.38 | 3.30 | 4.01 | 0.47 | 0.62 | 0.76 |
| 19 + 2 | 4.22 | 5.43 | 6.40 | 2.42 | 3.36 | 4.05 | 0.47 | 0.62 | 0.76 |
| 19 + 3 | 4.28 | 5.49 | 6.50 | 2.46 | 3.41 | 4.11 | 0.47 | 0.62 | 0.76 |
| 19 + 4 | 4.34 | 5.52 | 6.55 | 5.52 | 3.45 | 4.16 | 0.47 | 0.62 | 0.76 |
| 19 + 5 | 4.39 | 5.57 | 6.66 | 5.56 | 3.52 | 4.20 | 0.47 | 0.62 | 0.76 |
| 19 + 6 | 4.43 | 5.60 | 6.71 | 2.61 | 3.57 | 4.26 | 0.47 | 0.62 | 0.76 |
| 20 + 0 | 4.47 | 5.62 | 6.77 | 2.66 | 3.62 | 4.31 | 0.47 | 0.62 | 0.76 |
| 20 + 1 | 4.50 | 5.73 | 6.83 | 2.72 | 3.66 | 4.37 | 0.47 | 0.62 | 0.76 |
| 20 + 2 | 4.54 | 5.78 | 6.91 | 2.75 | 3.70 | 4.42 | 0.47 | 0.62 | 0.76 |
| 20 + 3 | 4.61 | 5.84 | 7.12 | 2.80 | 3.75 | 4.48 | 0.47 | 0.62 | 0.76 |
| 20 + 4 | 4.66 | 5.90 | 7.16 | 2.85 | 3.82 | 4.53 | 0.47 | 0.62 | 0.76 |
| 20 + 5 | 4.70 | 5.95 | 7.22 | 2.92 | 3.88 | 4.55 | 0.47 | 0.62 | 0.76 |
| 20 + 6 | 4.76 | 6.08 | 7.28 | 2.96 | 3.93 | 4.59 | 0.47 | 0.62 | 0.76 |
| 21 + 0 | 4.80 | 6.12 | 7.36 | 3.00 | 3.98 | 4.62 | 0.46 | 0.62 | 0.76 |
| 21 + 1 | 4.83 | 6.24 | 7.40 | 3.05 | 4.04 | 4.66 | 0.46 | 0.62 | 0.76 |
| 21 + 2 | 4.87 | 6.29 | 7.44 | 3.11 | 4.08 | 4.69 | 0.46 | 0.62 | 0.76 |
| 21 + 3 | 4.93 | 6.33 | 7.48 | 3.17 | 4.11 | 4.72 | 0.46 | 0.62 | 0.76 |
| 21 + 4 | 5.00 | 6.40 | 7.52 | 3.22 | 4.16 | 4.76 | 0.46 | 0.62 | 0.76 |
| 21 + 5 | 5.06 | 6.46 | 7.61 | 3.28 | 4.20 | 4.80 | 0.46 | 0.62 | 0.76 |
| 21 + 6 | 5.10 | 6.51 | 7.68 | 3.33 | 4.25 | 4.83 | 0.46 | 0.62 | 0.76 |
| 22 + 0 | 5.17 | 6.60 | 7.72 | 3.36 | 4.30 | 4.92 | 0.46 | 0.61 | 0.75 |
| 22 + 1 | 5.26 | 6.67 | 7.81 | 3.39 | 4.34 | 5.01 | 0.46 | 0.61 | 0.75 |
| 22 + 2 | 5.32 | 6.71 | 7.93 | 3.42 | 3.37 | 5.05 | 0.46 | 0.61 | 0.75 |
| 22 + 3 | 5.35 | 6.78 | 8.02 | 3.45 | 4.39 | 5.11 | 0.46 | 0.61 | 0.75 |
| 22 + 4 | 5.41 | 6.82 | 8.13 | 3.48 | 4.42 | 5.16 | 0.46 | 0.61 | 0.75 |
| 22 + 5 | 5.43 | 6.88 | 8.19 | 3.51 | 4.44 | 5.22 | 0.46 | 0.61 | 0.75 |
| 22 + 6 | 5.47 | 6.92 | 8.22 | 3.56 | 4.46 | 5.26 | 0.46 | 0.61 | 0.75 |
| 23 + 0 | 5.54 | 6.97 | 8.27 | 3.59 | 4.49 | 5.33 | 0.46 | 0.59 | 0.75 |
| 23 + 1 | 5.58 | 7.03 | 8.35 | 3.63 | 4.51 | 5.37 | 0.46 | 0.59 | 0.75 |
| 23 + 2 | 5.60 | 7.09 | 8.39 | 3.66 | 4.53 | 5.40 | 0.46 | 0.59 | 0.75 |
| 23 + 3 | 5.65 | 7.15 | 8.44 | 3.68 | 4.56 | 5.47 | 0.46 | 0.59 | 0.75 |
| 23 + 4 | 5.70 | 7.18 | 8.49 | 3.71 | 4.60 | 5.50 | 0.46 | 0.59 | 0.75 |
| 23 + 5 | 5.73 | 7.22 | 8.53 | 3.75 | 4.64 | 5.54 | 0.46 | 0.59 | 0.75 |
| 23 + 6 | 5.78 | 7.36 | 8.57 | 3.78 | 4.68 | 5.63 | 0.46 | 0.59 | 0.75 |
| 24 + 0 | 5.82 | 7.41 | 8.62 | 3.80 | 4.72 | 5.69 | 0.45 | 0.59 | 0.74 |
| 24 + 1 | 5.84 | 7.55 | 8.71 | 3.83 | 4.78 | 5.74 | 0.45 | 0.59 | 0.74 |
| 24 + 2 | 5.85 | 7.63 | 8.77 | 3.85 | 4.82 | 5.79 | 0.45 | 0.59 | 0.74 |
| 24 + 3 | 5.90 | 7.72 | 8.82 | 3.89 | 4.87 | 5.83 | 0.45 | 0.59 | 0.74 |
| 24 + 4 | 5.92 | 7.77 | 8.87 | 3.82 | 4.91 | 5.88 | 0.45 | 0.59 | 0.74 |
| 24 + 5 | 5.93 | 7.81 | 8.90 | 3.96 | 4.96 | 5.93 | 0.45 | 0.59 | 0.74 |
| 24 + 6 | 5.95 | 7.86 | 8.93 | 4.02 | 4.99 | 5.97 | 0.45 | 0.59 | 1.74 |
- Abbreviations: NBL, nasal bone length; PNT, prenasal thickness.
Open Research
Data Availability Statement
Data that supports the findings of this study are available on request from the corresponding author. The data are not publicly available due to privacy or ethical restrictions.


