Probabilistic Risk Assessment of Flood Disaster in South Korea Under The Impact Of Climate Change†
Abstract
enThe objective of this study was to develop a probabilistic method for flood-risk assessment under climate change. The Intergovernmental Panel on Climate Change (IPCC) released the Representative Concentration Pathways (RCP) in preparation for climate change; the RCP4.5 and RCP8.5 scenarios were selected to examine future flood damage. The study area was South Korea. The spatial and temporal resolutions were on a city and county basis, and four time periods (1990s: 1976–2005, 2025s: 2011–2040, 2055s: 2041–2070 and 2085s: 2071–2100). Proxy variables were selected to assess flood risk. Indicators were standardized using the Z-score method and principal component analysis was conducted to calculate the weighting of indicators. Probability distribution of each indicator was fitted to analyse the flood risk. The generalized extreme value (GEV) distribution was selected as the appropriate distribution. Convolution was used to merge all probability density functions. The results show flood risk increasing during the 2025s period and continuing to rise up to the 2055s period. Especially, the increase from the 1990s to the 2025s is so large that countermeasures need to be developed. It also predicted that southern areas are at greater risk of flooding. These are expected to be used as appropriate data to establish an adaptation policy for climate change. Copyright © 2016 John Wiley & Sons, Ltd.
Résumé
frL'objectif de cette étude était de développer une méthode probabiliste pour l'évaluation des risques d'inondation dans le changement climatique. Dans la perspective de l'élaboration de son 5ème rapport d'évaluation, le Groupe d'Experts Intergouvernemental sur l'Evolution du Climat (GIEC) a publié des scénarios de référence (RCP, pour Representative Concentration Pathways); les scénarios RCP4.5 et RCP8.5 ont été retenus pour évaluer les conséquences des inondations. La zone d'étude était la Corée du Sud. Les résolutions spatiales et temporelles ont été à l'échelle de la ville et du comté, et de quatre périodes de temps (années 1990: de 1976 à 2005, années 2025: 2011–2040, années 2055: 2041–2070 et années 2085: 2071–2100). Des variables proxy ont été choisies pour évaluer les risques d'inondation. Les indicateurs ont été normalisés selon la méthode Z-score et l'analyse de la composante principale a été menée pour calculer la pondération des indicateurs. La distribution de probabilité de chaque indicateur a été déterminée pour analyser le risque d'inondation. La distribution des valeurs extrêmes généralisées (GEV) a été choisie comme la distribution appropriée. La convolution a été utilisée pour fusionner toutes les fonctions de densité de probabilité. Les résultats montrent un risque accru d'inondation pendant la période des années 2025, qui continue à croître jusqu'aux années 2055. Surtout, l'augmentation de 1990 à 2025 est si forte que la mise en œuvre de contre-mesures est indispensable. Il est également apparu que le risque est plus grand dans les régions du sud. Ces résultats devraient être utilisés comme des données pertinentes pour établir une politique d'adaptation aux changements climatiques. Copyright © 2016 John Wiley & Sons, Ltd.
Introduction
The Fifth Assessment Report (WGII AR5) of the Intergovernmental Panel on Climate Change (IPCC) clarifies the obvious influence of humans on the climate system. A comparison of global surface temperatures in 1850–1900 with 1986–2005 shows an increase of 0.61 °C. Climate change amplifies existing risks related to climate and introduces new ones (IPCC, 2014). In particular, climate change increases the magnitude of rainfall events that cause flash flooding, with consequent impact on infrastructure and damage to property.
It is clear that appropriate measures need to be taken to reduce flood disasters due to climate change. Flood disasters can be evaluated by assessing the flood risk, which is defined by the probability combination of flood events and their potential consequences (European Union, 2007). To establish an adaptation policy for flood risk management, it is important to quantitatively assess past and future flood risk.
Hoes and Schuurmans (2006) proposed flood standards with a case study in the Netherlands. Wrachien et al. (2011) described integrated flood risk management in Europe. Chan et al. (2013) provided practices of flood risk management in the Pearl River Delta.
Moss et al. (2001) conducted research to evaluate national vulnerability using proxy variables: gross domestic product (GDP) per capita, birth rate, and sea level rise, etc. Brooks et al. (2005) provided a novel methodology for vulnerability assessment by using the indicator groups of vulnerability and capacity, with 11 key indicators considered to have a strong relationship with climate-related disasters. Koh (2009) assessed the vulnerability of Gyeonggi Province to flood, drought, and sea level rise due to climate change. Hellegers et al. (2012) evaluated the impact of land development using water-related indicators. Fraser et al. (2013) used hydrological and socio-economic models to indicate vulnerable hotspots, which are the world's cereal-producing regions.
As different levels of flood risk can arise in different regions, we should find out quantitatively what and where flood risk is vulnerable. Thus, it is necessary to define reasonable criteria, which may be evaluated by integrating quantitative indicators. However, relatively few studies have been conducted on methods of assessing flood risk objectively.
The objective of this study is to assess the flood risk under climate change using probabilistic methods.
Methodology
RCP scenarios
The IPCC has released the new Representative Concentration Pathways (RCP) scenarios, which provide a parallel process for scenario development (Figure 1).
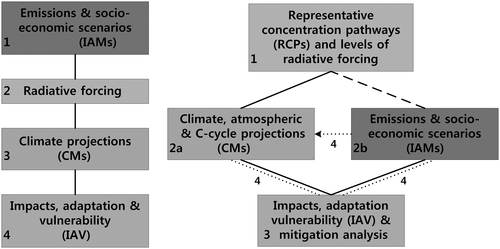
These RCP scenarios explain future climate change by using four types of scenarios: RCP2.6, RCP4.5, RCP6.0, and RCP8.5. The number of each scenario means a radiative forcing level (in W m−2). The RCP8.5, therefore, indicates the level of radiative forcing excesses over the level of 8.5 W m−2. The RCP6.0 and RCP4.5 are balanced on the edge of 6.0 and 4.5 W m−2 after 2100. And the RCP2.6 crests at about 3.0 W m−2 before 2100 and then descends (Moss et al., 2008).
Assessment of flood risk
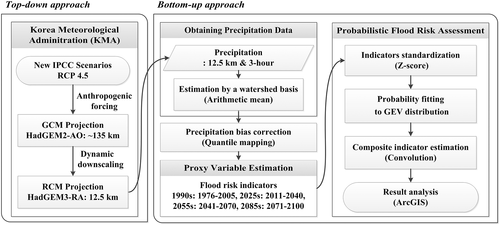
In this study, top-down and bottom-up approaches were integrated to calculate the flood risk. A probabilistic method was used to produce composite indicators and the RCP4.5 scenario supported by the Korean Meteorological Administration (KMA) was used to assess the flood risk. First, anthropogenic forcing and dynamic downscaling were performed by using the global and regional climate models, HadGEM2-AO and HadGEM3-RA, respectively. Next, precipitation data with spatial and temporal resolutions of 12.5 km and 3 h, respectively, were estimated for city and county areas. Next, bias correction was performed between observed and simulated data by using the quantile mapping method. Then, indicators on a city and county basis were standardized by using the Z-score method. Finally, the flood risk was assessed by convolution, which is a probabilistic method for fitting data into a probability distribution (Figure 2).
Bias correction
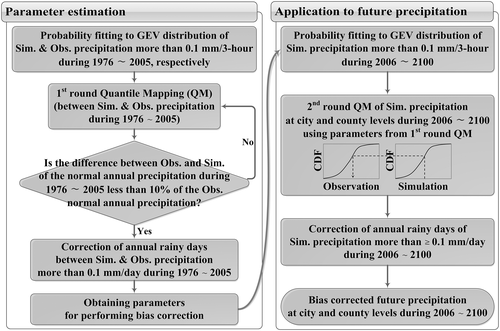
Bias correction was implemented between observed and simulated data utilizing the procedure of quantile mapping. Generalized extreme value (GEV) distribution was selected for performing the quantile mapping. The parameters of the historical period were calculated and then applied to future periods. Figure 3 demonstrates the overall process of bias correction.
Proxy variables for flood risk
For the evaluation of the flood risk, proxy variables were selected following literature studies: the vulnerability assessment in Gyeonggi Province under climate change (Koh, 2009) and statistical and dynamical downscaling for extreme data in European regions (Climatic Research Unit (CRU), 2005). From the numerous indicators, extreme flood-related indicators were preferentially chosen. Table 1 describes proxy variables for the flood risk assessment.
Standardization of the selected indicators
 (1)
(1)Distribution fitting of the selected indicators
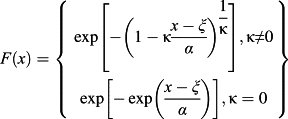 (2)
(2) (3)
(3)ξ , α , and κ mean location, scale, and the shape parameters, respectively (Stedinger et al., 1993).
Probabilistic risk assessment
 (4)
(4) (5)
(5) (6)
(6)Application to South Korea
Study area
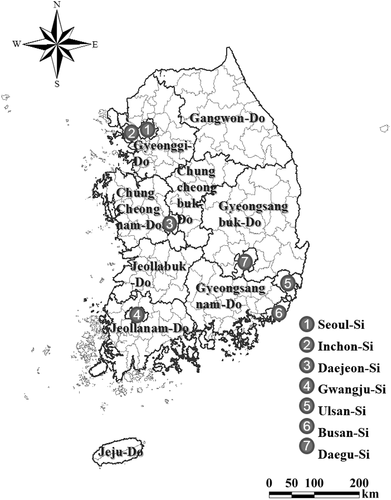
The study area was South Korea. The spatial and temporal resolutions were on a city and county basis and four time periods (1990s: 1976–2005, 2025s: 2011–2040, 2055s: 2041–2070 and 2085s: 2071–2100), respectively. The area of South Korea is 99 720 km2. South Korea consists of seven major cities and nine provinces. It has 65% mountainous area, which is situated on the eastern side. South Korea has four seasons and most of the precipitation is concentrated in the summer (Park et al., 2015). The average annual rainfall is 1280 mm (1978 ~ 2007). It is about 1.6 times the world average rainfall of 807 mm (MOLIT, 2012). The slope of the rivers is high and flood runoff occurs at the same time. Figure 4 displays the area examined in this study.
Bias correction
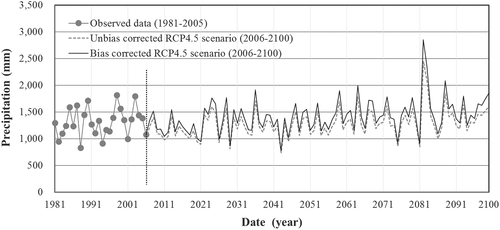
Figure 5 represents the result of bias correction between simulated and observed precipitation. It is clear that there was a discrepancy between the simulated and the observed precipitation during the entire period.
Flood risk indicators
Indicators were calculated to assess the flood risk for each of the administrative units. Four major indicators representing extreme events were selected. Tables 2-5 show average values of these indicators during the periods 1990s, 2025s, 2055s, and 2085s under the RCP4.5 and RCP8.5 scenarios.
| Region | CN80 | C90th | CSDI | CX5d |
|---|---|---|---|---|
| day | mm day−1 | mm day−1 | mm | |
| Seoul-Si | 2.6 | 44.2 | 15.5 | 228 |
| Inchon-Si | 1.2 | 32.7 | 11.9 | 182 |
| Daejeon-Si | 1.1 | 38.8 | 14.0 | 174 |
| Gwangju-Si | 1.9 | 37.8 | 11.8 | 233 |
| Ulsan-Si | 1.4 | 31.3 | 11.5 | 192 |
| Busan-Si | 0.9 | 30.2 | 11.2 | 183 |
| Gyeonggi-Do | 2.2 | 34.6 | 11.3 | 241 |
| Gangwon-Do | 1.7 | 43.8 | 15.9 | 230 |
| Chungcheongbuk-Do | 2.0 | 35.2 | 11.6 | 243 |
| Chungcheongnam-Do | 1.8 | 29.8 | 9.6 | 245 |
| Jeollabuk-Do | 1.5 | 30.6 | 10.4 | 229 |
| Jeollanam-Do | 1.0 | 32.4 | 11.6 | 184 |
| Gyeongsangbuk-Do | 1.5 | 25.7 | 8.4 | 204 |
| Gyeongsangnam-Do | 1.7 | 26.8 | 8.6 | 207 |
| Jeju-Do | 2.0 | 31.7 | 10.2 | 260 |
| Maximum | 2.6 | 44.2 | 15.9 | 260 |
| Average | 1.6 | 33.7 | 11.6 | 216 |
| Minimum | 0.9 | 25.7 | 8.4 | 174 |
- Refer to Table 1 for CN80, C90th, CSDI, and CX5d.
| Region | RCP4.5 scenario | RCP8.5 scenario | ||||||
|---|---|---|---|---|---|---|---|---|
| CN80 | C90th | CSDI | CX5d | CN80 | C90th | CSDI | CX5d | |
| day | mm day−1 | mm day−1 | mm | day | mm day−1 | mm day−1 | mm | |
| Seoul City | 3.3 | 50.0 | 17.7 | 305 | 3.4 | 48.9 | 17.4 | 273 |
| Inchon City | 1.5 | 36.3 | 13.3 | 214 | 1.4 | 34.5 | 12.9 | 209 |
| Daejeon City | 1.6 | 42.4 | 15.4 | 205 | 1.4 | 40.9 | 15.0 | 217 |
| Gwangju City | 2.4 | 41.6 | 13.3 | 276 | 2.5 | 40.9 | 14.4 | 357 |
| Ulsan City | 1.7 | 34.5 | 12.8 | 233 | 1.4 | 33.0 | 11.9 | 185 |
| Busan City | 1.4 | 33.1 | 12.1 | 187 | 1.1 | 32.2 | 11.7 | 194 |
| Gyeonggi Province | 2.6 | 38.7 | 12.6 | 287 | 2.4 | 36.3 | 12.4 | 273 |
| Gangwon Province | 1.9 | 46.5 | 17.0 | 260 | 1.7 | 41.8 | 16.1 | 245 |
| Chungcheongbuk Province | 2.5 | 39.8 | 13.1 | 296 | 2.3 | 36.6 | 12.6 | 277 |
| Chungcheongnam Province | 2.6 | 33.1 | 10.8 | 293 | 2.0 | 30.9 | 10.3 | 254 |
| Jeollabuk Province | 2.2 | 33.4 | 11.5 | 266 | 1.8 | 31.6 | 11.2 | 257 |
| Jeollanam Province | 1.5 | 35.1 | 13.0 | 228 | 1.2 | 33.4 | 12.3 | 203 |
| Gyeongsangbuk Province | 1.8 | 27.6 | 9.0 | 219 | 1.7 | 26.5 | 8.8 | 219 |
| Gyeongsangnam Province | 2.1 | 28.9 | 9.2 | 221 | 1.9 | 28.2 | 9.1 | 216 |
| Jeju Province | 2.5 | 35.4 | 11.6 | 321 | 2.1 | 32.7 | 10.9 | 251 |
| Maximum | 3.3 | 50.0 | 17.7 | 321 | 3.4 | 48.9 | 17.4 | 357 |
| Average | 2.1 | 37.1 | 12.8 | 254 | 1.9 | 35.2 | 12.5 | 242 |
| Minimum | 1.4 | 27.6 | 9.0 | 187 | 1.1 | 26.5 | 8.8 | 185 |
- Refer to Table 1 for CN80, C90th, CSDI, and CX5d.
| Region | RCP4.5 scenario | RCP8.5 scenario | ||||||
|---|---|---|---|---|---|---|---|---|
| CN80 | C90th | CSDI | CX5d | CN80 | C90th | CSDI | CX5d | |
| day | mm day−1 | mm day−1 | mm | day | mm day−1 | mm day−1 | mm | |
| Seoul City | 3.2 | 49.9 | 18.1 | 344 | 5.2 | 55.4 | 19.9 | 419 |
| Inchon City | 1.3 | 36.4 | 13.2 | 230 | 2.0 | 39.1 | 14.4 | 272 |
| Daejeon City | 1.4 | 40.4 | 14.8 | 211 | 1.8 | 43.9 | 15.8 | 247 |
| Gwangju City | 3.0 | 47.9 | 16.3 | 432 | 3.5 | 47.2 | 15.1 | 321 |
| Ulsan City | 1.7 | 35.3 | 13.2 | 272 | 2.3 | 36.8 | 14.5 | 362 |
| Busan City | 1.4 | 33.5 | 12.8 | 255 | 1.8 | 34.8 | 14.2 | 369 |
| Gyeonggi Province | 2.9 | 41.0 | 13.4 | 307 | 3.6 | 41.5 | 14.4 | 350 |
| Gangwon Province | 2.3 | 48.4 | 17.7 | 285 | 2.6 | 49.4 | 18.4 | 309 |
| Chungcheongbuk Province | 2.8 | 41.6 | 13.8 | 308 | 3.4 | 42.5 | 14.7 | 340 |
| Chungcheongnam Province | 2.7 | 33.5 | 11.2 | 307 | 3.0 | 35.2 | 11.9 | 335 |
| Jeollabuk Province | 2.5 | 34.2 | 12.2 | 323 | 2.9 | 36.3 | 13.0 | 337 |
| Jeollanam Province | 1.5 | 35.8 | 13.3 | 254 | 2.0 | 37.8 | 14.4 | 306 |
| Gyeongsangbuk Province | 2.1 | 28.6 | 9.5 | 255 | 2.3 | 29.6 | 10.0 | 273 |
| Gyeongsangnam Province | 2.2 | 29.6 | 9.6 | 264 | 2.7 | 30.7 | 10.3 | 287 |
| Jeju Province | 2.9 | 35.3 | 11.9 | 324 | 3.1 | 38.0 | 12.5 | 328 |
| Maximum | 3.2 | 49.9 | 18.1 | 432 | 5.2 | 55.4 | 19.9 | 419 |
| Average | 2.3 | 38.1 | 13.4 | 291 | 2.8 | 39.9 | 14.2 | 324 |
| Minimum | 1.3 | 28.6 | 9.5 | 211 | 1.8 | 29.6 | 10.0 | 247 |
- Refer to Table 1 for CN80, C90th, CSDI, and CX5d.
| Region | RCP4.5 scenario | RCP8.5 scenario | ||||||
|---|---|---|---|---|---|---|---|---|
| CN80 | C90th | CSDI | CX5d | CN80 | C90th | CSDI | CX5d | |
| day | mm day−1 | mm day−1 | mm | day | mm day−1 | mm day−1 | mm | |
| Seoul City | 4.9 | 54.7 | 19.5 | 404 | 5.1 | 54.2 | 23.0 | 594 |
| Inchon City | 2.1 | 40.4 | 14.9 | 295 | 2.4 | 40.0 | 15.5 | 303 |
| Daejeon City | 2.1 | 44.9 | 16.3 | 248 | 2.6 | 46.8 | 17.3 | 282 |
| Gwangju City | 3.8 | 50.0 | 16.6 | 384 | 3.6 | 46.9 | 17.7 | 460 |
| Ulsan City | 2.3 | 38.6 | 14.2 | 304 | 2.4 | 37.1 | 14.4 | 296 |
| Busan City | 1.9 | 37.4 | 14.0 | 271 | 1.9 | 35.3 | 14.2 | 294 |
| Gyeonggi Province | 3.6 | 43.1 | 14.8 | 381 | 3.4 | 40.9 | 14.8 | 378 |
| Gangwon Province | 2.6 | 50.4 | 18.5 | 302 | 2.3 | 48.7 | 18.8 | 301 |
| Chungcheongbuk Province | 3.5 | 44.2 | 15.2 | 394 | 3.1 | 41.2 | 15.2 | 372 |
| Chungcheongnam Province | 3.3 | 36.6 | 12.7 | 418 | 2.9 | 35.9 | 12.1 | 307 |
| Jeollabuk Province | 2.9 | 36.9 | 13.4 | 387 | 2.9 | 36.6 | 13.4 | 322 |
| Jeollanam Province | 2.0 | 39.0 | 14.6 | 304 | 2.1 | 38.3 | 14.9 | 286 |
| Gyeongsangbuk Province | 2.4 | 30.2 | 10.2 | 287 | 2.1 | 29.1 | 9.9 | 254 |
| Gyeongsangnam Province | 2.6 | 31.2 | 10.4 | 281 | 2.6 | 30.8 | 10.4 | 282 |
| Jeju Province | 3.2 | 39.0 | 13.0 | 368 | 3.2 | 38.0 | 12.9 | 316 |
| Maximum | 4.9 | 54.7 | 19.5 | 418 | 5.1 | 54.2 | 23.0 | 594 |
| Average | 2.9 | 41.1 | 14.6 | 335 | 2.8 | 40.0 | 15.0 | 336 |
| Minimum | 1.9 | 30.2 | 10.2 | 248 | 1.9 | 29.1 | 9.9 | 254 |
- Refer to Table 1 for CN80, C90th, CSDI, and CX5d.
During the 1990s period, it appeared that Seoul City showed the highest values of CN80 and C90th, Gangwon Province presented the highest values of CSDI, and Jeju Province showed the highest value of CX5d.
During the 2025s period, Seoul City showed the highest values of CN80, C90th, and CSDI, and Jeju Province showed the highest value of CX5d.
During the 2055s period, Seoul City again showed the highest values of CN80, C90th, and CSDI, while Gwangju City showed the highest value of CX5d.
During the 2085s period, Seoul City again showed the highest values of CN80, C90th, and CSDI, while Chungcheongnam Province showed the highest value of CX5d.
According to these indicators it seems that Seoul City shows the highest values, and the flood risk and indicators continue to increase over time.
Probability distribution of the selected indicators
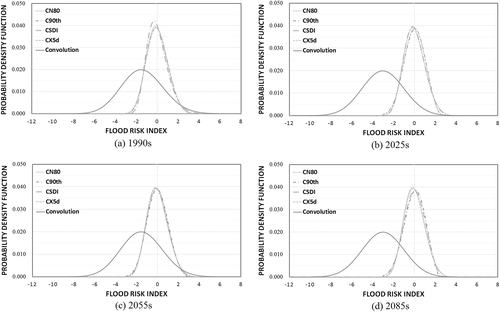
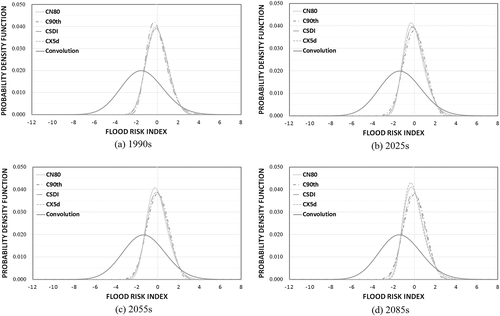
The selected indicators were fitted into a probability distribution using the GEV distribution to estimate a composite indicator, and convolution is the operation used to produce a third pdf by integrating two others. Figures 6 and 7 illustrate probability distributions for the periods 1990s, 2025s, 2055s, and 2085s under the RCP4.5 and RCP8.5 scenarios. The dotted lines show the probability distributions of the flood risk indicators and the green line represents the probability distribution with convolution applied. It seems that over time the green line has shifted to the right. This means that the probability in future periods is higher than in past ones.
Probabilistic flood risk assessment
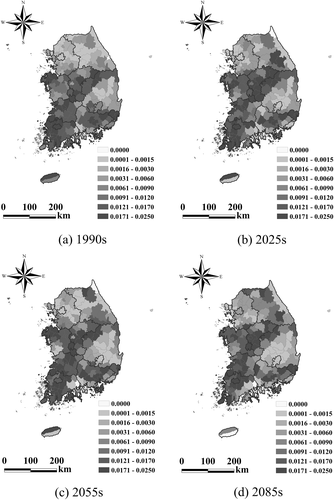
By using probability distributions with applied convolution, flood risks were evaluated as probabilities at city and county levels. The flood risk probability ranged from 0.0000 to 0.0250. The spatial comparisons of flood risk probability were evaluated by ArcGIS (ESRI, Version 10.1, USA), with probability classified into eight quantiles. Figures 8 and 9 illustrate flood risk probabilities under the RCP4.5 and RCP8.5 scenarios. Yellow means lower probability and red indicates relatively higher probability.
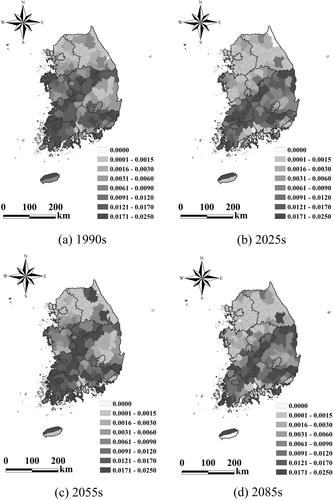
During the 1990s period, the Central Region, the South-west Region, and Gyeongsangnam Province of South Korea showed a high-level probability of flood risk. Generally, other regions showed lower-level probability. During the 2025s period based on the RCP4.5 scenario, the flood risk of Chungcheongnam Province decreased and the flood risk of Gyeongsangbuk Province increased. However, most of the southern regions still maintained higher probability. During the 2055s period based on the RCP4.5 scenario, the flood risk generally increased in South Gyeonggi Province, the Central Region, and the South coast. During the 2085s period based on the RCP4.5 scenario, the calculated probabilities revealed a tendency to decrease compared with the 2055s period. However, most of the southern regions still maintained a higher probability, especially Gyeongsangbuk Province.
During the 2025s and 2055s periods under the RCP8.5 scenario, the flood risk maintained a high value in the central and southern regions: Chungcheongbuk, Chungcheongnam, Jeollabuk, Jeollanam, and Gyeongsangnam provinces. During the 2085s period based on the RCP8.5 scenario, the flood risk increased sporadically including Gyeonggi and Gangwon provinces. The flood risk of Gyeongsangbuk Province displayed a low value.
Conclusions
In this study, flood risk was evaluated by using a probabilistic method under the IPCC's RCP4.5 and RCP8.5 scenarios. A GEV distribution was selected to fit the flood risk indicators into a probability distribution, and convolution was used to generate an integrated pdf for probabilistic assessment of the flood risk. By using ArcGIS, flood risk probabilities were analysed and expressed spatially.
The results of this study show flood risk increasing in the near future, the 2055s period, and maintaining a high value of flood risk to the 2085s period under the RCP8.5 scenario. In particular, the extent of the increase from the 2025s to the 2055s under the RCP4.5 scenario is so large that countermeasures need to be developed in advance. It is also estimated that southern areas are at increasing risk of flooding. There is significant agricultural infrastructure, such as reservoirs, irrigation systems, drainage systems, and flood control systems in southern areas, including Jeollabuk and Jeollanam provinces. This implies that rural as well as urban areas should be made more resilient to climate change. The design criteria of these facilities may not be adequate for future flood risk. It is therefore necessary to redesign these facilities according to future flood risk.
Thus, the flood risk probabilities assessed in this study can indicate priorities to enhance the resilience of regions to climate change and can be used as proper data to establish a climate change adaptation policy.
Acknowledgements
This research was supported by the Korean Institute of Planning and Evaluation for Technology in Food, Agriculture, Forestry and Fisheries (IPET) through the Advanced Production Technology Development Programme, which is funded by the Ministry of Agriculture, Food and Rural Affairs (MAFRA) (code No. 112041-3).


