How do investors price stocks?—Evidence with real-time data from Vietnam
Abstract
Our paper employs a data set that comprises real-time data, which, in our study, is defined as the best known data available to investors at the time of making decision. The research was inspired by comments by industry leaders at an international conference in finance in Vietnam in 2016, basically implying that academic research findings were not useful to investors because they had not done in the way that investors think and do. Drawing on an alike experiment study using real-time data for a period from October 2010 to April 2014, our paper documents that the value and liquidity effect do not exist in Vietnam, and the size effect is weak. Specifically, we find that growth and high-liquidity stocks outperform and do not find strong evidence for the outperformance of small stocks. This finding contradicts the general literature, which suggests that value, low liquidity, and small stocks outperform but supports similar contradicting findings for emerging markets. The findings from our research are important to investors in Vietnam market because they are drawn on the decision-making basis that investors in this market normally do. Our research findings also suggest the use of a multifactor pricing model that is relevant for valuing stocks in Vietnam. In addition, to check the reliability of our data set and the robustness of our conclusions, we repeated the same procedure using two samples of historical data and compared with results from our data. The additional analysis confirms the reliability of our data and findings.
1 INTRODUCTION
A huge volume of research papers have been devoted to understanding how stocks are priced. Various factors have been reported to play a significant role in pricing stock returns. Among the most common factors are size, value, and liquidity. Seminal works suggest that small stocks (e.g., Banz, 1981; and Basu, 1983), value stocks (e.g., Ball, 1978; Basu, 1977; Stattman, 1980; or and Rosenberg, Reid, & Lanstein, 1985), and low-liquidity stocks (e.g., Amihud & Mendelson, 1986) outperform because investors require higher returns to compensate for higher risks resulting from holding small size, high book to market/low price to earnings and illiquid stocks.
Follow-on empirical research findings are mostly unanimous. For example, researchers find that value stocks, as shown by low price to earnings (e.g., Jaffe, Keim, & Westerfield, 1989) or high book to market (e.g., Asness, Moskowitz, & Pedersen, 2013; Fama & French, 1992, 1998, 2015a, 2015b) outperform other stocks on risk-adjusted basis. In the literature, this is documented as the value effect. The size effect, in which small stocks outperform large stocks, is also well reported in the study of Fama and French (1992, 1998, 2015a, b). Other researchers, such as Amihud (2002), Brennan and Subrahmanyam (1996), Haugen and Baker (1996), Chalmers and Kadlec (1998), Brennan, Chordia, and Subrahmanyam (1998), Chordia, Roll, and Subrahmanyam (2001), Chan and Fa (2005), and Garleanu (2009) show the liquidity effect that sees low liquid stocks doing better.
Although the value, size, and liquidity effects are well documented in the literature, most research findings are reported for U.S. or developed markets. When it comes to international markets, or emerging markets, findings, however, are not always in agreement. Besides supportive evidences found in research studies, such as Fama and French (1998) for value effect in international markets, Wong (1989) for size effect in a single emerging market like Singapore, Groot, Pang, and Swinkels (2012) for value and size effect in a sample of twenty four most liquid frontier emerging markets, Hanauer and Linhart (2015) for strong and highly significant value effect in four emerging market regions—Latin America, EMEA, Asia, and BRIC, or Ho and Chang (2015) for liquidity effect in Chinese market etc., we also see evidences of the non-existence of these effects in other research studies and other markets.
Rouwenhorst (1999) finds value and size effects for emerging markets for a period from 1982 to 1987, but does not find the role of liquidity. Similarly, Lischewski and Voronkova (2012) find the size and value effects but not liquidity effect for the Polish market in Central and Eastern Europe. Barry, Goldreyer, Lockwood, and Rodriguez (2002) study the size and value effects in 35 emerging markets over the period 1985–2000, and find the existence of value effect but not the size effect measured by absolute firm size. Wang and Xu (2004) find that value effect does not exist in the A-class shares on the Chinese stock market for the period 1990–2002, but the size and liquidity effect measured by free float do. Another research by Van der Hart, Slagter, and van Dijk (2003) finds evidences in favour of size and value effects in internationally diversified stock portfolios but weak evidences for individual country portfolios. Notably, Claessens and Dasgupta (1995) report the role of value, size, and trading volume in explain cross-section stock returns in some of the 20 emerging markets over the period from 1986 to 1993, but with the opposite signs. In other words, their research shows opposite findings on the value, size, and liquidity effects.
Indeed, the various and different findings from different markets induce us to think that the size, value, and liquidity effects should be more appropriately concluded for individual markets. Although the literature in this field is fairly extensive, not many research studies have examined Vietnam market, perhaps because of its short history with trading starting only from the year 2000, and with listed companies not representing the economy until after 2008 or 2009, when more large companies became listed. Of the few, findings have mostly shown results in agreement with the literature (see,e.g., Le, 2015; Nguyen, 2012). Some papers, however, have reported contradicting results. Chin and Nguyen (2015) find that small stocks do not outperform, and Vo and Bui (2016) report a positive relationship between level of liquidity and stock returns, which implies that investors demand higher returns for more liquid stocks.
The variance in empirical findings in Vietnam implies that more research studies are needed to provide a more comprehensive picture about this market. The simple aim of our research therefore is to provide additional evidences to the literature to help understand better the risk factors of stock returns in Vietnam. Nonetheless, the special about this research is that we use real-time data instead of historical data that is prevailing in the literature. Real-time data in our study is defined as the best known data available to investors at the time of making decision. Real-time data gives us the opportunity to examine an alike experimental study on how investors practically price stocks because they, in reality, have to make decision based on what is best known to them at the time. This idea was inspired by comments from industry leaders such as from the CEO of StoxPlus, a leading financial data provider in Vietnam, during the International Conference in Finance in Vietnam in 2016, that academic research, which was supposed to help (investors) making decisions, had not been done in a way that practitioners normally think and do (in Vietnam), and thus, academic research was mostly useless to investors. In addition, this paper, after examining the value, size, and liquidity effect, also investigates if they are the risk factors in a multifactor pricing model that investors could use for the Vietnam market.
Contradicting to the existing literature but in line with some other findings for Vietnam (Chin & Nguyen, 2015; Vo & Bui, 2016), we find that higher returns are significantly associated with growth and high-liquidity stocks and weakly with small stocks. In other words, although the role of value or growth, liquidity, and size is found, we do not see the value and liquidity effect as shown in the general literature. Our findings, to some extent, are similar to those from Claessens and Dasgupta (1995). Further tests suggest that value, liquidity, and size are risk factors in a multifactor pricing model, but there are also other factors that are not identified.
Our findings offer some practical implications to investment managers in Vietnam, such as that winning strategies should include a combination of growth, more liquid, and (albeit weak) small stocks and that they could rely on our multifactor pricing model for stock valuation purpose. Our recommendation on winning strategies is somewhat contradictory to the existing literature, which basically suggests that value, small, low-liquidity stocks should outperformance. Therefore, we believe that a straight application of research findings from general literature, which is normally built on findings from developed markets to a particular market, in this case an emerging market, could be misled. Investment managers are advised to use empirical research findings specifically designed for that specific market. Interestingly, our findings show that using real-time data does alter the value effect but is in line with findings using historical data from Vo and Bui (2016) for liquidity effect and Chin and Nguyen (2015) for size effect. Our research, hence, adds new evidence for the nonexistence of value effect (or the existence of growth effect) in Vietnam.
The rest of this paper is organized as follows. The next section details sample and data used for this research. The econometric procedure introduces how the two-stage regression is used to gauge the findings. The empirical findings are then reported with some discussions before some concluding remarks are presented in the last section.
2 SAMPLE AND DATA
2.1 Sample
Vietnam marked its stock market trading with the introduction of the Ho Chi Minh Stock Exchange (HSX) in the year 2000. This market is currently classified as one of 23 markets in the Morgan Stanley Capital International (MSCI) Emerging and Frontier Markets. The market has attracted an increasing attention from foreign investors who currently own approximately 33% of the total market capitalization with around 3,000 institutional and 16,000 individual investors, comparing with nearly 900,000 local investors. There are two ETFs listed on London Stock Exchange (FTSE ETF) and New York Stock Exchange (VNM ETF) specializing in this market with total assets under management of around $1 bn at the setup.
According to the World Bank Data, Vietnam market ranks in top 50 globally for both market capitalization of domestic listed companies and the market capitalization as percentage of gross domestic product. It is, however, notable that although the number of listed companies is around 800, a number of 60 companies already account for roughly 80% of the total market capitalization. The main concern for investors in this market is the low liquidity, measured by the trading volume, and thus, the common sense is that the share prices of very low liquid stocks are very likely to be manipulated. In other words, stocks with very low trading volume do not help understanding well how investors actually value stocks.
In this research, we use a data set collected during a period from October 2010 to April 2014, when the author worked and was able to access to the data room located at the Research and Advisory Department at a local investment bank in Vietnam. The sample comprises 60 stocks listed on the two exchanges, the Ho Chi Minh and Hanoi. Selected stocks are in the group of biggest market capitalization, representing 80% of the total market capitalization and of highest average daily trading volume—100,000 shares or above. In our opinion, this sample is the best, at the time, to minimize the effect of price fixing whereas represents the Vietnam market as a whole. The time period fortunately represents well; also, the Vietnam economy as most important companies in key industries were listed during 2008–2009.
2.2 Data
Our data is real time. We claim our data as real time in the sense that it was best known at the time of making trading decision. For example, earnings and book value are generally assumed to be reported at the end of each quarter but in fact, many companies in Vietnam only reported two or three quarters later. As an illustration, Hoang Anh Gia Lai (HAG on HSX) and HAGL Agrico (HNG on HSX)—two companies that are well known to foreign investors—have recently been warned about the possibility of being delisted by regulators for not releasing their financial statements in time for three consecutive times in a year.
For each company, analysts at the investment bank where the author worked collected data from all possible sources to ensure that the company's earnings and book value were best known at each observation period. In this approach, for each period, the analysts considered first the official data from company's statements, then the average estimate by brokerage houses, and last, the data from the same observation period in previous year. The sources of information they searched for included those from the two stock exchanges and from the largest data providers in the local market, that is, the StoxPlus, the Vietstock, the CafeF, or the Bloomberg. Our data therefore is distinguished from historical data, which basically means that data needed for one period is readily available for observation or known for that period. We believe that real-time data may give some insights into how investors practically price stocks because they, in reality, have to make decision based on what is best known to them at the time. It should be noted also that our data is not private, collected from public sources, and thus, investors are able to access to them.
During the period from October 2010 to April 2014, at the end of each month, data were collected and computed to generate price to earnings ratio (PER) and price to book value ratio (PBR) on 12-month trailing basis, that is, the price at the time of observation is divided by the trailing earnings and book value per share for the past 12 months. This calculation is in line with how (mostly individual) investors typically look at PER and PBR in Vietnam. The market value (MAV) was computed using the number of outstanding shares and the share price at the end of the month. The trading volume (VOL) was calculated to represent the average daily trading volume of the month. Again, these calculations reflect the way investors look at MAV and liquidity in Vietnam. It is worth noting here that because we want to mimic the way investors actually price stocks, we just look at trading volume as a proxy for liquidity although we are aware of different measurements of liquidity in the literature (e.g., Amihud, 2002, Chordia et al., 2001). The returns on stocks were computed taking into account the capital gain element only because the dividend yield in Vietnam is extremely low (approximately 1% annually on average) and because very often dividends are noncash dividends. The VNINDEX was used to calculate the broad market return whereas the one-year T-bill yield was used as the proxy for the risk-free rate. All returns were computed as net of transaction costs, which are dependent on brokerage houses but on average at 0.2% of the trading values. We, however, note that as portfolios were constructed on naïve basis, and the transaction costs were relatively small, transaction costs would not change much the research results if the original returns were used.
Every month, we ranked stocks and assigned them into three groups: High, Medium, and Low with 20 stocks in each group, using four firm-level characteristics including PER, PBR, MAV, and VOL. Our ranking procedure is different from the common procedure in the literature, which normally ranks stocks on yearly basis, taking data from July to June of the precedent year (see,e.g., Fama & French, 1993). We believe that ranking stocks on monthly basis is more reasonable for a highly volatile market like Vietnam's because stocks may change their characteristic group very quickly. As an example, a stock is classified as low PER this month could fall into high-PER group in the following month. Certainly, the changes in firm characteristics would affect the investor behaviour. This ranking approach is therefore more relevant for a market where individual investors are basically day traders seeking for very short-term returns, rather than buy and hold investment managers.
In order to show that our real-time data and the way we rank stocks on monthly basis are relevant to draw reliable conclusions, we also collected two historical data sets from the StoxPlus—a leading financial data provider in Vietnam—and from the Datastream using the same sample of companies and the same time period, then processed all three data samples in the same way. Details of data analysis are presented in the section discussing the empirical findings, but the analysis suggests that using real-time data and ranking stocks on monthly basis is indeed convincing to conclude findings on how investors actually price stocks for a volatile market like Vietnam.
3 ECONOMETRIC PROCEDURE
 (1)
(1)With respect to the stylized investments strategies, we form portfolios using four firm characteristics. Specifically, we consider a combination of size and value and of liquidity and value because these are common strategies followed by investors in Vietnam. Eventually, we have four pairs (MAV, PER; MAV, PBR; VOL, PER; and VOL, PBR) and a total of 36 portfolios.
 (2)
(2)In this model, at time t, the left-hand side represents the excess return on portfolio i, RM is the market return, rf is the risk-free return whereas the HMLf is the factor f. The βi,f indicates the sensitivity coefficient of factor HMLf to portfolio return Ri. We run 36 time series regressions in this stage.
Also in this stage, to investigate the explanatory power of the generic model of stock returns, we look at the Gibbons Ross Shanken (GRS) F-test (Gibbons, Ross, & Shanken, 1989). The GRS tests whether the regression intercepts are jointly equal to zero. If the intercept is statistically and significantly different from zero, the model does not completely captures the stock returns (Merton, 1973).
 as the estimated βi, f for each portfolio i and with respect to factor HMLf and run the cross-sectional regression using the following form:
 (3)
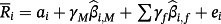
(3) represents the average monthly excess return for portfolio i. The γM and γf coefficients represent the market and factor risk premium. If the coefficients (in 3) are statistically and significantly different from zero, it is interpreted that the risk factors (in 2) are explanatory of stock returns.
4 EMPIRICAL FINDINGS
4.1 Data analysis
We start this section with an analysis of the distinguished features of our data sample to emphasize why it is useful and reliable to draw research findings. There are two important features that have been described in the Sample and Data section above, including the use of real-time data in the sense that it was best known at the time of making trading decision and the ranking procedure, which was implemented on monthly basis instead of yearly as normally used in the literature. With respect to ranking stocks on monthly basis, we believe that it is more reasonable for a volatile market like Vietnam's because stocks may change their characteristic group very quickly.
On using real-time data, it is practical to see that some data, especially earnings and book value, were not available at the time of making decision due to reasons such as companies not releasing financial statements in time as required. With historical data, obviously, we do not see this problem because data are available at all time. Hence, it is reasonable to assume that investors had to make decisions based on estimated figures, that is, the best known available to them at the time. Rationally, we should expect some differences between our data and the historical data, but the majority of the two types of data should be consistent. The differences may also represent the statistical errors. In addition, as earnings are the most likely figures that are subject to data unavailability, we expect the differences in relation to PER the highest, followed by PBR and MAV and VOL. The differences in MAV and VOL are mainly because of statistical errors.
To prove the above hypotheses on data, we collected two separate historical data sets from two main sources that academics have mostly relied on for research into the Vietnam market, including the StoxPlus—a leading financial data provider in Vietnam—and the Datastream. The historical data were collected for the sample of companies with the time period and intervals exactly the same as in our sample. We then followed the same procedure as we did for our sample to calculate the interested variables for two historical data samples. The comparison between our sample and the two historical data samples is presented in Table 1.
| We collected historical data from two main sources, namely the StoxPlus – a leading financial data provider in Vietnam and Datastream, to compare with our sample. The sample of companies and the methods used for calculating variables of interest i.e. PER, PBR, MAV and VOL and for ranking individual companies are exactly the same for all three data sets. Panel A represents the percentage of differences in ranking between our sample and StoxPlus and Datastream in four ranking criteria. Total number of observations is 2580 for the period from Oct 2010 to Apr 2014. Panel B represents the changes in ranking from month t to month t + 1 in three data sets. The total number of observations is 2520 for the period from Oct 2010 to Apr 2014. Panel C represents the percentages of stocks that have at least one change in their monthly ranking over a period from Oct 2010 to Apr 2014. The total number of observations is 60 companies | ||||
|---|---|---|---|---|
| Panel A - Differences in ranking between real-time and historical data | ||||
| PER | PBR | MAV | VOL | |
| StoxPlus | 29.03% | 11.67% | 3.95% | 2.60% |
| Datastream | 26.36% | 14.03% | 9.53% | 2.52% |
| Panel B - Percentage of changes in ranking from month t to month t + 1 | ||||
|---|---|---|---|---|
| Our sample | 13.25% | 10.87% | 3.97% | 23.37% |
| StoxPlus | 12.78% | 10.00% | 3.33% | 22.86% |
| Datastream | 12.22% | 11.11% | 1.43% | 22.86% |
| Panel C - Percentage of stocks having at least one change in their monthly ranking | ||||
|---|---|---|---|---|
| Our sample | 95.00% | 81.67% | 51.67% | 91.67% |
| StoxPlus | 96.67% | 86.67% | 48.33% | 91.67% |
| Datastream | 93.33% | 83.33% | 41.67% | 91.67% |
The Panel A of the Table 1 shows the differences in group ranking of individual stocks with respect to four variables used in the paper. The result suggests that about 29.03% and 26.36% of stocks could have been ranked differently by PER if historical data from the StoxPlus and Datasteam were used, respectively. The figures for PBR are 11.67% and 14.03% whereas those for MAV and VOL are relatively low. These results are within our expectation. Specifically, they show that although there are some differences in four main variables of interest, the majority are similar to those from the two historical data sources. They also indicate that earnings variable (PER) is most likely to be affected, followed by book value (PBR) if different data set is used.
Panel B and C of Table 1 report the changes in ranking of individual stocks from this month (t) to next month (t + 1). Overall, Panel B shows that in all four ranking criteria, we do see changes in ranking from this month to next one. The ranking in volume is most likely to change in all three samples with 23–24% of observations changing their rank, followed by ranking in price to earnings and PBR. Panel C suggests that the percentage of stocks that have at least one monthly ranking change accounts for 42% to as higher as 97% in all four ranking criteria. In other words, the results imply that ranking of individual stocks does change from month to month. This finding, together with the above, hence supports our view that using real-time data with monthly ranking procedure is relevant to see how investors practically price stocks.
4.2 Descriptive findings
Panels A, B, and C of Table 2 provide some statistics of the factors and of the stylized investment portfolios used in our research. The statistics are descriptive, but they do show some interesting indications. In both Panels A and B, in terms of value characteristic, we see a pattern that portfolios of High PER and High PBR stocks outperform those of Low PER and Low PBR. With respect to size characteristic, we see that portfolios of Medium and Low MAV stocks, although not really clearly, tend to perform better. And last, for liquidity characteristic, portfolios of High VOL stocks are seen outperforming other portfolios. The winning strategies therefore are the combinations of Medium/Low MAV and High PER, PBR stocks and of High VOL and High PER, PBR stocks. This indicative finding is supported by the statistics of the factor means (Panel C), which basically show that the portfolios of High PBR and High VOL portfolios outperform the others. Panel C, however, does not indicate that the portfolios of Medium/Low MAV should perform better.
| Panel A and B respectively present the monthly excess returns of portfolios formed by pairs of Size (MAV) and Value (PER and PBR) and of Liquidity (VOL) and Value (PER and PBR) characteristics. The total number of observations is 43 for the period from Oct 2010 to Apr 2014 | |||||||
|---|---|---|---|---|---|---|---|
| Panel A – Size (MAV) and Value (PER and PBR). | |||||||
| MAV\PER | Low | Medium | High | MAV\PBR | Low | Medium | High |
| Low | −0.07% | 0.31% | 0.78% | Low | −0.86% | 0.22% | 3.02% |
| Medium | −0.17% | 2.12% | 0.38% | Medium | −0.06% | 0.31% | 2.70% |
| High | −0.71% | 1.03% | 0.59% | High | −1.07% | −0.57% | 1.37% |
| Panel B – Liquidity (VOL) and Value (PER and PBR) | |||||||
|---|---|---|---|---|---|---|---|
| VOL\PER | Low | Medium | High | VOL\PBR | Low | Medium | High |
| Low | −0.45% | −0.45% | −0.37% | Low | −2.02% | −1.35% | 1.36% |
| Medium | −1.50% | 0.23% | 1.26% | Medium | −1.35% | −0.85% | 2.30% |
| High | 1.09% | 2.23% | 2.27% | High | 0.22% | 1.39% | 4.79% |
| Panel C – Descriptive statistics of risk factors | ||||
|---|---|---|---|---|
| Summary statistics for explanatory variables from Oct 2010 to Apr 2014 (43 months). At the end of each month, we rank and allocate stocks in the sample into High, Medium and Low group using three firm characteristics including Price to Book ratio (PBR), Market Value (MAV) and Trading Volume (VOL). We construct the risk factor (HMLf) by taking the difference between the return on portfolio of stocks ranked as High and those ranked as Low. For example, HMLPBR is the difference between the return on portfolio of stocks ranked as High PBR and those ranked as Low PBR. The market risk factor (RM) is the monthly index excess return. | ||||
| RM | HMLPBR | HMLMAV | HMLVOL | |
| Mean | −0.00123 | 0.02687 | 0.00570 | 0.02073 |
| Median | −0.00986 | 0.03257 | 0.00802 | 0.01718 |
| Maximum | 0.15297 | 0.12676 | 0.11625 | 0.18083 |
| Minimum | −0.13268 | −0.09468 | −0.24138 | −0.06547 |
| Std. Dev. | 0.06146 | 0.05366 | 0.05926 | 0.06141 |
| Observations | 43 | 43 | 43 | 43 |
Although the above findings are just descriptive, the implication for investment management is important. Academically, it implies that a selection of growth stocks (High PER and High PBR) and high-trading volume (High VOL) tends to perform better. Whereas the outperformance of growth stocks is contradicting to the existing literature (e.g., Amihud & Mendelson, 1986; Fama & French, 1992, 1993), that of high-trading volume stocks is in agreement with Vo and Bui (2016) for the Vietnam market. Practically, it indicates the fact that investors in an emerging market like Vietnam do not seek value but growth stocks. This is perhaps because of the dominance of individual investors, who account for roughly 90% of the average market-trading volume and who focus on seeking very short-term capital gains from trading rather than values created by companies in long term.
4.3 Times series of stock returns
In Table 3 from Panel A to D, we report the results from first-stage regressions with time series data using Equation 2. The results show that at the minimum confidence level of 90%, all four factors are seen statistically significant in majority of regressions. Specifically, the market factor (RM) is significant in all regressions, indicating that it is an important explanation of the stock returns. The value factor (HMLPBR) is seen significantly influencing the stock returns in most regressions but not in some of regressions on portfolios formed by PER. Similarly, the size factor (HMLMAV) is seen statistically significant in most regressions but not in some of regressions on portfolios of big MAV. And last, the liquidity factor (HMLVOL) is significantly related to most portfolio returns but not to some of the portfolios of Medium/Low VOL stocks.
| Panel A: Regressions of portfolios formed by Size (MAV) and Value (PER) | |||||||
|---|---|---|---|---|---|---|---|
| This table presents results from our regressions using the equation 2 as follows: | |||||||
| Ri, t = αi + βi, M[RM, t − rf, t] + ∑ βi, fHMLft + εit | |||||||
| The dependant variables include excess monthly returns on nine portfolios formed by Size (MAV) and Value (PER). The explanatory variables include four risk factors i.e. RM, HMLPBR, HMLMAV and HMLVOL. We run 9 regressions for the period from Oct 2010 – Apr 2014 with total 43 observations for each regression. On the left of the table, we report the coefficients for all four factors, followed by R-squared. On the right of the table, we report the t-statistics for the correspondent factor coefficients | |||||||
| Coefficients | t – Statistics | ||||||
| MAV\PER | Low | Medium | High | MAV\PER | Low | Medium | High |
| Market factor - RM | Market Factor - RM | ||||||
| Low | 0.8704 | 1.0092 | 1.1533 | Low | 10.2496 | 7.6545 | 6.1361 |
| Medium | 0.8695 | 1.0667 | 1.3184 | Medium | 9.3541 | 10.31089 | 7.4065 |
| High | 0.7169 | 0.8698 | 1.0681 | High | 5.9626 | 8.1409 | 21.7170 |
| Value factor - HMLPBR | Value factor - HMLPBR | ||||||
| Low | −0.0227 | 0.3330 | 0.2764 | Low | −0.2187 | 2.0702 | 1.2053 |
| Medium | 0.2590 | 0.5125 | −0.2487 | Medium | 2.2838 | 4.060204 | −1.1450 |
| High | −0.1423 | 0.0071 | 0.0607 | High | −0.9703 | 0.0546 | 1.0118 |
| Size factor - HMLMAV | Size factor - HMLMAV | ||||||
| Low | −0.6808 | −1.7223 | −1.4607 | Low | −7.1353 | −11.6261 | −6.9167 |
| Medium | −0.7577 | −0.9973 | −0.4327 | Medium | −7.2551 | −8.58036 | −2.1636 |
| High | −0.1415 | 0.0281 | 0.0388 | High | −1.0477 | 0.2345 | 0.7013 |
| Liquidity factor - HMLVOL | Liquidity factor - HMLVOL | ||||||
| Low | 0.0762 | 0.3506 | 0.7431 | Low | 0.9296 | 2.7549 | 4.0962 |
| Medium | 0.1252 | 0.5602 | 0.4887 | Medium | 1.3952 | 5.609757 | 2.8444 |
| High | 0.3447 | 0.3029 | 0.2268 | High | 2.9705 | 2.9368 | 4.7767 |
| R-Squared | Low | Medium | High | ||||
| Low | 0.8801 | 0.8949 | 0.8313 | ||||
| Medium | 0.8433 | 0.8905 | 0.7956 | ||||
| High | 0.7216 | 0.7573 | 0.9492 | ||||
| Panel B: Regressions of portfolios formed by Size (MAV) and Value (PBR) | |||||||
|---|---|---|---|---|---|---|---|
| This table presents results from our regressions using the equation 2 as follows: | |||||||
| Ri, t = αi + βi, M[RM, t − rf, t] + ∑ βi, fHMLft + εit | |||||||
| The dependant variables include excess monthly returns on nine portfolios formed by Size (MAV) and Value (PBR). The explanatory variables include four risk factors i.e. RM, HMLPBR, HMLMAV and HMLVOL. We run 9 regressions for the period from Oct 2010 – Apr 2014 with total 43 observations for each regression. On the left of the table, we report the coefficients for all four factors, followed by R-squared. On the right of the table, we report the t-statistics for the correspondent factor coefficients | |||||||
| Coefficients | t – Statistics | ||||||
| MAV\PBR | Low | Medium | High | MAV\PBR | Low | Medium | High |
| Market factor - RM | Market Factor - RM | ||||||
| Low | 0.9242 | 0.9681 | 1.0535 | Low | 14.8266 | 7.0649 | 5.8194 |
| Medium | 1.1915 | 1.1112 | 0.8204 | Medium | 8.8517 | 10.2639 | 6.9450 |
| High | 0.6204 | 0.9558 | 0.9935 | High | 3.8754 | 7.8755 | 18.7336 |
| Value factor - HMLPBR | Value factor - HMLPBR | ||||||
| Low | −0.3208 | 0.1127 | 1.0937 | Low | −4.2186 | 0.6743 | 4.9515 |
| Medium | −0.4903 | 0.1165 | 0.8421 | Medium | −2.9852 | 0.8822 | 5.8427 |
| High | −0.3351 | −0.3468 | 0.2794 | High | −1.7155 | −2.3425 | 4.3176 |
| Size factor - HMLMAV | Size factor - HMLMAV | ||||||
| Low | −0.7840 | −0.9296 | −1.4825 | Low | −11.1950 | −6.0383 | −7.2885 |
| Medium | −0.2228 | −0.8042 | −1.0553 | Medium | −1.4732 | −6.6115 | −7.9507 |
| High | −0.1465 | −0.0277 | 0.0432 | High | −0.8146 | −0.2031 | 0.7243 |
| Liquidity factor - HMLVOL | Liquidity factor - HMLVOL | ||||||
| Low | 0.2183 | 0.3631 | 0.3996 | Low | 3.6275 | 2.7456 | 2.2870 |
| Medium | 0.6618 | 0.2343 | 0.4006 | Medium | 5.0939 | 2.2420 | 3.5133 |
| High | 0.3270 | 0.1707 | 0.3362 | High | 2.1163 | 1.4573 | 6.5668 |
| R-Squared | Low | Medium | High | ||||
| Low | 0.9592 | 0.8202 | 0.7192 | ||||
| Medium | 0.8804 | 0.8733 | 0.7752 | ||||
| High | 0.6044 | 0.7783 | 0.9322 | ||||
| Panel C: Regressions of portfolios formed by Liquidity (VOL) and Value (PER) | |||||||
|---|---|---|---|---|---|---|---|
| This table presents results from our regressions using the equation 2 as follows: | |||||||
| Ri, t = αi + βi, M[RM, t − rf, t] + ∑ βi, fHMLft + εit | |||||||
| The dependant variables include excess monthly returns on nine portfolios formed by Size (MAV) and Value (PBR). The explanatory variables include four risk factors i.e. RM, HMLPBR, HMLMAV and HMLVOL. We run 9 regressions for the period from Oct 2010 – Apr 2014 with total 43 observations for each regression. On the left of the table, we report the coefficients for all four factors, followed by R-squared. On the right of the table, we report the t-statistics for the correspondent factor coefficients | |||||||
| Coefficients | t – Statistics | ||||||
| VOL\PER | Low | Medium | High | VOL\PER | Low | Medium | High |
| Market factor - RM | Market Factor - RM | ||||||
| Low | 0.8804 | 0.8969 | 1.2215 | Low | 12.1115 | 7.5553 | 15.0060 |
| Medium | 0.9867 | 0.8864 | 1.2299 | Medium | 9.3317 | 7.8151 | 8.5602 |
| High | 0.7431 | 0.9733 | 1.1443 | High | 5.9336 | 6.7739 | 9.6275 |
| Value factor - HMLPBR | Value factor - HMLPBR | ||||||
| Low | 0.1078 | 0.0922 | −0.0774 | Low | 1.2150 | 0.6369 | −0.7794 |
| Medium | −0.2892 | 0.0043 | 0.3967 | Medium | −2.2413 | 0.0314 | 2.2629 |
| High | 0.1413 | 0.1251 | 0.1470 | High | 0.9249 | 0.7134 | 1.0140 |
| Size factor - HMLMAV | Size factor - HMLMAV | ||||||
| Low | −0.6549 | −0.9761 | 0.1115 | Low | −8.0179 | −7.3183 | 1.2194 |
| Medium | −0.5058 | −0.5582 | −0.8854 | Medium | −4.2575 | −4.3802 | −5.4846 |
| High | −0.4293 | −0.3179 | −0.5883 | High | −3.0507 | −1.9695 | −4.4056 |
| Liquidity factor - HMLVOL | Liquidity factor - HMLVOL | ||||||
| Low | −0.0950 | −0.0990 | −0.1157 | Low | −1.3535 | −0.8643 | −1.4724 |
| Medium | −0.0284 | 0.1864 | 0.3335 | Medium | −0.2778 | 1.7025 | 2.4050 |
| High | 0.7639 | 0.7928 | 1.1095 | High | 6.3195 | 5.7165 | 9.6712 |
| R-Squared | Low | Medium | High | ||||
| Low | 0.8832 | 0.8110 | 0.8766 | ||||
| Medium | 0.8434 | 0.7996 | 0.8082 | ||||
| High | 0.8068 | 0.7948 | 0.9113 | ||||
| Panel D: Regressions of portfolios formed by Liquidity (VOL) and Value (PBR) | |||||||
|---|---|---|---|---|---|---|---|
| This table presents results from our regressions using the equation 2 as follows: | |||||||
| Ri, t = αi + βi, M[RM, t − rf, t] + ∑ βi, fHMLft + εit | |||||||
| The dependant variables include excess monthly returns on nine portfolios formed by Liquidity (VOL) and Value (PBR). The explanatory variables include four risk factors i.e. RM, HMLPBR, HMLMAV and HMLVOL. We run 9 regressions for the period from Oct 2010 – Apr 2014 with total 43 observations for each regression. On the left of the table, we report the coefficients for all four factors, followed by R-squared. On the right of the table, we report the t-statistics for the correspondent factor coefficients | |||||||
| Coefficients | t – Statistics | ||||||
| VOL\PBR | Low | Medium | High | VOL\PBR | Low | Medium | High |
| Market factor - RM | Market Factor - RM | ||||||
| Low | 1.0442 | 0.8795 | 0.9926 | Low | 8.9930 | 9.2340 | 14.7324 |
| Medium | 1.0189 | 0.9879 | 1.0823 | Medium | 11.4166 | 6.9386 | 7.8407 |
| High | 0.8951 | 1.1279 | 0.9279 | High | 11.0708 | 9.0147 | 8.0909 |
| Value factor - HMLPBR | Value factor - HMLPBR | ||||||
| Low | −0.4308 | −0.1493 | 0.5032 | Low | −3.0408 | −1.2850 | 6.1209 |
| Medium | −0.4150 | −0.3415 | 0.8563 | Medium | −3.8115 | −1.9661 | 5.0845 |
| High | −0.3847 | 0.1748 | 0.6345 | High | −3.9002 | 1.1447 | 4.5342 |
| Size factor - HMLMAV | Size factor - HMLMAV | ||||||
| Low | −0.3972 | −0.6237 | −0.4057 | Low | −3.0443 | −5.8276 | −5.3594 |
| Medium | −0.6875 | −0.4583 | −0.9456 | Medium | −6.8555 | −2.8650 | −6.0966 |
| High | −0.4506 | −0.5445 | −0.4002 | High | −4.9604 | −3.8730 | −3.1060 |
| Liquidity factor - HMLVOL | Liquidity factor - HMLVOL | ||||||
| Low | −0.2119 | −0.2621 | 0.0699 | Low | −1.8906 | −2.8513 | 1.0746 |
| Medium | 0.0596 | 0.0183 | 0.4284 | Medium | 0.6913 | 0.1329 | 3.2153 |
| High | 0.8957 | 0.8054 | 1.0945 | High | 11.4769 | 6.6687 | 9.8870 |
| R-Squared | Low | Medium | High | ||||
| Low | 0.8131 | 0.8280 | 0.8754 | ||||
| Medium | 0.9179 | 0.7612 | 0.7699 | ||||
| High | 0.9527 | 0.8729 | 0.8424 | ||||
More importantly, we find that in most regressions, the value and liquidity factors are positively related to the portfolio returns, whereas the size factor shows mostly negative relationship. In other words, higher returns are associated with portfolios of growth, high liquidity, and small-size stocks. This is consistent with the initial findings from descriptive analysis. The GRS F-test (F-statistic 8.8997, P value 0.0476), however, rejects the hypothesis that the selected factors explain completely portfolio returns. In other words, although the risk factors are statistically and significantly explanatory to the expected returns, they do not completely capture the stock returns and that there are unseen factors.
4.4 Cross-section of stock returns
In Panels A and B of Table 4, we report the results from our second-stage regression. Panel A shows the statistics of the factor risk premiums, which are the means of coefficients (γM and γf) resulted from cross-sectional regressions. The results suggest that the coefficients correspondent to value (HMLPBR), size (HMLMAV), and liquidity (HMLVOL) factors are positive to stock returns, meaning that portfolios of growth (High PBR), large-market capitalization (High MAV), and higher trading volume (high VOL) stocks require higher risk premiums. Comparing with findings from previous section, this indicates that whereas the role of growth and liquidity is again evident, the role of size on stock returns is unclear.
| Panel A: Statistics of market and factor risk premiums | |||||
|---|---|---|---|---|---|
| This table shows the statistics of the coefficients γM and γf which represent the risk premiums of the market and three factors. The coefficients are estimated from 43 cross-sectional regressions of 36 portfolios. For each period t, the following regression is run except that the left hand side now shows the monthly excess portfolio return for period t rather than the average monthly excess return for the whole 43 periods. | |||||
 |
|||||
| γ0 | γM | γPBR | γMAV | γVOL | |
| Mean | −0.01622 | 0.020236 | 0.026643 | 0.009871 | 0.015749 |
| Median | −0.022107 | 0.020255 | 0.0254 | 0.013885 | 0.002282 |
| Maximum | 0.146173 | 0.261238 | 0.12087 | 0.11698 | 0.175061 |
| Minimum | −0.135189 | −0.221875 | −0.084488 | −0.27291 | −0.073443 |
| Std. Dev. | 0.068401 | 0.089141 | 0.055277 | 0.061056 | 0.06338 |
| Observations | 43 | 43 | 43 | 43 | 43 |
| Panel B: Second stage regression – the test of beta coefficients | ||||
|---|---|---|---|---|
| This table presents results of our cross-sectional regression using equation 3 as follows: | ||||
 |
||||
The average monthly excess returns of 36 portfolios formed by firm characteristics are regressed against the estimated market beta (
 ) and the estimated factor coefficients ( ) and the estimated factor coefficients (
 ) for each portfolio. If a coefficient (γ) in this regression is significantly different from zero, the correspondent risk factor is deemed to statistically and significantly explain the portfolio return. ) for each portfolio. If a coefficient (γ) in this regression is significantly different from zero, the correspondent risk factor is deemed to statistically and significantly explain the portfolio return. |
||||
| Correspondent factor | Variable | Coefficient | t-Statistic | Prob. |
| Other | ai | −0.01622 | −1.713464 | 0.0966 |
| Market |
 |
0.020236 | 2.425923 | 0.0213 |
| Value |
 |
0.026643 | 8.515418 | 0.0000 |
| Size |
 |
0.009871 | 2.987496 | 0.0055 |
| Liquidity |
 |
0.015749 | 4.510679 | 0.0001 |
| R-squared | 0.672867 | |||
| Adjusted R-squared | 0.630657 | |||
| F-statistic | 15.94069 | |||
| Prob (F-statistic) | 0.000000 | |||
Our main interest, however, is presented in Panel B, which reports the second-stage regression. With confidence level of 99% (except for RM at 95%), the results suggest that all four factors are statistically significant in explaining average excess stock returns. This confirms our findings in time series regression analysis. It is, however, noted that we cannot reject the hypothesis of zero alpha in Equation 3, indicating that the four factors used in our research might not be sufficient in explaining average excess return, and there could exist additional factors. This is consistent with the conclusion from time series analysis using the GRS F-test.
4.5 Discussions
Using real-time data, our research confirms the role of value, size, and liquidity, in addition to the RM in explaining stock returns in Vietnam. Our findings, however, differ from the popular literature (see, e.g, Fama & French, 2015b) in that we find growth, not value, and high liquidity, rather than low liquidity, stocks do better than others. Our findings, however, are in line with conclusions from Claessens and Dasgupta (1995) for emerging markets. We also note that liquidity in our paper is measured by trading volume. The positive relationship between liquidity and stock returns is also found in Vo and Bui (2016), but our research is likely the first one to report the non-existence of value effect (or the existence of growth effect) in Vietnam. It should be noted that Vo and Bui (2016) use the three-month average trading volume over a period from 2007 to 2012, implying that our conclusion strengthens the view on contradicting liquidity effect for Vietnam, rather than we have similar results because of using the same measure and similar monthly data with their research. We do not find reliable evidence for the outperformance of small-size stocks, which is somewhat similar to Chin and Nguyen (2015).
Our findings offer some implications for investment management in terms of applying investment strategies. For example, one cannot simply adopt popular strategies found by academic research built on developed markets to an emerging market like Vietnam. This is not only because of contextual differences but also because that strategies once become known are not necessarily useful. The type of data available to investors is also an important factor. In developed markets, the gap in timing between real-time and historical data is small, whereas in emerging markets like Vietnam, data could be delayed for one, two, or even three quarters due to poor enforcement of information disclosure requirement. For those who do their investments in Vietnam, winning strategies are a combination of growth and high-liquidity stocks. We find very weak evidence for the outperformance of small stocks. Overall, on the basis of the findings, we think that investors should be aware of the lower degree of integration with the global economy for an emerging market (Jun, Marathe, & Shawky, 2003) like Vietnam.
5 CONCLUSIONS
In this paper, we have analysed the risk factors of stock returns in a developing market, Vietnam. The four risk factors used in our study are computed based on the broad-market index and three firm characteristics commonly used in the literature, namely, value, size, and liquidity, and they are also the popularly used sorting criteria by investors in Vietnam. The stylized portfolios, which mimic investment strategies, are formed using two sets of combination between size (MAV) and value (PER, PBR) and between liquidity (VOL) and value (PER, PBR). The data used in our research are drawn based on an alike experimental study with real-time data collected from October 2010 to April 2014. Real-time data is different from historical data in that it takes into account the best-known information available to investors at the point of making decision. To show that our data are relevant and reliable to draw research findings, we collect also historical data from two other main sources, the StoxPlus and the Datasteam, to compare with our data. This additional analysis suggests that our data are indeed relevant and reliable.
Using an econometric approach suggested by Fama and MacBeth (1973), we run two-stage regression in which the first stage involves time series regressions of portfolio returns, and the second stage involves cross-sectional analysis of average stock returns. In addition, we compute the GRS F-test in the first stage to check the reliability of our pricing model. Our findings suggest that the four risk factors are indeed significantly explanatory to stock returns. The findings also indicate that there would be additional risk factors that have not been identified. We take this message as a suggestion for further research.
Although our findings look similar to those from literature at the first sight, we do find some contradictory results, which could be our contributions to the literature and to the practical investment management. Specifically, although we find the role of value, size, and liquidity factors, but opposite to the literature, we find that stock returns are significantly associated with growth—not value, with high liquidity—rather than low liquidity and weakly with small stocks. In other words, we do not find the existence of value and liquidity effect and weak evidence for the existence of size effect. Our findings support the findings by Claessens and Dasgupta (1995) for emerging markets.
In Vietnam context, our findings are in line with Vo and Bui (2016) for the liquidity effect and Chin and Nguyen (2015) for the size effect but perhaps the first to report the non-existence of value, but growth, effect. Investors and investment managers are, therefore, advised to rely their decision making on empirical research specifically designed for a market, rather than on general literature drawn mostly from developed markets. They obviously can also use findings from this research, including the multifactor pricing model, to value shares and form up investment portfolios for the Vietnam market. In addition, our research draws conclusions based on real-time data, adding a new view to the literature, which normally uses historical data.
ACKNOWLEDGEMENTS
We are grateful to the participants from the 2016 and 2017 Vietnam International Conference in Finance and the anonymous referees for their valuable inspiration and feedback.