Comprehensive characterization of MCL-1 in patients with colorectal cancer: Expression, molecular profiles, and outcomes
Indrakant K. Singh and Heinz-Josef Lenz are co-senior authors.
Part of the manuscript is presented in the poster: https://www.carislifesciences.com/wp-content/uploads/2023/05/ASCO-Caris-2023_Mittal_Characterization-of-MCL-1-in-patients-with-colorectal-cancer-CRC-Expression-molecular-profiles-and-outcomes.pdf.
Abstract
Myeloid cell leukemia 1 (MCL-1) is a member of the B-cell lymphoma 2 protein family and has anti-apoptotic functions. Deregulation of MCL-1 has been reported in several cancers, including lung and breast cancer. In the present study, the association of MCL-1 expression with molecular features in colorectal cancer (CRC) has been highlighted. CRC samples from Caris Life Sciences (Phoenix, AZ) were analyzed using NextGen DNA sequencing, whole transcriptome sequencing, whole exome sequencing, and immunohistochemistry (IHC); and stratified based on MCL-1 expression as top quartile MCL-1high (Q4) and bottom quartile MCL-1low (Q1). Immune cell infiltration (CI) in the tumor microenvironment (TME) was measured using RNA deconvolution analysis (QuanTIseq). MCL-1high tumors were associated with an increased rate of programmed death ligand 1 IHC, higher T cell-inflamed signature, interferon score, microsatellite instability-high and tumor mutational burden-high status. MCL-1high was associated with higher mutation rates of BCOR, TP53, KMT2D, ASXL1, KDM6A, ATM, MSH6, SPEN, KRAS, STK11, GNAS, RNF43, and lower mutation rates of CDKN1B, NRAS, and APC, and copy number amplifications in several genes. MCL-1high TME had higher CI of M1 and M2 macrophages, B cells, natural killer cells, neutrophils, and T-regulatory cells infiltration, and lower CI of myeloid dendritic cells. Higher MCL-1 expression is significantly associated with favorable clinical outcomes in CRC cohorts. Our data showed a strong correlation between MCL-1 and distinct immune biomarkers and TME CI in CRC. Our findings suggest MCL-1 is a potential modulator of antitumor immunity, TME, and biomarker in CRC.
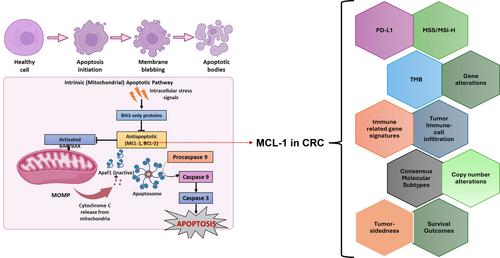
Graphical Abstract
What's new?
MCL-1, an anti-apoptotic protein required for intestinal homeostasis, has been associated with chemoresistance in colorectal cancer. This study provides novel insights into the molecular profile and tumor microenvironment of colorectal cancer according to MCL-1 mRNA expression. High MCL-1 expression in colorectal cancer samples was associated with the upregulation of PD-L1, several immune-related genes, B cells, natural killer cells, T-reg cells, and M1 and M2 macrophages. High MCL-1 expression was linked to improved patient survival. The findings reveal a correlation between distinct immune biomarkers, tumor microenvironment cell infiltration, and MCL-1 in colorectal cancer and highlight MCL-1 as a potential biomarker.
1 INTRODUCTION
Colorectal cancer (CRC) is one of the most diagnosed malignancies, ranks among the three major causes of cancer-related incidence and death worldwide, and is primarily focused on developed countries.1 CRC is a prevalent and frequently lethal cancer worldwide.2 In 2023, there were an estimated 153,020 new cases and 52,550 deaths related to CRC in the United States. CRC, along with prostate and lung cancers, accounts for approximately 48% of all cancers in men, and CRC, along with breast and lung cancers, accounts for approximately 52% of all new cancer diagnoses in women.3 Despite the rapid advancements in screening methods and treatment strategies that have caused a considerable decline in death rates due to CRC, downward trends seem to be limited in developed countries. The 5-year survival rates of overall CRC and metastatic CRC are approximately 64% and 12%, respectively. Therefore, more effective treatment approaches and medical interventions are needed.2
In multicellular organisms, the physiological process of apoptosis (a mode of programmed cell death) eliminates damaged or infected cells, thereby regulating cellular fate and homeostasis. Apoptosis is an important process that maintains the turnover of cells that comprise the inner lining of the colon, from which adenocarcinomas arise. It is mediated by two pathways, extrinsic (initiated by surface cell death receptors) and intrinsic (triggered by cellular stress). Deregulation of apoptosis has been reported in several cancers, including CRC, where it can lead to tumor initiation, progression, and treatment resistance.4, 5 The intrinsic or mitochondrial pathway is regulated by B-cell lymphoma 2 (BCL-2) proteins.
Myeloid cell leukemia 1 (MCL-1) is a member of the BCL-2 protein family that exerts an anti-apoptotic (pro-survival) function.4 MCL-1 is required for intestinal homeostasis and the prevention of intestinal carcinogenesis in mouse models.6 MCL-1 binds to the BH3 domains of pro-apoptotic BCL-2 family proteins, such as BAX, and inhibits apoptosis, thereby conferring resistance to multiple anticancer therapies. MCL-1 has been associated with chemoresistance in CRC.7 The highly potent and specific MCL-1 inhibitor S63845 overcame regorafenib resistance in multiple regorafenib-resistant CRC models by restoring apoptosis. Upon treatment with regorafenib, FBXW7 (F-box and tryptophan-aspartic acid (W-D) dipeptide (WD) repeat domain-containing 7) binds to phosphorylated MCL-1, leading to ubiquitination of MCL-1 followed by its degradation.8 FBXW7 thus acts as a tumor suppressor; however, mutations in FBXW7 are associated with acquired resistance to regorafenib in CRC due to the blockage of MCL-1 degradation. MCL-1 inhibition re-sensitizes intrinsic and acquired regorafenib-resistant CRC tumors, including those with FBXW7 mutations, both in vitro and in vivo.9 Another highly potent BCL-2/BCL-xL dual inhibitor, APG-1252-M1, was found to decrease survival and induce apoptosis in CRC cell lines expressing relatively low levels of MCL-1. Similarly, high levels of MCL-1 significantly decreased the sensitivity to APG-1252-M1; which was restored by using APG-1252-M1 in combination with an MCL-1 inhibitor, which in turn synergistically decreased the survival and induced apoptosis in CRC cell lines.10 A recent study highlighted the potential role of the nuclear translocation of MCL-1 from mitochondria in chemoresistance in CRC.7 These findings suggest the potential and need for additional studies to assess the targeting of MCL-1 nuclear translocation to treat CRC.
Despite extensive research on the inhibition of MCL-1 in various cancers, no comprehensive analysis of MCL-1 expression and its association with molecular pathways in CRC has been reported. In this study, we aimed to further characterize the molecular features of human CRCs in association with MCL-1 expression (MCL-1high vs. MCL-1low) to provide insight into the role of MCL-1 in CRC and explore potential co-druggable targets and pathways for the treatment of CRC patients with MCL-1high.
2 MATERIALS AND METHODS
2.1 Patient population
CRC samples were collected and analyzed using next-generation sequencing (NGS), whole exome sequencing (WES), whole transcriptome sequencing (WTS), and immunohistochemistry (IHC) at Caris Life Sciences, Phoenix, AZ. Tumor enrichment was achieved using manual microdissection techniques prior to DNA and RNA extraction. Tumor samples in the top quartile (transcripts per million [TPM]) for MCL-1 expression (Q4, MCL-1high: n = 6646) and bottom quartile (Q1, MCL-1low: n = 6645) were compared in this study.
2.2 Next-generation sequencing/whole exome sequencing
NGS was performed on genomic DNA isolated from formalin-fixed paraffin-embedded (FFPE) tumor samples using the NextSeq or NovaSeq 6000 platforms (Illumina, Inc., San Diego, CA, USA). For NextSeq-sequenced tumors, a custom-designed SureSelect XT assay was used to enrich 592 whole-gene targets (Agilent Technologies, Santa Clara, CA, USA). For NovaSeq-sequenced tumors, a hybrid pull-down panel of baits designed to enrich for more than 700 clinically relevant genes at high coverage and high read-depth was used, along with another panel designed to enrich for an additional >20,000 genes at lower depth. Total number of sequencing reads per sample: average was 17 million reads per sample. Total number of unique reads: Polymerase chain reaction (PCR) de-duplication was properly and adequately done, and uniquely mapped read and unique reads take up more than 85% of total reads. Total number of covered targeted bases: WTS covers all 23 k genes, which approximate 50 million base pairs. Median coverage (and range) per targeted base: depth of coverage for DNA is >1000. Percentage of targeted bases with coverage >200. All variants were detected with >99% confidence based on allele frequency and amplicon coverage, with an average sequencing depth of coverage of >500 and an analytic sensitivity of 5%. Identified genetic variants were analyzed by board-certified molecular geneticists and categorized as follows according to the American College of Medical Genetics and Genomics standards: “pathogenic,” “presumed pathogenic,” “variant of unknown significance,” “presumed benign,” or “benign.” When assessing mutation frequencies of individual genes, “pathogenic” and “presumed pathogenic” were counted as mutations, whereas “variant of unknown significance,” “presumed benign,” and “benign” were excluded.
2.3 mRNA expression (WTS)
Expression data were evaluated for mRNA isolated from formalin-fixed paraffin-embedded tumor sample using the Illumina NovaSeq platform (Illumina, Inc., San Diego, CA, USA) and Agilent SureSelect Human All Exon V7 bait panel (Agilent Technologies, Santa Clara, CA, USA); TPM were reported. The immune cell fraction was calculated by QuanTIseq (Identifier: https://scicrunch.org/resolver/SCR_022993) using the transcriptomic data. QuanTIseq has been designed as a method to quantify the fractions of 10 different immune cell types in cancer/tumor samples from bulk RNA sequencing data.11 Additionally, mRNA expression data were used to analyze differential gene expression, interferon-gamma (IFN-α), and T cell-inflamed score.12
2.4 Tumor mutational burden
Tumor mutational burden (TMB) was measured by counting all non-synonymous missense, nonsense, in-frame insertion/deletion, and frameshift mutations found per tumor that had not been previously described as germline alterations in dbSNP151, the Genome Aggregation Database (gnomAD) databases, or benign variants identified by Caris's geneticists. A cut-off point of ≥10 mutations per MB was used based on the KEYNOTE-158 trial. Caris Life Sciences is a participant in the Friends of Cancer Research TMB Harmonization Project.
2.5 Programmed death ligand 1 expression by IHC
Programmed death ligand 1 (PD-L1) expression was tested by IHC using an SP142 antibody (Spring Biosciences). Staining intensity on the tumor cell membrane was assessed on a semiquantitative scale as follows: 0, no staining; 1+, weak staining; 2+, moderate staining; and 3+, strong staining. Tumors with staining scores of 2+ or 3+ in >5% of the tumor cells were regarded as PD-L1 positive.
2.6 Microsatellite instability status determination
A combination of multiple test platforms was used to determine the microsatellite instability (MSI), or mismatch repair (MMR) status of the tumors profiled, including fragment analysis (FA, Promega, Madison, WI), IHC (MLH1, M1 antibody; MSH2, G2191129 antibody; MSH6, 44 antibody; and PMS2, EPR3947 antibody [Ventana Medical Systems, Inc., Tucson, AZ, USA]) and NGS (for tumors tested on the NextSeq platform, 7000 target microsatellite loci were examined and compared to the reference genome hg19 from the University of California). The three platforms generated highly concordant results, as previously reported13 and in rare cases of discordant results, the MSI or MMR status of the tumor was determined in the order of FA, IHC, and NGS.
2.7 Real-world overall survival
Real-world overall survival (rwOS) obtained from insurance claims data was calculated from either tissue collection to the last contact or time on treatment (TOT). Kaplan–Meier estimates were calculated for molecularly defined patient cohorts. Significance was defined as a p value <.05.
2.8 Statistical analysis
Comparative analyses of molecular alterations in the cohorts were performed using Chi-square or Fisher exact tests. Tumor microenvironment (TME) cell fractions were analyzed using the non-parametric Kruskal–Wallis test. Statistical significance was set at p < .05 was considered a trending difference; p values were further corrected for multiple comparisons using the Benjamini-Hochberg method to avoid type I error, and an adjusted p value (i.e., q value) of <.05 was considered a significant difference.
3 RESULTS
3.1 Clinicopathological parameters associated with MCL-1 expression
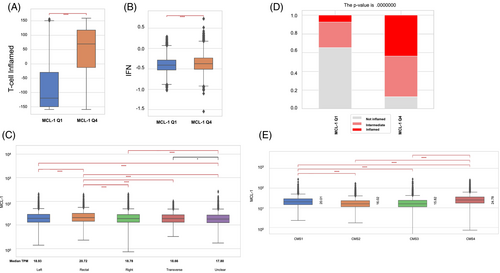
Among CRC samples from Caris Life Sciences, 6646 were identified as low expression quartile MCL-1low (MCL-1 Q1) and 6645 as high quartile MCL-1high (MCL-1 Q4) (Table 1). The median age of the patients was 63 and 61 years in the low and high quartile ranges, respectively (p = 1.04e−16). No statistically significant differences were observed based on patients' sex in correlation with MCL-1 expression (p = .36). Based on tumor sidedness, MCL-1 relative expression was the highest in rectal tumors (Figure 2C).
| MCL-1low (Q1) | MCL-1high (Q4) | ||
|---|---|---|---|
| Count (N) | 6646 | 6645 | |
| Median Age [range] | 63 [19 to >89] | 61 [14 to >89] | |
| Sex | Male | 3597 (54.1%) | 3649 (54.9%) |
| Female | 3049 (45.9%) | 2996 (45.1%) | |
| Tumor location | Primary/local | 3141 (47.3%) | 3940 (59.3%) |
| Metastatic | 3255 (48.9%) | 1986 (29.9%) | |
| Unknown | 250 (4%) | 519 (8%) | |
| Primary tumor site (sidedness) | Right | 1604 (24.1%) | 1344 (20.2%) |
| Transverse | 307 (4.6%) | 246 (3.7%) | |
| Left | 1985 (29.9%) | 1749 (26.3%) | |
| Rectal | 1288 (19.4%) | 1738 (26.1%) | |
| Other | 1462 (21.9%) | 1568 (23.6%) | |
3.2 PD-L1 and TMB
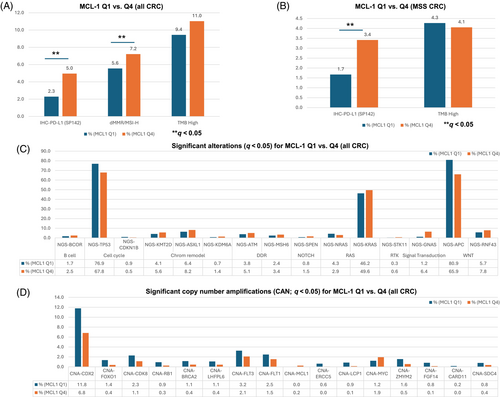
MCL-1high expression was as strongly associated with PD-L1 positivity (5.0% vs. 2.3%, p < .00001) in the entire CRC cohort. The rate of PD-L1 expression was significantly higher in MCL-1high compared to MCL-1low CRCs in the MMR proficient/microsatellite stable (pMMR/MSS) subgroup (3.4% vs. 1.7%, p < .00001). MCL-1high expression was significantly associated with a higher frequency of MMR deficient/MSI-high (dMMR/MSI-H) status (7.2% vs. 5.6%, p < .0001) and TMB-high status in all CRC (11% vs. 9.4%, p < .005), while TMB-high showed an opposite trend in the pMMR/MSS subgroup (4.1% vs. 4.3%, p = .55) (Figure 1A,B).
3.3 Co-alterations and co-amplifications with MCL-1 expression
To elucidate the genomic features associated with MCL-1 expression in CRC, we compared MCL-1high and MCL-1low tumors. We observed several genes with significantly different mutation rates between the MCL-1high (Q4) and MCL-1low (Q1) CRC cohorts. Genes with significantly higher mutation rates in MCL-1high (Q4) CRC were BCOR (2.5% vs. 1.7%; p = .001), KMT2D (5.6% vs. 4.1%; p = 5.66e−05), ASXL1 (8.2% vs. 6.4%; p = .00052), KDM6A (1.4% vs. 0.7%; p = .0007), ATM (5.1% vs. 3.8%; p = .00061), MSH6 (3.4% vs. 2.4%; p = .00093), SPEN (1.5% vs. 0.8%; p = 3.6e−05), KRAS (49.6% vs. 46.2%; p = .00018), STK11 (0.6% vs. 0.3%; p = .0024), GNAS (6.4% vs. 1.2%; p = 4.32e−54), and RNF43 (7.8% vs. 5.7%; p = 2.8e−06). Conversely, genes with significantly lower mutation rates in MCL-1high (Q4) CRC were CDKN1B (0.5% vs. 0.9%; p = .0016), NRAS (72.3% vs. 79.1%; p = 2.86e−19) and APC (65.9% vs. 80.9%; p = 6.87e−82). We further analyzed differences in copy number amplification (CNA) between MCL-1 expression quartiles. Amplification of several genes, including CDX2, FOXO1, CDK8, RB1, BRCA2, LHFPL6, FLT3, FLT1, ERCC5, LCP1, ZMYM2, FGF14, CARD11, and SDC4 was found to be negatively associated, while MCL-1 and MYC positively associated with MCL-1 expression (q < 0.05) (Figure 1C,D).
3.4 Interferon-gamma and T-cell inflamed scores
To elucidate the association with immune response and inflammation, the IFN-α/γ and T cell-inflamed signatures were compared in the MCL-1high and MCL-1low CRC cohorts. We observed that both the IFN-γ and T cell-inflamed scores were significantly increased (p < .000001) in the MCL-1high compared to MCL-1low CRC cohort in the pMMR/MSS subgroup (Figure 2A,B). Further analysis showed significantly more inflamed tumors in the MCL-1high CRC cohort than in the MCL-1low CRC cohort in the pMMR/MSS subgroup (Figure 2D).
3.5 Consensus molecular subtypes
CRC can be classified into four consensus molecular subtypes (CMS), based on their molecular and genetic profiles. We observed that MCL-1 median expression was the highest in the CMS4 (mesenchymal) subgroup, followed by CMS1 (immune), and lowest in CMS2 (canonical) and CMS3 (metabolic)14 (Figure 2E).
3.6 Immune infiltration signature
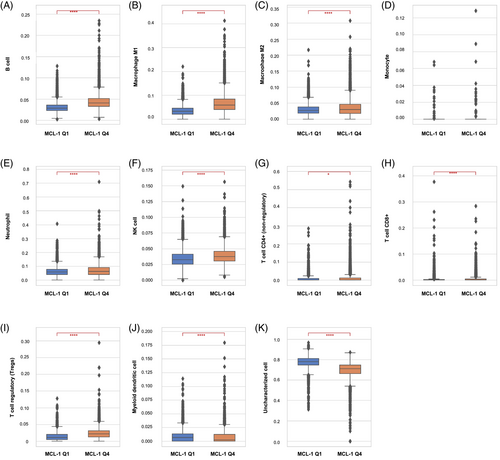
The TME QuanTIseq analysis for the pMMR/MSS tumors showed that the MCL-1high CRC cohort had significantly higher infiltration of M1 and M2 macrophages, B cells, natural killer (NK) cells, neutrophils, and T-regulatory (T-reg) than the MCL-1low CRC cohort (p < .0001). In contrast, lower infiltration of myeloid dendritic cells (DC) was observed in MCL-1high (Q4) than in MCL-1low (Q1). These trends were consistent across all the CRC cohorts (Figure 3).
3.7 Immune checkpoint-related marker expression
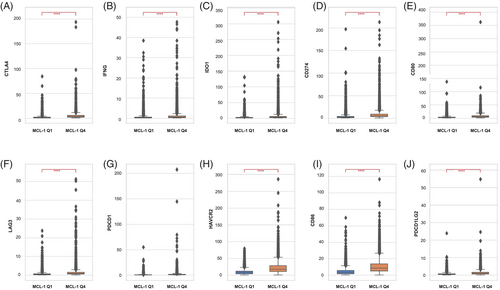
Ten immune checkpoint-related markers (CD80, PDCD1, IFNG, LAG3, CD274, HAVCR2, CD86, CTLA4, IDO1, and PDCD1LG2) were analyzed for their association with MCL-1 expression in the pMMR/MSS subgroup. All 10 markers were positively associated with MCL-1high CRC compared to MCL-1low CRC (p < .000001) (Figure 4). Furthermore, we analyzed the correlation between the 10 immune marker genes and MCL-1 expression in the The Cancer Genome Atlas (TCGA) cohort, and all were significantly correlated with MCL-1 (Figure S1).
3.8 Association between MCL-1 expression and clinical outcomes in CRC
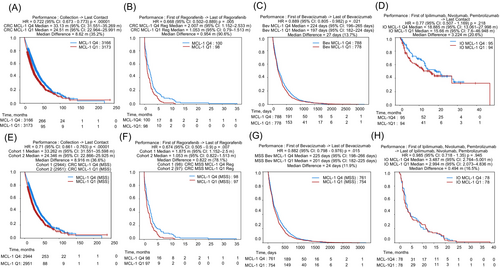
We investigated the relationship between MCL-1 expression and survival outcomes in real-world patients with CRC based on the different treatments that the patients received (Figure 5). The association between MCL-1 expression and survival was evaluated in the entire CRC cohort and in the subgroup of pMMR/MSS tumors. The patients with MCL-1high CRC had longer survival in both the overall CRC cohort (Q4 vs. Q1: median difference = 8.62 months, Hazard ratio (HR) = 0.72, 95% Confidence Interval (CI): 0.673–0.773, p < .00001) and the pMMR/MSS cohort (Q4 vs. Q1: median difference = 8.916 months, HR = 0.71, 95% CI: 0.661–0.763, p < .00001) (Figure 5A,E). Next, we evaluated the association of MCL-1 expression and survival in CRC patients treated with immune checkpoint inhibitors (ICIs) (ipilimumab, nivolumab, and pembrolizumab). The patients with MCL-1high CRC had numerically longer overall survival (Q4 vs. Q1: median difference = 3.224 months, HR = 0.77, 95% CI: 0.507–1.169, p = .218) and TOT (Q4 vs. Q1: median difference = 0.494 months, HR = 0.985, 95% CI: 0.718–1.35, p = .945), but neither reached statistical significance (Figure 5D,H). Thirdly, we analyzed the association of MCL-1 expression and survival in CRC patients treated with regorafenib. The patients with MCL-1high CRC had longer TOT with regorafenib in both the overall CRC (Q4 vs. Q1: median difference = 0.954 months, HR = 0.668, 95% CI: 0.502–0.889, p = .005) and pMMR/MSS (Q4 vs. Q1: median difference = 0.822 months, HR = 0.674, 95% CI: 0.505–0.9, p = .007) cohorts (Figure 5B,F). Lastly, we analyzed the association between MCL-1 expression and survival in patients with CRC treated with bevacizumab. The patients with MCL-1high CRC had longer TOT with bevacizumab in both the overall CRC (Q4 vs. Q1: median difference = 27 days, HR = 0.889, 95% CI: 0.805–0.982, p = .021) and the pMMR/MSS (Q4 vs. Q1: median difference = 24 days, HR = 0.882, 95% CI: 0.798–0.976, p = .015) cohorts (Figure 5C,G).
4 DISCUSSION
Apoptosis plays a key role in tissue homeostasis by maintaining the balance between cell proliferation and cell death. Deregulation of this intricate balance may result in tumor initiation. The process of apoptosis is crucial for intestinal mucosal cell turnover, and apoptotic inhibition facilitates tumor initiation and progression in the colon. The BCL-2 proteins are important regulators of the intrinsic apoptotic pathway and have been associated with CRC initiation, progression, and resistance to therapy.5 The anti-apoptotic BCL-2 family member MCL-1 is one of the most extensively studied proteins in several human cancers; however, the molecular features of MCL-1high tumors and associated outcomes in CRC remain elusive to date. In our study, we report, for the first time, the distinct molecular features of MCL-1high CRCs compared with MCL-1low CRCs.
We assessed the association of MCL-1 expression with immuno-oncology markers such as IFN-γ, T cell-inflamed cells, PD-L1 expression, TMB, and MSI-high status in CRC. Immune checkpoint proteins, such as programmed cell death receptor 1 (PD-1, also known as PDCD1) and its ligand PD-L1, are attractive targets for enhancing the immune response to tumors.15 In our analysis, MCL-1high CRC was positively correlated with IFN-γ, PD-L1, and PD-1 expression, indicating that the combination of anti-PD-1 or anti-PD-L1 therapy and MCL-1 inhibitors may have therapeutic potential in CRC. In EGFR-mutant lung cancer, IFN-γ increases the phosphorylation of STAT1 and STAT3. This IFN-γ/STAT3 axis leads to an increase in both PD-L1 and MCL-1 expression.16 STAT3, a transcription factor, has been associated with suppression of the immune response and increased tumor cell proliferation in colon cancer.17 Another important parameter is TMB, defined as the number of non-synonymous somatic mutations per megabase in tumor cells.18 BCL-2, an anti-apoptotic protein, has been shown to be negatively correlated with TMB.19 In our study, MCL-1 expression showed a positive correlation with TMB in the overall CRC cohort but a negative, though not significant, trend in the pMMR/MSS cohort.
The tumor immune microenvironment can be either tumor-inhibiting or tumor-promoting, depending on the phenotype and function of the immune cells present. Profiling the tumor microenvironment by primarily focusing on immune cell populations has been an attractive field of research in recent years.20 Owing to the importance of the immune contexture in predicting the prognosis and response to therapy in cancer, we assessed the alterations in the immune cell infiltration (CI) patterns associated with MCL-1 expression in CRC. Since “hot” tumors are characterized as including TME rich in tumor-infiltrating lymphocytes (TILs), high PD-L1 expression, and genomic instability,21 our study highlights a correlation between MCL-1 expression and hot tumors. MCL-1 expression was lower in acute lung injury (ALI) samples than in healthy controls, and MCL-1 expression negatively correlated with the infiltration of B- and T-cells, indicating little relevance to the inflammatory response in ALI.22 T-reg cells have been proposed to be immunosuppressive and disrupt the effective host immune response against cancer cells.23 T-reg cells not only suppress native anticancer immunity but also decrease the efficacy of ICIs.24 MCL-1 was found to be a critical component for the survival of T-reg cells and to control T-reg cell homeostasis.23 MCL-1 expression is negatively correlated with the infiltration of NK cells in the bone marrow of patients with acute myeloid leukemia (AML). The same study proposed a synergistic potential for MCL-1 inhibitor and NK cell-based immunotherapy for the treatment of AML.25 Tumor-associated macrophages (TAMs) are the most abundant type of immune cells in the TME. Upon recruitment, TAMs develop one of two polarization phenotypes: M1 (tumor-preventing) or M2 (tumor-promoting).26, 27 Several studies have shown that TAM infiltration correlates with a better prognosis and a lower likelihood of developing liver metastasis in CRC. It was found that increased infiltration of M1 macrophages correlated with better prognosis and was positively correlated with a concomitant increase in M2 macrophages.26, 27 In terms of tumor progression, however, M1 and M2 macrophages have been shown to mediate opposite effects on colon cancer progression by regulating FBXW7-mediated MCL-1 protein degradation, and in turn, cancer cell proliferation.26 For DC, MCL-1 is important for survival and differentiation.28
In our study, we found a correlation between MCL-1 expression in the tumor and immune CI in the TME. Therefore, it will be of interest to study the effect of MCL-1 expression on immune cells. MCL-1 was shown to be highly expressed and required for the sustained survival of NK cells. Interleukin-15 (IL-15), which maintains NK cell homeostasis, regulates MCL-1 expression via the binding of STAT5 to MCL-1's 3′ untranslated region (UTR).29 In neutrophils, MCL-1 exerts a survival signal by inhibiting the oligomerization of pro-apoptotic effector proteins (BAK and BAX) at the outer mitochondrial membrane. This suggests that inhibition or modulation of MCL-1 to induce neutrophil apoptosis is a potential strategy to terminate inflammatory responses.30
In a study by Zhang et al.,31 a panel of CRC cell lines was screened for their response to BH3-mimetics targeting distinct BCL-2 anti-apoptotic proteins, including MCL-1, alone and in combination. A CMS-specific response was observed, with CMS2 cell lines showing relatively higher resistance to single or combined inhibition of MCL-1 and BCL-2, whereas CMS3 and CMS4 were more sensitive to MCL-1 inhibition. The strategy to inhibit both MCL-1 and BCL-xL simultaneously showed a synergistic effect in CRC cell lines, irrespective of CMS status.31 In our study, the median MCL-1 expression was highest in CMS4, followed by CMS1, and lowest in CMS2 and CMS3. This suggests that MCL-1 inhibition might show the best results in the CMS4 subtype of CRC owing to the relatively higher MCL-1 expression.
In addition to the canonical function of MCL-1 as a pro-survival protein, its non-apoptotic or non-canonical functions, such as cell cycle, cell proliferation, autophagy, and DNA damage response, are being appreciated, and recent research has focused on this direction.32 Our results are consistent with and highlight the gene mutations co-occurring with MCL-1high expression, and significant gene alterations. Strikingly, in the Rat sarcoma (RAS) pathway, MCL-1high correlates with increased frequency of KRAS mutations but a lower frequency of NRAS mutations.
Epigenetics modulators are emerging targets for anticancer therapy, including histone methyltransferases inhibitors. Our results showed positive correlation between MCL-1 expression, and H3K27 histone demethylase (KDM6A) and H3K4 mono- and di-methyltransferase (KMT2D). This suggests the potential for further studies analyzing the combination effect of epigenetic modulators and MCL-1 inhibitors in CRC.
In our study, increased tumor MCL-1 expression was associated with CRC patient prognosis and treatment outcome. Despite its anti-apoptotic function, our findings suggest an important clinical role for MCL-1 in antitumor immunity, TME, and as a potential biomarker in CRC. Regorafenib induces apoptosis and MCL-1 proteasomal degradation.9 We found MCL-1high was associated with higher efficacy and better OS in patients with CRC treated with regorafenib. A plausible reason for this contradictory result could be the dependency of regorafenib efficacy on BCL-xL/MCL-1 ratio. In hepatocellular carcinoma (HCC), an elevated BCL-xL/MCL-1 ratio leads to decreased regorafenib efficacy.33 MCL-1-selective BH3-mimetics may improve regorafenib response in patients with CRC.
To the best of our knowledge, this is the first and most comprehensive study to demonstrate the association of MCL-1 expression with clinical and molecular characteristics, immune CI, and different treatments in patients with CRC. Potential limitations of this study were the retrospective nature of the analysis, the heterogeneity of the Caris study population, and for clinical outcome analysis for targeted agents, the data includes combination with any form of chemo backbone (e.g., single agent 5FU or equivalent; FOLFOXIRI; FOLFOX; and FOLFIRI) but lacks information on treatment sequences. Additionally, our study lacks data on functional tests for MCL-1 to correlate with the gene expression. The major goal of our current study was analysis of MCL-1 as a biomarker in CRC; therefore, further clinical trials to test the efficacy of targeted agents in combination with MCL-1 overexpression or inhibition and treatment-related decision-making in CRC are warranted.
AUTHOR CONTRIBUTIONS
Pooja Mittal: Conceptualization; formal analysis; investigation; visualization; writing – original draft. Francesca Battaglin: Formal analysis; investigation; writing – review and editing. Yasmine Baca: Methodology; project administration; writing – review and editing. Joanne Xiu: Project administration; resources. Alex Farrell: Resources. Shivani Soni: Investigation. Jae Ho Lo: Investigation; writing – review and editing. Lesly Torres-Gonzalez: Writing – review and editing; investigation. Sandra Algaze: Writing – review and editing; investigation. Priya Jayachandran: Investigation; writing – review and editing. Karam Ashouri: Writing – review and editing; investigation. Alexandra Wong: Investigation; writing – review and editing. Wu Zhang: Investigation; writing – review and editing. Jian Yu: Investigation; writing – review and editing. Lin Zhang: Investigation; writing – review and editing. Benjamin A. Weinberg: Conceptualization. Emil Lou: Writing – review and editing; project administration. Anthony F. Shields: Writing – review and editing; project administration. Richard M. Goldberg: Writing – review and editing; project administration. John L. Marshall: Project administration; writing – review and editing. Sanjay Goel: Writing – review and editing; project administration. Indrakant K. Singh: Conceptualization; supervision; investigation; writing – review and editing. Heinz-Josef Lenz: Conceptualization; funding acquisition; supervision; project administration; writing – review and editing.
ACKNOWLEDGMENTS
Research reported in this study was funded by the National Cancer Institute of the National Institutes of Health under Award P30CA 014089 [to Heinz-Josef Lenz], Gloria Borges WunderGlo Foundation, Ming Hsieh Research Grant, Dhont Family Foundation, Victoria and Philip Wilson Research Fund, San Pedro Peninsula Cancer Guild, and Daniel Butler Research Fund.
CONFLICT OF INTEREST STATEMENT
Yasmine Baca, Joanne Xiu, and Alex Farrell are employees of Caris Life Sciences, Phoenix, AZ, USA. Benjamin A. Weinberg is a consultant for Caris Life Sciences; no other relevant disclosures. Emil Lou reports support from the University of Minnesota Clinical Center for the Study of Pancreatic Disease, part of The Chronic Pancreatitis Diabetes Pancreatic Cancer research (CPDPC) consortium funded by the NIDDK (5U01DK126300-03), and research grants from the American Cancer Society (RSG-22-022-01-CDP) 2022–2026, and the Minnesota Ovarian Cancer Alliance in 2019, 2021, and 2022; American Association for Cancer Research (2019 AACR-Novocure Tumor-Treating Fields Research Grant, grant number 1-60-62-LOU); The Randy Shaver Cancer Research and Community Fund; honorarium and travel expenses for a research talk at GlaxoSmithKline in 2016; honoraria and travel expenses for lab-based research talks 2018-21, and equipment for laboratory-based research 2018-present, Novocure, Ltd.; honorarium for panel discussion organized by Antidote Education for a Continuing Medical Education (CME) module on diagnostics and treatment of HER2+ gastric and CRCs, funded by Daiichi-Sankyo, 2021 (honorarium donated to lab); compensation for scientific review of proposed printed content, Elsevier Publishing and Johns Hopkins Press; consultant, Nomocan Pharmaceuticals (no financial compensation); Scientific Advisory Board Member, Minnetronix, LLC, 2018–2019 (no financial compensation); consultant and speaker honorarium, Boston Scientific US, 2019. Institutional Principal Investigator for clinical trials sponsored by Celgene, Novocure, Ltd., Intima Bioscience, Inc., the National Cancer Institute, and University of Minnesota membership in the Caris Life Sciences Precision Oncology Alliance (no financial compensation), and thanks the following groups for donations in support of cancer research: The Mu Sigma Chapter of the Phi Gamma Delta Fraternity, University of Minnesota (FIJI); the Litman Family Fund for Cancer Research; Dick and Lynnae Koats; Ms. Patricia Johnson. Anthony F. Shields reports receiving research support and being on the speaker's bureau from Caris Life Sciences, Phoenix, AZ, USA. Richard M. Goldberg reports receiving honoraria from consultant/advisory board membership from AbbVie, Artemida, Bayer, Eisai, G1 Therapeutics, GeneCentric, GSK, Haystack Oncology, Focal Medical Inc., Merck, Modulation Therapeutics, Sorrento, Taiho, Takeda, UpToDate, and Valar Labs. John L. Marshall reports being an advisor/consultant for AZ, Merck, Bayer, Taiho, Pfizer, Takeda, Astellas. Heinz-Josef Lenz reports receiving honoraria from consultant/advisory board membership from Bayer, Genentech, Roche, Merck, Merck KG, Oncocyte, Fulgent, G1 Therapeutics, 3T Biosciences, Jazz Therapeutics, Protagonist. All authors' disclosures have been mentioned above. The other authors declare no potential conflicts of interest.
ETHICS STATEMENT
This study was conducted in accordance with the guidelines of the Declaration of Helsinki, Belmont Report, and U.S. Common rule. In keeping with 45 CFR 46.101(b) (4), this study utilized retrospective, de-identified clinical data. Therefore, this study was considered IRB exempt, and no patient consent was deemed necessary.
Open Research
DATA AVAILABILITY STATEMENT
The datasets analyzed and generated in the present study are available from the authors upon reasonable request, followed by permission from Caris Life Sciences. Qualified researchers may contact the corresponding author upon request.


