Sunitinib activates Axl signaling in renal cell cancer
The authors declare no potential conflict of interest.
Author contributions: Proteomics experiments were done by J.v.d.M., R.H., J.K. and S.P. J.v.d.M., S.P., J.K., C.J. and T.P. analyzed proteomics results. J.v.d.M., R.H. performed MTT-assays and WB experiments. H.J.B., V.B., B.H., J.W.M., C.J. and H.V. conceived the study and participated in data analysis and interpretation. J.v.d.M., H.J.B., C.J. and H.V. drafted the manuscript. All authors read and approved the manuscript before submission.
Abstract
Mass spectrometry-based phosphoproteomics provides a unique unbiased approach to evaluate signaling network in cancer cells. The tyrosine kinase inhibitor sunitinib is registered as treatment for patients with renal cell cancer (RCC). We investigated the effect of sunitinib on tyrosine phosphorylation in RCC tumor cells to get more insight in its mechanism of action and thereby to find potential leads for combination treatment strategies. Sunitinib inhibitory concentrations of proliferation (IC50) of 786-O, 769-p and A498 RCC cells were determined by MTT-assays. Global tyrosine phosphorylation was measured by LC-MS/MS after immunoprecipitation with the antiphosphotyrosine antibody p-TYR-100. Phosphoproteomic profiling of 786-O cells yielded 1519 phosphopeptides, corresponding to 675 unique proteins including 57 different phosphorylated protein kinases. Compared to control, incubation with sunitinib at its IC50 of 2 µM resulted in downregulation of 86 phosphopeptides including CDK5, DYRK3, DYRK4, G6PD, PKM and LDH-A, while 94 phosphopeptides including Axl, FAK, EPHA2 and p38α were upregulated. Axl- (y702), FAK- (y576) and p38α (y182) upregulation was confirmed by Western Blot in 786-O and A498 cells. Subsequent proliferation assays revealed that inhibition of Axl with a small molecule inhibitor (R428) sensitized 786-O RCC cells and immortalized endothelial cells to sunitinib up to 3 fold. In conclusion, incubation with sunitinib of RCC cells causes significant upregulation of multiple phosphopeptides including Axl. Simultaneous inhibition of Axl improves the antitumor activity of sunitinib. We envision that evaluation of phosphoproteomic changes by TKI treatment enables identification of new targets for combination treatment strategies.
Abstract
What's new?
Sunitinib, a first-line therapy for advanced renal cell carcinoma, produces durable responses in patients. Nonetheless, as with other receptor tyrosine kinase inhibitors (TKIs), tumors inevitably become resistant to the drug. Here, phosphoproteomic profiling reveals that sunitinib not only reduces the phosphorylation of numerous proteins, consistent with TKI activity, but also enhances the phosphorylation of other proteins, including the pro-survival players FAK and Axl. Combination treatment with an Axl inhibitor potentiated the antitumor activity of sunitinib. The findings shed light on the pharmacodynamic effects of sunitinib and provide insight into leads for overcoming resistance.
Great strides have been made in the past decade in our understanding of renal cell carcinoma (RCC). In the majority of patients with RCC the von Hippel Lindau (VHL) gene is mutated. Loss of VHL activates hypoxia inducible factor (HIF) signaling, inducing expression of VEGF, highly vascularized tumors and metastatic disease.1 In recent years the importance of several other oncogenes and signaling pathways has been recognized in RCC, including the role of the Axl receptor tyrosine kinase and the focal adhesion kinase (FAK).2-4 Meanwhile, tyrosine kinase inhibitors (TKIs) such as sunitinib, pazopanib, axitinib and sorafenib have significantly improved outcome of patients with advanced RCC.
Sunitinib is currently registered as first line treatment for patients with advanced RCC. The drug inhibits tumor angiogenesis through binding to the ATP binding pockets of the VEGF- and PDGF receptors in endothelial cells and pericytes.5 The specificity of kinase inhibition is defined by its concentration. At higher concentrations sunitinib has strong affinity for so called “off-target” ATP-binding pockets of other kinases. We previously reported that the intracellular distribution in the cytosol of sunitinib is influenced by the presence of acidic lysosomes and that in tumor tissue of patients concentrations of sunitinib are significantly higher than in plasma and reach to up to 10 µM.6 At these clinical relevant concentrations, sunitinib inhibits proliferation of cancer cells directly in vitro and reduces phosphorylation of several proteins, such as Erk1/2 (t202/y204), Akt (s473) and Stat3 (y705).6-8 Despite the important clinical benefit from TKI treatment, resistance to therapy ultimately develops and not all patients with RCC respond in the first place. Therefore, a better understanding of the mechanism of action and discovery of predictive biomarkers for TKIs in RCC are urgently wanted.9
In recent years, phosphoproteomics has emerged as a promising approach for comprehensive analysis of cellular signaling pathways.10 In particular, mass spectrometry-based phosphoproteomics allows profiling of site-specific phosphorylation events on thousands of proteins and reveals altered activity of kinases. Phosphorylations on tyrosine represent <1% of the total cellular phospho-proteome. Therefore, phospho-tyrosine containing peptides need to be immunoprecipitated prior to mass spectrometry analysis. Here, we took a phosphoproteomics approach to gain insight in the effects of sunitinib on signaling of tyrosine kinases in renal cell cancer cells and focused in detail on the activity of Axl, because of its importance in renal cell cancer biology.3 The results of this study provide evidence for a potential new combination treatment strategy that may improve the antitumor activity of sunitinib.
Material and Methods
Cell culture and transfection
786-O, 769-P and A498 renal cell cancer cells were obtained from ATCC. HCC827-ER3 cells were provided by Dr. B. Halmos. EC-RF24 cells were provided by Dr. A.W. Griffioen. 786-O and A498 cells were cultured in DMEM, while EC-RF24 and 769-P cells were cultured in RPMI. All media was supplemented with 10% fetal bovine serum (FBS) and 100 U/ml penicillin and 0.1 mg/ml streptomycin. When indicated, cells were transfected with pools of PLK-1 siRNAs (M-003290–01, Thermo Scientific), non-targeting (NT) siRNAs (D-001210–01-05, Thermo Scientific) or four different siRNAs directed against AXL (ON-TARGETplus, Thermo Scientific). Transfections were performed with Dharmafect 1 transfection reagents at optimal concentration for each cell line (0.3–0.5 μL/mL). Sunitinib (Pfizer), R428 (Axon Medchem) and staurosporin (Sigma) were dissolved in DMSO and stored as 20 mM stocks at −20°C.
MTT-assay
For each Experiment 1,500–2,000 cells were plated in triplicate wells a t = 0 and proliferation was determined after 72–96 hrs of drug treatment and compared with t = 0 hrs measurements. Cellular proliferation rate was assessed by 2 hrs incubation with 10% MTT (3–(4,5-dimethylthiazolyl-2)−2,5-diophenyl tetrazolium bromide (Sigma-Aldrich, the Netherlands) solution at 37°C. Cells were lysed in DMSO and absorbance was determined at 540 nm in a platereader. In dose curve experiments relative proliferation was compared to untreated cells (Fig. 1). To analyze sunitinib sensitizing properties of R428, relative effects of sunitinib were tested during exposure to fixed concentrations of R428 (Fig. 4).
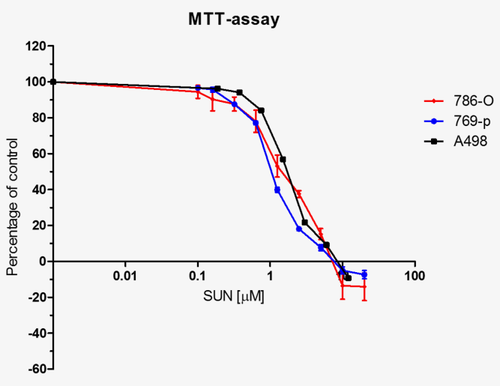
Sunitinib sensitivity of RCC cancer cell lines. A panel of RCC cells were cultured in complete media supplemented with increasing concentrations of sunitinib. The proliferation rate of cells was tested in the MTT-assay.
Immunoprecipitation of phospho-peptides
For phosphoproteomics experiments, 786-O cells were treated with 0, 2 or 5 µM sunitinib, or with 1 µM staurosporin for 2 hrs at 37°C, washed in PBS and lysed (20 mM HEPES pH 8.0, 9 M Urea, 1 mM sodium vanadate). Staurosporin (1 µM) was used as reference compound and control for vehicle toxicity. Only short term treatment was performed in order to minimize effects on protein expression. A time of 2 hrs exposure was chosen because the maximum sunitinib uptake is at this time point (Gotink and Verheul, unpublished results). Three independent experiments were performed with sunitinib, in two of which staurosporin was used as reference compound. Each biological replicate sample was analyzed in duplo by LC-MS/MS.
Sonicated cell lysates were cleared by centrifugation at 20,000g. In total 7–10 mg protein was used per condition. Cystein bonds were reduced by incubation in 4.1 mM DTT for 20 min at 60ºC, followed by alkylation for 15 min at room temperature with 8.3 mM iodoacetamide. For digestion alkylated cell lysates were diluted with 20 mM HEPES pH 8.0 to reduce the urea concentration to 2 M and Sequencing Grade Modified Trypsin (Promega) was added in a 1:40 (w/w) protein-to-trypsin ratio. Digestion was performed O/N at 20–25ºC. After addition of trifluoroacetic acid (TFA) to a final concentration of 1%, samples were centrifuged at 5,000g for 5 min and supernatants were loaded on Sep-Pak C18 columns (Waters, Etten-Leur, the Netherlands). Peptides were eluted by 5–15% acetonitrile and 0.1–1.0% TFA 40% acetonitrile/0.1% TFA. Eluted peptide solutions were lyophilized O/N and stored at −80 ºC. Immunoprecipitation of phosphopeptides was performed using the PTMScan kit (P-Tyr-100) from Cell Signaling Technology (CST) as previously described11. Briefly, lyophilized phosphopeptides were dissolved in IAP buffer (20 mM Tris-HCl pH 7.2, 10 mM sodium phosphate and 50 mM NaCl) and incubated with P-Tyr-100 agarose beads at 4ºC for 2 h. After extensive washing of the beads in IAP buffer, peptides were eluted in 0.1% TFA, concentrated in C18 StageTips, transferred to LC autosampler vials, and stored at 4°C until LC-MS/MS measurement on the same day.
LC-MS/MS
Peptides were separated by an Ultimate 3000 nanoLC-MS/MS system (Dionex LC-Packings, Amsterdam, The Netherlands). After injection, peptides were trapped on a 10 mm × 100 μm ID trap column and separated at 300 nl/min in a 10–40% buffer gradient (buffer A, 0.05% formic acid; buffer B, 80% acetonitrile/0.05% formic acid) in 60 min. Eluting peptides were measured on-line after nanospray ionization, using a Q Exactive mass spectrometer (ThermoFisher, Bremen, Germany). Intact masses were measured at resolution 70.000 (at m/z 200) in the orbitrap. MS/MS spectra were acquired at resolution 17.500 (at m/z 200) in the orbitrap using an AGC target value of 2 × 10⁵ charges and an underfill ratio of 0.1%.
Protein identification and quantification
MS/MS spectra were searched against the Uniprot human reference proteome FASTA file (release sept 2012; 147,951 entries) using MaxQuant 1.3.0.5 software.12 Cysteine carboxamidomethylation was treated as fixed modification and methionine oxidation and N-terminal acetylation as variable modifications. Peptide precursor ions were searched with a maximum mass deviation of 6 ppm and fragment ions with a maximum mass deviation of 20 ppm. Peptide and protein identifications were filtered at an FDR of 1% using the decoy database strategy. Changes in phosphorylation were determined by analysis of phosphopeptide intensity values. All phosphopeptides with a 1.5-fold intensity change in ≥ 2 out of 3 experiments were considered for further analysis. Phosphosite analysis was performed based on localization probability scores. Only class 1 phosphosites (with a localization probability score >0.75) were taken into account. Multiple phosphosites were reported in cases where multiple phosphorylations were identified per phosphopeptide.
Network and gene ontology analysis
Gene identifiers for proteins of interest were uploaded to the STRING webtool for retrieval of protein-protein interaction (PPI) information using default settings.13 This information was then imported into Cytoscape 2.8 for visualization and further analysis.14 Subclusters were identified using the ClusterONE Cytoscape plugin, using default settings except for a minimum density setting of 0.5 as recommended by the authors for unweighted networks.15 Enriched gene ontology terms (relative to the whole human proteome) for selected protein subsets were retrieved by application of the BiNGO Cytoscape plugin, using default hypergeometric statistics with Benjamini-Hochberg FDR correction for multiple testing.16
Western blot
For protein measurements in cells, treatment with sunitinib was performed at the respective IC50 concentration of each cell line for 2, 6 or 24 h after which cells were lysed in RIPA buffer supplemented with protease and phosphatases inhibitors. For Western Blot, equal protein amounts were separated on 8% SDS polyacrylamide gels and subsequently transferred to PVDF membranes. Proteins were detected using primary antibodies against Axl (Cell Signaling # 4566), pAxl (CS # 5724), FAK (SC # 557), pFAK y576 (Santa Cruz # 21831), p38 (CS # 9212), p-p38 y182 (CS # 4631 sec) and β-actin (CS # 3700). After incubation with IRDye infrared dye or HRP-labeled secondary antibodies (LI-COR Biosciences, CS # 7074, CS # 7076), membranes were scanned and analyzed with Odyssey Infrared imaging system and accompanying software or exposed to film according to standard practice.
Real time PCR
Isolation of total RNA from cells was performed using the RNeasy kit from Qiagen. To determine AXL mRNA expression levels primers were designed that specifically target the human genes (Eurogentec). Real-Time PCR was performed on the MyiQ Single-Color Real-Time PCR detection system (Biorad). For each reaction 1.5 µL of cDNA was mixed in a total volume of 25 μL reaction mix containing IQ SYBR Green supermix (Biorad) and 400 nM forward and reverse primers. All expression levels were normalized to β-actin or β2-microglobulin reference genes.
Statistical analysis
Statistical analysis of cell viability experiments was performed using GraphPad Prism software. RT-PCR and MTT-assay results were analyzed using the one-way ANOVA test with Bonferroni's multiple comparison as post hoc test. P-values < 0.05 were considered significant. For the phosphoproteomics analysis, average results from duplo injections were used for calculation of fold change values. Phosphopeptides were considered regulated using stringent quantitative filtering (1.5-fold intensity change at both 2 and 5 μM sunitinib treatment in ≥ 2 out of 3 experiments), yielding an FDR of 0.13.
Results
Determination of IC50 for sunitinib
A panel of renal cell cancer cell lines including 786-O, A498 and 769-p was tested in the MTT-assay for sensitivity to sunitinib. For these cell lines, the IC50 values for sunitinib were approximately 2.0 μM (Fig. 1). In addition, a panel of NSCLC cell lines was tested, showing an IC50 value of 5.0 μM (Supporting Information Fig. 1)
Phosphoproteome changes in renal cancer cells induced by sunitinib treatment
Phosphoproteomic analysis was performed in lysates from 786-O cells which were either untreated (controls) or exposed to sunitinib for 2 hrs at its IC50 or IC90, 2 and 5 μM, respectively (Fig. 2a). Staurosporin treatment 1.0 μM was used as positive control for inhibition of tyrosine kinases.
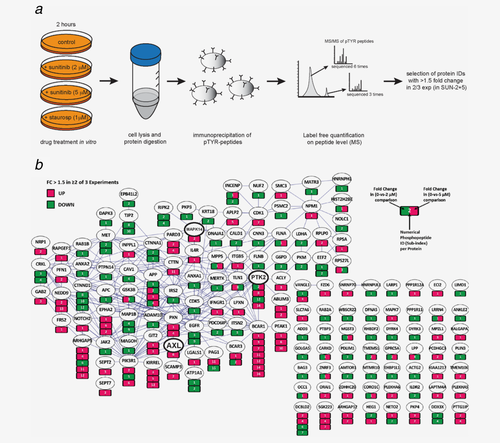
Phosphoproteomics analysis identifies up- and downregulated phosphopeptides in RCC cells treated with sunitinib. 786-O cells were treated with 0, 2 or 5 μM sunitinib or 1 μM staurosporin for 2h and lysed. Lysates were digested and enriched for phosphopeptides by immunoaffinity capture prior to mass spectrometry analysis (a). Protein identification was performed by Maxquant and relative phosphorylation was determined by label-free quantitation of phosphopeptides. All protein IDs that showed ≥1.5 fold change in 2 out of 3 experiments upon treatment with 2 and 5 μM sunitinib are shown (b).
In total, 1,519 unique phosphopeptides were identified in the samples of the three combined experiments (Supporting Information Table 1). These phosphopeptides were derived from 675 unique phosphoproteins, including 57 different phosphorylated protein kinases. Phosphopeptides derived from VEGFR, PDGFR or cKIT were not detected in the analysis. The number of phosphopeptide assignments to approximate the amount of phosphorylated protein revealed that FAK (PTK2), CDK1, GSK3B, MET, EPHA2 and EGFR are the most highly phosphorylated protein kinases in 786-O cells under regular growth conditions (Supporting Information Fig. 2). During treatment with sunitinib, 180 phosphopeptides in 129 proteins showed >1.5 fold change in ≥ 2 out of 3 experiments at both sunitinib concentrations (FDR 0.13, Fig. 2b). Of these, 86 phosphopeptides were downregulated and 94 phosphopeptides were upregulated. Among the 86 down-regulated phosphopeptides, 13 originated from kinases, including RIPK2, FAK (PTK2) [peptide ID 12], DAPK3, CDK5, MET, MERTK, EGFR, JAK2, DYRK3 and DYRK4. Other phosphopeptides that were downregulated originated from PKM, G6PD and LDHA. Fifteen of the 94 upregulated phosphopeptides were derived from protein kinases, including SGK223, FAK (PTK2) [peptide ID 8 and 14], PEAK1, EPHA2, ERK5 (MAPK7), p38α (MAPK14) and Axl.
Gene ontology analysis highlights activation of integrin- and RTK signaling
To determine whether certain functional annotations are enriched among the modulated proteins, Gene Ontology analysis was performed using the software tool BiNGO. This analysis yielded functions associated with signaling (transmembrane tyrosine signaling pathway, integrin-mediated signaling pathway), cell adhesion, regulation of cell size/growth, (actin) cytoskeletal organization, tissue morphogenesis and blood vessel development. To further dissect and visualize important functions, ClusOne analysis was performed in conjunction with BiNGO analysis. The two main clusters that included over 10 nodes with proteins showing most frequently increased protein phosphorylation were evaluated in more detail (Figs. 3a and 3b).
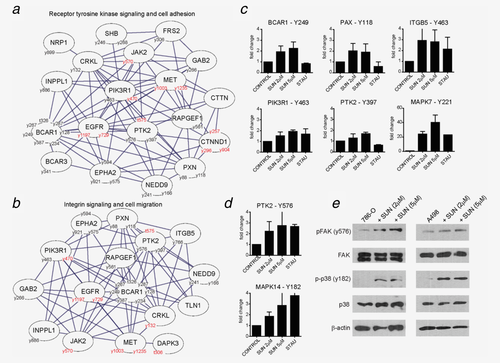
Gene ontology analysis highlights activation of FAK and RTK signaling upon sunitinib treatment. Network and gene ontology analysis were performed using STRING, BiNGO and ClusterONE plugins for cytoscape. Only significantly modulated protein IDs from Figure 2 in the phospho-proteomics experiments were imported in cytoscape. The two largest clusters emerging from this analysis are shown in panel A-B. Class 1 phosphosites with up- and downregulation are depicted along with Gene IDs in the clusters. Proteins with up- and down regulated phosphorylation are represented in black and red, respectively (a, b). Relative quantitation of phosphorylation was determined by phosphopeptide measurement. Fold change in key phosphopeptides derived from BCAR1, PAX, ITGB5, PIK3R1, MAPK7, PTK2 and MAPK14 during treatment with sunitinib or staurosporin is shown (c, d). Phosphorylation of PTK2 (FAK, y576) and MAPK14 (p38, y182) during treatment with two concentrations of sunitinib (2 and 5 μM), was determined by Western Blot using phosphosite specific antibodies (E). [Color figure can be viewed in the online issue, which is available at wileyonlinelibrary.com.]
One cluster related to growth hormone and integrin signaling, regulation of cell migration and actin cytoskeleton was identified. More detailed analysis of drug effects on phosphorylation sites of integrin β5 (ITGB5) showed activation by both sunitinib and staurosporin. Also the downstream mediator FAK (PTK2) showed increased phosphorylation in the activation loop (y576) and at the autophosphorylation site y397, while downregulation of phosphorylation of FAK (t575) was seen at a site with unknown function (Fig. 3d). Increased phosphorylation of FAK at y576 was confirmed by Western Blot in 786-O and A498 cells (Fig. 3e). Also paxillin (PXN), Cas-L (NEDD9) p130cas (BCAR1), which are well-known FAK interactors located in focal adhesions of cells, showed increased phosphorylation of y88, y118 (PXN), y241, y166 (NEDD9) and at t326, y287, y128, y234, y387, y249, y267 (BCAR1), respectively. Increased phosphorylation of these proteins was found to be present during treatment with sunitinib, but not with staurosporin (Fig. 3c).
A second protein cluster was identified with functions involved in receptor tyrosine kinase signaling, MAPK signaling, cell adhesion and blood vessel development. Within this cluster, CTNND1 showed a prominent decrease in phosphorylation at y257, y296 and y904. From the upstream receptor tyrosine kinases (EGFR, MET) in this network two down-regulated phosphorylation sites were observed, while other phosphosites (5 sites for MET, 7 for EGFR) were not regulated by sunitinib treatment. The proteins CRKL (y132) and DAPK3 (t306) showed downregulated phosphorylation at sites with unknown functional implications. Ephrin type A receptor 2 (EPHA2) showed increased phosphorylation at y594, y575 and y921.
Two other protein kinases, MAPK7/Erk5 and MAPK14/p38α, did show increased phosphorylation due to sunitinib and staurosporin treatment(Figs. 3c and 3d). These structurally related protein kinases belong to the evolutionary conserved family of mitogen-activated protein kinases (MAPKs) and can be activated by growth factor signaling, including activation of Axl. Increased phosphorylation of Erk5 at y221 and p38α at y182 were detected and confirmed by Western blot analysis (Fig. 3e).
Sunitinib induces axl phosphorylation
Based on the finding that Axl phosphorylation was upregulated by sunitinib and its established importance in RCC biology, the importance of Axl was more extensively studied. AXL gene expression was measured in a panel of RCC cell lines and (immortalized) endothelial cells (HUVECs and EC-RF24). Expression was detected at mRNA level in the majority of cell lines, including A498 and 786-O RCC cells (Fig. 4a). To confirm expression at protein level Western Blot was performed. HCC827 cells were used as negative control cell line. This experiment confirmed robust expression of Axl in the majority of cell lines (Fig. 4b). Subsequently, the effect of sunitinib treatment and AXL expression by siRNAs on proliferation was determined in 786-O RCC cells. A pool of four AXL siRNAs targeting distinct sequences on the AXL mRNA did not reduce cell proliferation (Fig. 4c). Western Blot analysis confirmed that Axl protein levels were significantly reduced with all four individual siRNAs (Supporting Information Fig. 3). Hence, silencing of basal AXL expression did not reduce 786-O cell proliferation,
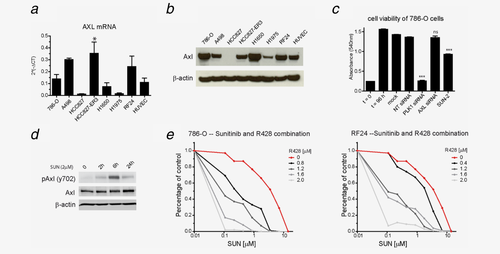
Sunitinib induces endogenous Axl phosphorylation in RCC cells. Axl was selected for independent validaton and funtional follow-up studies. AXL expression under regular growth conditions was studied in a panel of RCC, NSCLC cells (HCC827, HCC827-ER3, H1650 and H1975) and (immortalized) endothelial cells (EC-RF24 and HUVECs) by RT-PCR and Western Blot (a, b). To assess the functional role of Axl under basal growth conditions, siRNAs directed against AXL were transfected in cells. Proliferation rate of cells was measured by the MTT-assay. Non-targeting (NT-) and Polo-like kinase (PLK) siRNAs were used as respective negative and positive control for the experiments (c).To validate findings from the phosphoproteomics screen, phosphorylation of Axl y702 was determined during treatment with sunitinib (2 μM) at different time points (0, 2, 6 and 24 hrs) with Western Blot. (d). To investigate functional impact of sunitinib induced AXL activation, combination treatment was performed in 786-O and EC-RF24 cells with the Axl inhibitor R428 (e). Subtoxic concentrations of R428 were used and proliferation was determined using the MTT assay.
Subsequently, the impact of sunitinib on AXL-phosphorylation was studied in 786-O RCC cells. Phosphorylation was studied in a time course experiment using 2 μM sunitinib for 2, 6 and 24 hrs. Transient upregulation of Axl phosphorylation was detected as soon as 2 hrs after start of treatment (Fig. 4d). Recently, overexpression and activation of Axl was shown to influence proliferation and drug sensitivity (erlotinib) of NSCLC cells.17 A cell line from this study (HCC827-ER3) was used to validate the initial results in independent cell line models with high AXL expression. Compared to control conditions, suppression of basal AXL expression by siRNAs as well as sunitinib significantly reduced HCC827-ER3 cell proliferation (p < 0.01). Similar to findings in 786-O cells, induction of Axl phosphorylation was observed at residue y702 after 2 and 6 hrs (Supporting Information Fig. 4).
To assess whether sunitinib-induced AXL activation reduces its antiproliferative activity, combination treatment of sunitinib with the small molecule AXL-inhibitor R428 was studied. R428 single agent activity showed 50% inhibition of 786-O cellular proliferation at 0.75 μM, which is comparable to prior reports in breast cancer cell lines.18 A similar sensitivity was found in EC-RF24 endothelial cells (0.85 μM) (Supporting Information Fig. 5). Inhibition of Axl by R428 at a concentration range of 0.4 – 2.0 μM significantly sensitized 786-O RCC and RF24 endothelial cells to treatment with sunitinib. In three independent experiments, the sunitinib dose modifying factor of R428 ranged from 1.7 to 3.1 (Fig. 4e).
Discussion
We here evaluated the effect of sunitinib on protein phosphorylation in tumor cells. Consistent with its function as a tyrosine kinase inhibitor, sunitinib downregulated phosphorylation of numerous proteins. However, simultaneously a comparable number of upregulated phosphorylated proteins was found due to sunitinib exposure (94 upregulated and 85 downregulated). Fifteen of the 94 upregulated phosphopeptides were derived from protein kinases, including SGK223, FAK (PTK2) [peptide ID 8 and 14], PEAK1, EPHA2, ERK5 (MAPK7), p38α (MAPK14) and Axl.
The expression of the receptor tyrosine kinase Axl in tumors has been postulated as a biomarker. Increased mRNA levels of Axl is associated with poor differentiation grade and survival in renal cell cancer.3, 19, 20 Its expression was found to be regulated by VHL, linking the receptor closely to RCC biology.19 Another study revealed a connection between HIF/AXL expression and the metastatic phenotype of RCC cells, providing another independent rational for Axl targeting in RCC.21 Of particular interest, is the fact that multiple Axl-inhibitors are in different stages of clinical development. Recently cabozantinib (a MET/AXL inhibitor) showed promising results as single agent inhibitor after treatment with VEGF targeted inhibitors in patients with advanced RCC.22 We subjected the effects of sunitinib on the tyrosine kinase Axl to a more detailed analysis. In previous studies, low nanomolar affinity of sunitinib for this kinase was found.23 In an additional study focused on enzymatic kinase activity, sunitinib was identified as a potent Axl-inhibitor.24 However, exposure of living cells to sunitinib for 2, 6 and 24 hrs transiently enhanced the phosphorylation of Axl (y702) in the activation loop. Many variables, such as ATP-availability, are difficult to take into account in in vitro experiments. These results reassure the importance of studying kinase activity in cell based assays in conjunction to cell free experiments.
Axl was previously reported to play a potential role in resistance to EGFR inhibitory drugs including erlotinib (NSCLC) and cetuximab (head and neck cancer).17, 25 Induction of AXL expression was found in these studies, which was attributed to an altered gene expression program, associated with epithelial to mesenchymal transition (EMT).20 Our experiments revealed high basal Axl expression in RCC cells, but elevated phosphorylation upon treatment with sunitinib. Although Axl activation can be achieved by gas6 binding to the extracellular domain, we did not observe modulation of gas6 levels during treatment with sunitinib in 786-O cells (data not shown). Previously, non-classical ways of activation were reported for Axl family members and included heterodimerization or transactivation by other molecules, such as Src family kinases and integrin receptors.26, 27 Particularly, the functional interaction with integrin receptors warrants further investigation, given our finding that Axl and ITGB5 are both activated. Combination treatment with the Axl-inhibitor R428 potentiated the anti-proliferative activity of sunitinib indicative for Axl mediated resistance mechanisms.
Profound effects of sunitinib exposure were observed on integrin signaling, including enhanced phosphorylation of FAK, BCAR1, NEDD9, PXN and ITGB5. The increased phosphorylation of the y397 and y576 sites in FAK are key in this signaling pathway, while integrin cell adhesion receptors play crucial roles in activation of FAK.28 Increased phosphorylation of integrin β5 (y766) as potential upstream mediator may be responsible for this activation. The y397 site in FAK is a known autophosphorylation site, whose phosphorylation correlates with kinase activity. Phosphorylation of y576 in the catalytic subdomain is required for full enzymatic activity and is dependent on Src.29 The interaction between FAK and Src seems essential for efficient FAK signaling. Bai et al found synergistic inhibition of proliferation as well as migration when sunitinib was combined with the Src inhibitor saracatinib in RCC cells.30 FAK has an important role in the formation of blood vessels, but also contributes to metastasis and cancer cell proliferation.31 Pharmacological inhibitors to FAK have been developed and showed potent activity in multiple preclinical tumor models.32 It would be of interest to investigate whether these inhibitors could potentiate sunitinib's antitumor activity as well.
Ephrin type A receptor 2 (EPHA2) also showed an increased phosphorylation at y594, y575 and y921 upon sunitinib exposure. EPH receptor A2 belongs to the largest receptor tyrosine kinase family and is usually activated by its ligand Ephrin A1. Similar to Integrin β5, interaction of EPHA2 with downstream partners FAK and p130cas was shown to be critical for biological effects.33 Overexpression of EPHA2 in tumor tissue specimens was described as prognostic biomarker, notably linked to a more invasive phenotype.34, 35 Whether EPHA2 may act as independent target for combination treatment requires further evaluation.
Increased phosphorylation of Erk5 at y221 and p38α at y182 were detected of which the upregulation of the latter by Western blot analysis in both 786-O and A498 cells were confirmed. Both these sites are located in the TEY sequence that is typically phosphorylated upon enzymatic activation of MAPK family members.36, 37 ERK5 has a large C-terminal domain that regulates activation and subsequent subcellular localization and nuclear shuttling. The function of P38 in contrast seems to be in the cytoplasm. Both kinases regulate the cellular response to many types of stress through activation of transcription factors such as p53, c-Fos, STAT1-3 and NF-κB. We indeed found evidence for transient activation of NF-κB in vitro, which supports our conclusion that signaling is activated (data not shown).
Among the downregulated protein phosphorylations were EGFR, MET, DYRK3, DYRK4, CTNNA1, CTNND1G6PD (y401/t402), LDHA (y10) and PKM (y390). LDH-A and PKM are rate limiting enzymes involved in glycolysis, while G6PD has been identified as regulator of the pentose phosphate shunt. Although we did not explore the functional implications of these alterations, they could be of major interest, considering the frequent metabolic shift in RCC that was identified by the cancer genome atlas (TCGA) and the induction of autophagy by sunitinib as was recently found.38, 39
In conclusion, while sunitinib inhibits tumor cell proliferation, short exposure to sunitinib of tumor cells inhibits and activates tyrosine kinases at the same time. Increased phosphorylation of several kinases may be due to a pro-survival reaction, including activation of the Axl and FAK signaling pathways. We do consider that these modifications are not specific for sunitinib and may occur with other kinase inhibitors as well.40, 41 Evaluation of tumor tissue from patients undergoing treatment with sunitinib or other TKIs may provide more insights in actual signaling modifications and ultimately may guide new combination treatment strategies.


