Integrated analysis of NET-DNA receptor CCDC25 in malignant tumors: Pan-cancer analysis
Abstract
Background
Previously, it was reported that the coiled-coil domain containing 25 (CCDC25) plays a role in the formation of neutrophil extracellular traps (NETs). This study systematically analyzed the expression profiles of CCDC25 in 30 different types of cancer and one type of blood cancer, acute myeloid leukemia.
Methods
The GTEx and CCLE databases were used to evaluate the distribution of CCDC25 expression in both normal tissue and cancer cell lines. A comparison was performed between normal tissue and tumor tissue to analyze the differential expression of CCDC25. We assessed the impact of CCDC25 on the clinical outlook in the TCGA pan-cancer data set by analyzing the Kaplan–Meier survival plot and conducting COX regression analysis. Moreover, the association between the expression levels of CCDC25 and the tumor microenvironment in multiple cancers was conducted. Additionally, the investigation also examined the link between CCDC25 and immune neoantigen, tumor mutational burden, microsatellite instability, mismatch repair genes (MMRs), HLA-related genes, and DNA methyltransferase (DNMT).
Results
CCDC25 was expressed in nearly all of the 31 normal tissues while exhibiting a moderate to low level of expression in cancer cell lines. While abnormal expression was detected in the majority of malignancies, there was no link found between elevated CCDC25 levels and overall survival, disease-free survival, recurrence-free survival, and disease-free interval in the TCGA comprehensive cancer data set. Nevertheless, the expression of CCDC25 exhibited a notable link with the infiltration levels of activated CD4 memory T cells, quiescent mast cells, dendritic cells in an activated state, T cells that assist in follicle development, M2 macrophages, and neutrophils in various tumors.
Conclusions
In most cancers, the results indicate that there is no link between CCDC25 and prognosis. However, CCDC25 can be targeted for therapeutic purposes concerning metastasis and immune infiltration.
1 INTRODUCTION
Neutrophils have a crucial function in the innate immune response and participate in different inflammatory disorders.1-3 Their contribution to the progression of cancer has recently been acknowledged. Nevertheless, with other immune cells, there is still limited comprehension regarding the function of neutrophils within the tumor microenvironment. Numerous research have indicated that neutrophil extracellular traps (NETs) are composed of chromatin DNA fragments covered with granulated proteins, which are released by neutrophils to ensnare microorganisms.4-10 Cancer invasion, evasion, and metastasis have also been associated with the genetic material of NETs (NET-DNA) in recent research studies.11-16 Moreover, the importance of CCDC25 expression in NET-DNA cannot be overstated, as it has been detected in numerous cancer types such as cholangiocarcinoma, gastric cancer, hepatocellular carcinoma, and myeloma.17-21 Therefore, CCDC25 may be a reliable biomarker indicating tumor metastasis and may present a potential therapeutic target to improve patient prognosis.
CCDC25 is a protein that spans the cell membrane and is widely present in cells of mammals. According to the UniProt data set, the CCDC25 gene is located on chromosome 8p21.1, and the protein consists of 208 amino acids with a molecular weight of approximately 25 kDa. CCDC25 is present in the cytoplasm of different cell types, such as hepatocytes and myocytes.22 It effectively inhibits the spread of cancer, which is dependent on NET. Nevertheless, the occurrence of CCDC25 in human cancers is quite uncommon and remains uninvestigated. Hence, the objective of this investigation was to evaluate the outlook of CCDC25 by utilizing the openly accessible data set through bioinformatics analysis. Furthermore, the link between the expression of CCDC25 and immune neoantigen, tumor mutational burden (TMB), and microsatellite instability (MSI) was examined.
2 MATERIALS AND METHODS
2.1 Data source
Transcriptomic data were acquired from the TCGA Pan-cancer cohort (https//portal.gdc.cancer.gov/), the Genotype-Tissue Expression (GTEx) initiative, and the Cancer Cell Line Encyclopaedia (CCLE). The GTEx data set provided mRNA data from 31 tissues that were in a healthy state. Moreover, research was carried out on the dispersion of cancer cell line expression levels in 21 establishments utilizing information from the CCLE database. The TCGA data set provided the mRNA profiling of tumor tissues from adjacent tumor tissues and 31 tumors. Furthermore, the TCGA data set included clinical survival data.23 To evaluate the difference in tissues, the Kruskal–Wallis test was employed.
2.2 Differential analysis
To assess the disparities between these groups, the analysis focused on the expression of CCDC25 in both healthy and tumor tissues, including tumor samples and adjacent normal tissue samples. The Wilcoxon test was employed to assess statistically significant disparities, with a p value below 0.05.
2.3 Evaluation of predictive stages among different forms of cancer
To evaluate the link between CCDC25 expression levels and different types of cancers, univariate Cox regression analyses were conducted in overall survival (OS), disease-specific survival (DSS), disease-free interval (DFI), and progression-free interval (PFI). Significance was attributed to Cox p values that were below 0.05. Samples were divided according to the median expression of CCDC25, and prognostic analysis was determined using the Kaplan–Meier survival analysis technique. Statistical significance was assessed using the log-rank test, considering p values less than 0.05 as indicative of significant differences. Furthermore, the link between the expression of CCDC25 and various clinical parameters, such as the TNM stage, was evaluated to gain further insight into this link.
2.4 The link between the expression of CCDC25 and the infiltration of the immune system
Several research studies have indicated that tumor immune cells (TIICs), such as B cells, T cells, dendritic cells, macrophages, neutrophils, monocytes, and mast cells, can control the advancement of cancer and play a role in discovering potential treatment choices.6 This study examined the link between the expression of CCDC25 and the infiltration of the immune system in multiple tumor types. To assess the infiltration of immune cells in various types of cancer, the CIBERSORT method was utilized. The Spearman analysis was used to compare CCDC25 and the ratings of these immune cells in 31 different tumors. The TCGA pan-cohort utilized the ESTIMATE method to impute the level of immune cell infiltration in every tumor specimen, encompassing immune score, tumor purity, and stromal score. Moreover, the connection between immunological scores and CCDC25 was explored.
In the treatment of different types of cancers, ICI that target PD-1 or its ligand (PD-L1) or CTLA-4 have a crucial function.24 This study investigated the functions of immune checkpoint-related genes, including inhibitors based on monoclonal antibodies, therapeutic antibodies, cancer vaccines, cell-based therapies, and small-molecule inhibitors. Over 40 immune checkpoint genes were analyzed in this research. The immune checkpoint genes were obtained separately, and their link with the expression of the desired gene was assessed.
Multiple research studies have indicated a link between the number of immune neoantigens linked to MHC class I and cytolytic function, which was found to be lower than anticipated in colorectal cancer and various other malignancies.25 Nonetheless, the connection between immune neoantigens and CCDC25 remains ambiguous. Hence, the significance lies in investigating the link between immune neoantigens and the levels of CCDC25 expression. Furthermore, the reaction of individuals to immune checkpoint inhibitors (ICI) can be anticipated by tumor mutation burden (TMB), which serves as a unique genetic indicator.26-28 The study aimed to assess the link between TMB and the levels of CCDC25 expression.
2.5 Investigating the link between the expression levels of CCDC25 and MMRs, DNA methyltransferase (DNMT), and MSI
Changes in DNA MMRs, such as in somatic cells or germ cell lines (Lynch syndrome), are linked to the occurrence of MSI in tumors. MSI is commonly seen in different types of tumors, such as colorectal cancer, endometrial cancer, and gastric cancer. It is characterized by a substantial presence of immune cells and a considerable quantity of tumor neoantigens.29, 30 This study investigated the link between CCDC25 and MSI.
MMRs are linked to intracellular processes associated with the correction of mismatches. Therefore, the absence of genes essential to this process may lead to irreversible errors during DNA replication, ultimately increasing somatic mutations.31, 32 The main cause of colorectal cancer, endometrial cancer, and gastric cancer is the lack of MMRs, which results in MSI. The present study utilized TCGA gene expression analysis to assess the link between alterations in MMRs (MLH1, MSH2, MSH6, PMS2, and EPCAM) and CCDC25.
Regulation of gene expression can occur through DNA methylation, leading to alterations in chromatin organization, DNA shape, stability, and protein binding. DNA methylation is the process of adding a methyl group to the carbon located at the 5′ position of the cytosine residue within the genomic CpG dinucleotide. This process is catalyzed by DNMT.33 To establish their link, the connection between CCDC25 and four methyltransferases (DNMT1, DNMT2, DNMT3A, and DNMT3B) was examined in this investigation.
2.6 Performing GSEA analysis on different cancer tissue types obtained from the TCGA data set
To assess the impact of CCDC25 expression on tumors, the present investigation classified the specimens into high and low categories according to the levels of gene expression. To evaluate the impact of CCDC25 expression on tumors, we utilized Gene Set Enrichment Analysis (GSEA) to investigate the enrichment of KEGG pathways.34 The curated signatures from the Molecular Signature Database (MSigDB) of Broad Institute were acquired by utilizing the c5 gene sets. In addition, the KEGG terms were identified for both the high and low CCDC25 groups. With a threshold of a false discovery rate (FDR) below 0.05, the obvious pathway of enrichment was determined.
2.7 Verification of the human protein atlas (HPA)
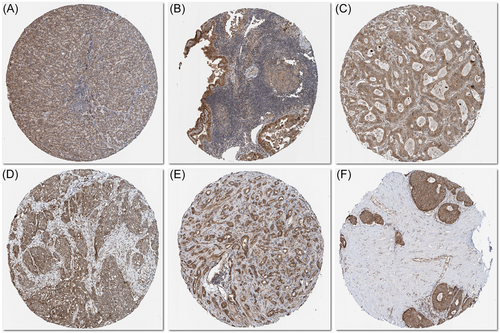
The HPA database (https//www.proteinatlas.org/) was used to determine the immunohistochemistry (IHC) images of CCDC25 protein expression levels in carcinoma and normal para-carcinoma tissues.
3 RESULTS
3.1 The presence of CCDC25 in healthy populations and cancerous cell lines
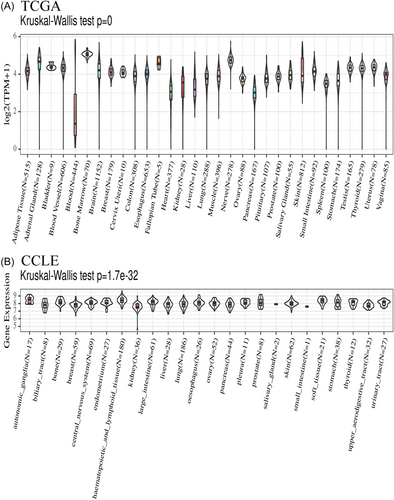
In the healthy population, CCDC25 exhibited high expression in most organs, with the nerves, bone marrow, and fallopian tubes showing the highest levels. Conversely, the blood, pancreas, and heart displayed the lowest expression of CCDC25 (Figure 1A). CCDC25 expression in different organs was observed to be moderate to low in cancer cell lines. The highest expression was observed in autonomic ganglia, hematopoietic and lymphoid tissues, and prostate, whereas the kidney, biliary tract, and small intestine showed the lowest expression (Figure 1B). The Kruskal–Wallis test showed a significant difference in the expression of CCDC25 across the different organs.
3.2 The levels of CCDC25 mRNA expression in various human tumor types
A notable variation in CCDC25 expression levels was observed between adjacent tumor samples and tumor samples in various cancer types, as indicated by TCGA pan-cancer data (Figure 2A). The expression of CCDC25 was increased in CHOL, HNSC, and STAD tumors, whereas it was decreased in BLCA, BRCA, COAD, KICH, KIRC, KIRP, LIHC, LUAD, PRAD, READ, THCA, and UCEC tumors. Nevertheless, there were no notable alterations observed in the expression of CCDC25 in ESCA, GBM, LGG, LUSC, and PAAD.
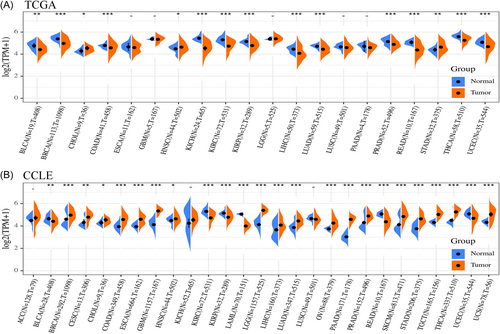
Analyzing the expression of CCDC25 in 31 various cancer types and one blood cancer (acute myeloid leukemia), data from normal tissues in the GTEx database and tumor tissues from the TCGA data set were integrated. There was notable variation in the levels of CCDC25 expression across various types of cancer (Figure 2B). CCDC25 expression was significantly elevated in breast, lung, prostate, brain, and pancreatic tumors in comparison to normal tissues. In certain tissues, there was a decrease in CCDC25 expression observed in kidney, rectum, and biliary tract cancers.
3.3 Examining predictive elements across multiple types of cancer in TCGA
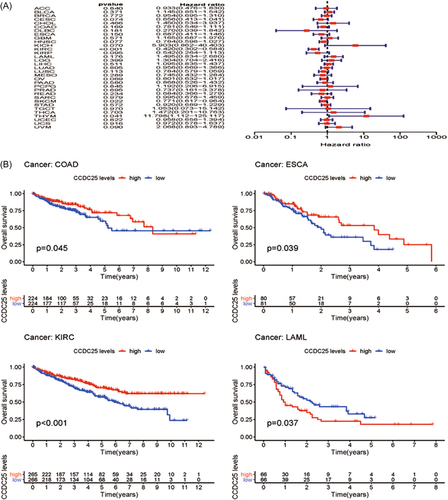
By analyzing 31 tumors in the TCGA data set, a thorough examination was conducted to systematically analyze the predictive landscape. The objective of this study was to investigate the potential link between the expression of CCDC25 and the outcomes of survival in different types of cancer. Figure 3A and Table 1 showcase the forest plot and univariate Cox regression analysis for different types of cancers. Except for KIRC (OS HR = 0.41, CI = 0.30-0.58, p < 0.001), THYM (OS HR = 11.80, CI = 1.11 to 125.12, p < 0.001), and SKCM (OS HR = 0.77, CI = 0.62-0.96, p < 0.001), CCDC25 had minimal impact on most cancers. A Kaplan–Meier survival analysis was conducted to determine prognostic tumor classifications. Figure 3B exhibits the Kaplan–Meier survival graph. ESCA and KIRC showed a positive link between increased levels of CCDC25 and improved overall survival, whereas LAML exhibited a negative link between higher levels of CCDC25 and overall survival. Furthermore, the COX findings demonstrated a lack of link between CCDC25 expression and prognosis in most tumors.
| Type of tumor | HR | HR.95L | HR.95H | p Value |
|---|---|---|---|---|
| ACC | 0.933075 | 0.475839 | 1.829669 | 0.84022 |
| BLCA | 1.145183 | 0.850737 | 1.541539 | 0.371341 |
| BRCA | 0.954183 | 0.695168 | 1.309706 | 0.771629 |
| CESC | 0.65582 | 0.413118 | 1.041105 | 0.073594 |
| CHOL | 1.449689 | 0.533831 | 3.936822 | 0.466282 |
| COAD | 0.781144 | 0.549192 | 1.111062 | 0.169418 |
| DLBC | 0.269595 | 0.039463 | 1.841743 | 0.181209 |
| ESCA | 0.686505 | 0.411243 | 1.146012 | 0.15024 |
| GBM | 1.164906 | 0.686891 | 1.975575 | 0.57114 |
| HNSC | 0.783532 | 0.59769 | 1.02716 | 0.077401 |
| KICH | 5.902978 | 0.862443 | 40.40284 | 0.070425 |
| KIRC | 0.419893 | 0.301865 | 0.584071 | 2.56E-07 |
| KIRP | 0.54221 | 0.264175 | 1.112867 | 0.095223 |
| LAML | 1.495381 | 0.834416 | 2.679917 | 0.176436 |
| LGG | 1.303728 | 0.703517 | 2.416016 | 0.399412 |
| LIHC | 1.095396 | 0.834923 | 1.437129 | 0.510737 |
| LUAD | 0.955971 | 0.668885 | 1.366275 | 0.804809 |
| LUSC | 0.783527 | 0.579468 | 1.059446 | 0.113008 |
| MESO | 0.745071 | 0.432463 | 1.283651 | 0.289022 |
| OV | 0.801498 | 0.631687 | 1.016958 | 0.068526 |
| PAAD | 0.868034 | 0.526076 | 1.432269 | 0.57965 |
| PCPG | 1.192227 | 0.205541 | 6.915421 | 0.844587 |
| PRAD | 0.737208 | 0.160868 | 3.378391 | 0.694656 |
| READ | 0.684156 | 0.366064 | 1.278655 | 0.234208 |
| SARC | 0.994945 | 0.678381 | 1.459232 | 0.979307 |
| SKCM | 0.770932 | 0.616846 | 0.963507 | 0.022212 |
| STAD | 0.919894 | 0.688682 | 1.228732 | 0.571851 |
| TGCT | 1.053247 | 0.073264 | 15.14155 | 0.969572 |
| THCA | 1.472486 | 0.201459 | 10.76258 | 0.702995 |
| THYM | 11.79758 | 1.112424 | 125.1167 | 0.040521 |
| UCEC | 0.957972 | 0.658473 | 1.393693 | 0.822386 |
| UCS | 0.972489 | 0.577579 | 1.637412 | 0.916421 |
| UVM | 2.068129 | 0.893209 | 4.788527 | 0.089825 |
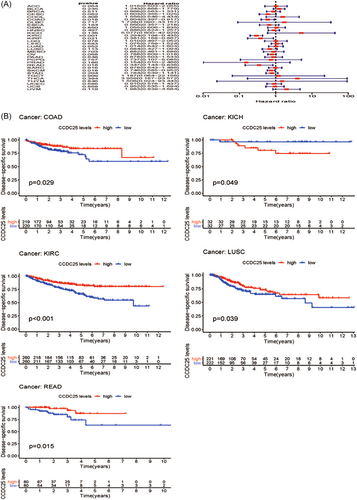
Moreover, the link between the expression of CCDC25 and DSS was examined in 31 tumors. Except for KIRC (DDS HR = 0.29, CI = 0.19–0.43, p < 0.001), COAD (DDS HR = 0.60, CI = 0.39–0.92, p < 0.001), SKCM (DDS HR = 0.75, CI = 0.58–0.95, p < 0.001), READ (DDS HR = 0.35, CI = 0.14–0.84, p < 0.001), and KIRP (DDS HR = 0.38, CI = 0.17-0.87, p < 0.001) (Figure 4A and Table 2), most tumors did not exhibit a link between the expression of CCDC25 and DSS. According to the Kaplan–Meier survival analysis (Figure 4B), there was notable diversity in CCDC25 expression among the COAD, KICH, KIRC, LUSC, and READ. Furthermore, elevated levels of CCDC25 were linked to enhanced DSS in the above-mentioned cancer types, except for KICH.
| Type of tumor | HR | HR.95L | HR.95H | p Value |
|---|---|---|---|---|
| ACC | 1.016216 | 0.502545 | 2.054931 | 0.964287 |
| BLCA | 1.242929 | 0.868402 | 1.778983 | 0.234557 |
| BRCA | 0.865705 | 0.562922 | 1.331349 | 0.511371 |
| CESC | 0.60321 | 0.355009 | 1.024936 | 0.061637 |
| CHOL | 1.55572 | 0.54588 | 4.43369 | 0.408198 |
| COAD | 0.60351 | 0.39731 | 0.916725 | 0.017903 |
| DLBC | 1.727661 | 0.09002 | 33.15731 | 0.716816 |
| ESCA | 0.659722 | 0.357346 | 1.21796 | 0.183637 |
| GBM | 1.054722 | 0.606258 | 1.834928 | 0.850422 |
| HNSC | 0.885539 | 0.623733 | 1.257235 | 0.496633 |
| KICH | 5.076565 | 0.600333 | 42.92874 | 0.135829 |
| KIRC | 0.293627 | 0.198236 | 0.434921 | 9.73E-10 |
| KIRP | 0.38107 | 0.167513 | 0.866884 | 0.021414 |
| LGG | 1.010057 | 0.497212 | 2.05187 | 0.977923 |
| LIHC | 1.075283 | 0.758819 | 1.523729 | 0.683183 |
| LUAD | 1.014084 | 0.64172 | 1.602515 | 0.952232 |
| LUSC | 0.68366 | 0.427062 | 1.094433 | 0.113174 |
| MESO | 0.881659 | 0.461117 | 1.68574 | 0.703306 |
| OV | 0.787552 | 0.609306 | 1.017942 | 0.068131 |
| PAAD | 0.878106 | 0.502909 | 1.53322 | 0.647595 |
| PCPG | 0.73729 | 0.106907 | 5.08477 | 0.757062 |
| PRAD | 0.153777 | 0.00959 | 2.465905 | 0.186018 |
| READ | 0.347486 | 0.144352 | 0.836474 | 0.018356 |
| SARC | 0.977772 | 0.643156 | 1.486478 | 0.916233 |
| SKCM | 0.746023 | 0.584814 | 0.951671 | 0.018337 |
| STAD | 0.784058 | 0.538566 | 1.141453 | 0.204251 |
| TGCT | 1.186857 | 0.063578 | 22.1559 | 0.908668 |
| THCA | 3.958884 | 0.167493 | 93.57245 | 0.393836 |
| THYM | 1.506355 | 0.024283 | 93.44315 | 0.845755 |
| UCEC | 0.910037 | 0.576454 | 1.436658 | 0.685724 |
| UCS | 0.95236 | 0.53549 | 1.693758 | 0.868029 |
| UVM | 1.982986 | 0.839415 | 4.684495 | 0.118557 |
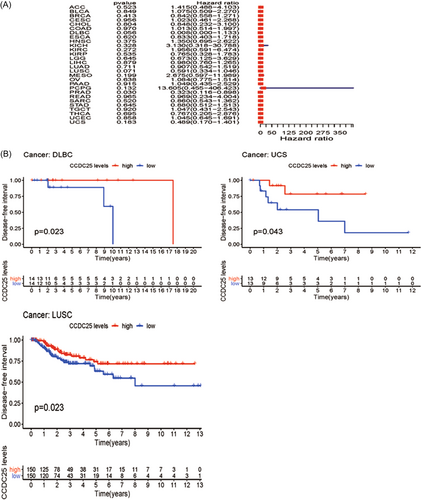
Afterward, an examination was performed to uncover the connection between CCDC25 and DFI in 31 tumors. Figure 5A and Table 3 display the forest plot. A significant link was observed between CCDC25 expression and DFI in KIRC (DFI HR = 0.29, CI = 0.19-0.43, p < 0.001), COAD (DFI HR = 0.60, CI = 0.39-0.92, p < 0.001), SKCM (DFI HR = 0.74, CI = 0.58-0.95, p < 0.001), READ (DFI HR = 0.35, CI = 0.14-0.84, p < 0.001), and KIRP (DFI HR = 0.38, CI = 0.17-0.87, p < 0.001) among the assessed tumors. Figure 5B displayed differences in survival rates among DLBC, UCS, and LUSC according to the Kaplan–Meier survival analysis.
| Type of tumor | HR | HR.95L | HR.95H | p Value |
|---|---|---|---|---|
| ACC | 1.414622 | 0.487726 | 4.103031 | 0.523196 |
| BLCA | 1.075415 | 0.509476 | 2.270013 | 0.848724 |
| BRCA | 0.841897 | 0.557663 | 1.271002 | 0.412847 |
| CESC | 1.022746 | 0.461218 | 2.267928 | 0.955858 |
| CHOL | 0.848329 | 0.232138 | 3.100145 | 0.803539 |
| COAD | 1.013105 | 0.513941 | 1.997079 | 0.970006 |
| DLBC | 0.007569 | 5.06E-05 | 1.132778 | 0.055982 |
| ESCA | 0.832577 | 0.403497 | 1.71794 | 0.620047 |
| HNSC | 1.350281 | 0.695478 | 2.62159 | 0.374993 |
| KICH | 3.130258 | 0.318256 | 30.78811 | 0.327896 |
| KIRC | 1.956311 | 0.591137 | 6.474225 | 0.271766 |
| KIRP | 0.765269 | 0.328418 | 1.783208 | 0.535366 |
| LGG | 0.673379 | 0.124937 | 3.629361 | 0.645435 |
| LIHC | 0.980454 | 0.760095 | 1.264698 | 0.879209 |
| LUAD | 0.90709 | 0.541837 | 1.518561 | 0.710702 |
| LUSC | 0.591387 | 0.334322 | 1.046113 | 0.071067 |
| MESO | 2.674648 | 0.596708 | 11.98869 | 0.198662 |
| OV | 1.083565 | 0.775337 | 1.514327 | 0.638389 |
| PAAD | 1.049306 | 0.435324 | 2.529249 | 0.914614 |
| PCPG | 13.60538 | 0.455453 | 406.4231 | 0.132019 |
| PRAD | 0.323448 | 0.116465 | 0.898283 | 0.030327 |
| READ | 0.968537 | 0.234283 | 4.003988 | 0.964787 |
| SARC | 0.859947 | 0.54294 | 1.362045 | 0.520181 |
| STAD | 0.880458 | 0.512255 | 1.513321 | 0.645009 |
| TGCT | 1.046595 | 0.43072 | 2.543093 | 0.919919 |
| THCA | 0.767417 | 0.204747 | 2.876375 | 0.694544 |
| UCEC | 1.044823 | 0.645438 | 1.691341 | 0.858393 |
| UCS | 0.488507 | 0.170297 | 1.401309 | 0.18272 |
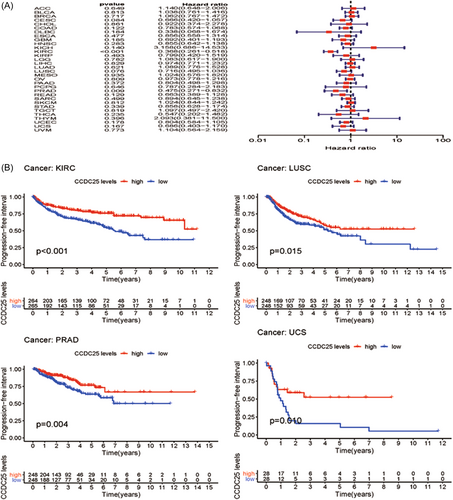
Moreover, the link between the manifestation of CCDC25 and PFI was evaluated in various forms of malignancies. The forest plot is presented in Figure 5A and Table 4. Except for PRAD (PFI HR = 0.32, CI = 0.12-0.89, p < 0.001), there was no link between CCDC25 and PFI in the evaluated tumors. Nevertheless, DLBC, LUSC, and UCS exhibited improved rates of survival according to the Kaplan–Meier survival analysis (Figure 6B).
| Type of tumor | HR | HR.95L | HR.95H | p Value |
|---|---|---|---|---|
| ACC | 1.140386 | 0.648247 | 2.006148 | 0.648515 |
| BLCA | 1.038287 | 0.76118 | 1.416275 | 0.812501 |
| BRCA | 1.062319 | 0.766537 | 1.472233 | 0.716531 |
| CESC | 0.666062 | 0.419815 | 1.056747 | 0.084422 |
| CHOL | 0.922358 | 0.373535 | 2.277552 | 0.860887 |
| COAD | 0.782817 | 0.574016 | 1.067569 | 0.121889 |
| DLBC | 0.337622 | 0.068075 | 1.674452 | 0.18384 |
| ESCA | 0.856074 | 0.557789 | 1.313872 | 0.477086 |
| GBM | 0.691791 | 0.40129 | 1.192591 | 0.184809 |
| HNSC | 0.854851 | 0.642174 | 1.137963 | 0.282603 |
| KICH | 3.158115 | 0.686293 | 14.5327 | 0.139785 |
| KIRC | 0.367785 | 0.261159 | 0.517944 | 1.03E-08 |
| KIRP | 0.798667 | 0.42005 | 1.518557 | 0.492892 |
| LGG | 1.082546 | 0.616816 | 1.899928 | 0.782268 |
| LIHC | 0.974438 | 0.770858 | 1.231781 | 0.828548 |
| LUAD | 1.089217 | 0.776416 | 1.52804 | 0.620752 |
| LUSC | 0.716075 | 0.494929 | 1.036034 | 0.076374 |
| MESO | 1.024234 | 0.576302 | 1.820321 | 0.934958 |
| OV | 0.972792 | 0.777946 | 1.216439 | 0.808866 |
| PAAD | 0.803968 | 0.497786 | 1.29848 | 0.372348 |
| PCPG | 0.787414 | 0.284059 | 2.182717 | 0.645917 |
| PRAD | 0.474512 | 0.270782 | 0.831523 | 0.009199 |
| READ | 0.66252 | 0.389133 | 1.127978 | 0.129418 |
| SARC | 0.893546 | 0.644671 | 1.2385 | 0.49919 |
| SKCM | 1.023722 | 0.843677 | 1.242189 | 0.812224 |
| STAD | 0.85847 | 0.627921 | 1.173668 | 0.338877 |
| TGCT | 1.097052 | 0.49725 | 2.420355 | 0.818536 |
| THCA | 0.547271 | 0.202159 | 1.481533 | 0.235478 |
| THYM | 2.092752 | 0.380839 | 11.49991 | 0.395614 |
| UCEC | 0.80355 | 0.584473 | 1.104742 | 0.178094 |
| UCS | 0.686424 | 0.402697 | 1.170058 | 0.166732 |
| UVM | 1.103792 | 0.564205 | 2.159423 | 0.773033 |
Furthermore, the link between CCDC25 and the TNM stage was investigated in 31 different types of tumors. No apparent link between the TNM stage and the expression of CCDC25 was observed in the majority of tumors (Supporting Information: Figure 1).
3.4 The link between CCDC25 and immune infiltration in pan-cancer analysis
In multiple types of tumors, the CIBERSORT technique was used to estimate the ratios of immune cell infiltration. The link between the expression of CCDC25 and the levels of immune infiltration in different malignancies indicated a link with the infiltration level of macrophage Mo in 17 types of cancer. In multiple cancers, Figure 7 shows a strong link between CCDC25 expression and the infiltration levels of activated memory CD4 T cells, resting mast cells, activated dendritic cells, follicular helper T cells, and macrophages M2. This link is observed in 16 cases for CD4 T cells and mast cells, 13 cases for dendritic cells and helper T cells, and 12 cases for M2 macrophages. Furthermore, the extent of CCDC25 expression correlated with the presence of neutrophil infiltration in MESO, LGG, KIRP, HNSC, GBM, UCEC, LUSC, and BLCA. In HNSC, the infiltration level of quiescent dendritic cells (r = −0.10, p = 0.02), M0 macrophages (r = −0.15, p = 0.00088), macrophages M2 (r = −0.11, p = 0.015), and activated mast cells (r = −0.14, p = 0.0015) showed a significant inverse link with CCDC25 expression.
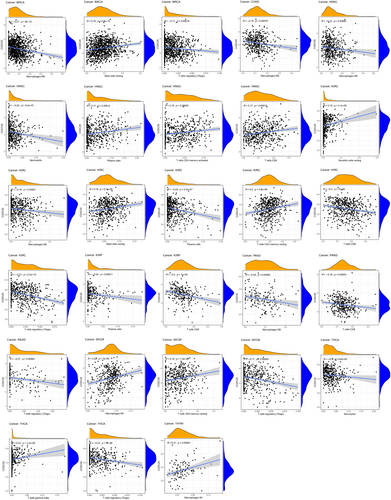
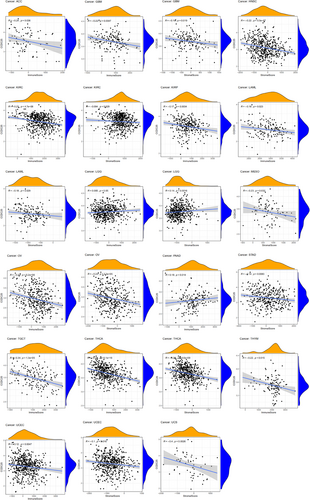
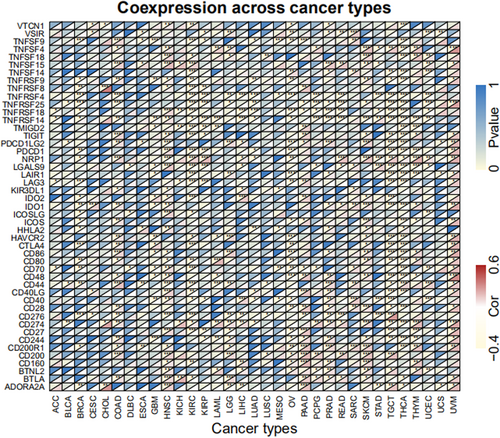
CCDC25 controls the levels of immune infiltration in different types of cancer. Genomics methods have been utilized to determine the particular forms of cancers in which CCDC25 is linked to tumor purity. Tumor purity had a significant impact on the assessment of immune infiltration in clinical tumor specimens. CCDC25 expression is positively linked to immune infiltration in LGG and PAAD, while it is negatively linked to immune infiltration in ACC, GBM, HNSC, KIRC, KIRP, LAMY, MESO, OV, STAD, TGCT, THCA, THYM, UCEC, and UCS (Figure 8). The findings suggest that CCDC25 controls the infiltration of immune cells in different types of tumors. Various forms of tumor immunotherapy have been employed for the treatment of numerous tumor varieties. The analysis of over 40 genes related to immune checkpoint was conducted in this study to investigate the relationship between CCDC25 and the expression of immune checkpoint genes. Figure 9 displays the link heatmap. The link between CCDC25 expression and immune checkpoint genes was detected in different types of tumors, including TGCT, KIRC, LGG, and THCA.
3.5 HLA, TMB, and immune neoantigen
The purpose of developing neoantigen vaccines is to regulate the response of the immune system and attain the intended therapeutic outcome. Immunization was carried out by administering vaccines formulated with altered tumor cells. The count of novel antigens in every tumor sample was established, and an analysis was performed to investigate the link between CCDC25 expression and the count of antigens. A positive link was observed between the expression of CCDC25 and the presence of immune neoantigens in THCA, STAD, READ, UCEC, BRCA, and OV (Figure 10A).
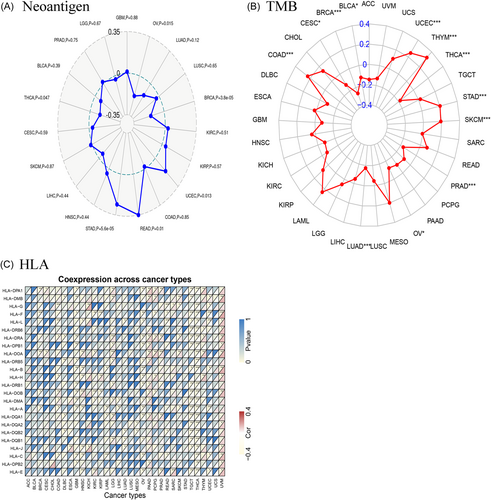
The cancer cell mutations were measured using the biomarker TMB. The TMB for each tumor sample was computed separately, and the Spearman rank link coefficient was utilized to establish the link between the expression level of CCDC25 and TMB. Figure 10B illustrates a significant link between TMB and the manifestation of CCDC25 across multiple cancer categories, such as BRCA, STAD, SKCM, COAD, SARC, HNSC, KIRC, KIRP, LAML, LGG, LUAD, and PAAD. The results demonstrated a notable link between TMB and CCDC25 expression in the majority of tumors. In multiple tumors, Figure 10C demonstrates a significant link between CCDC25 and most HLA genes.
3.6 MSI, MMRs, and DNA methyl transferases
A strong link is observed in most tumors between the expression of CCDC25 and MSI. The link between CCDC25 expression and MSI was assessed in this study using the Spearman rank correlation coefficient. Figure 11A revealed a notable link between TMB and CCDC25 expression in BLCA, BRCA, DLBC, HNSC, LUAD, LUSC, OV, READ, SARC, THCA, and UCEC. The results indicate a robust link between the expression of CCDC25 and MSI in the majority of tumors.
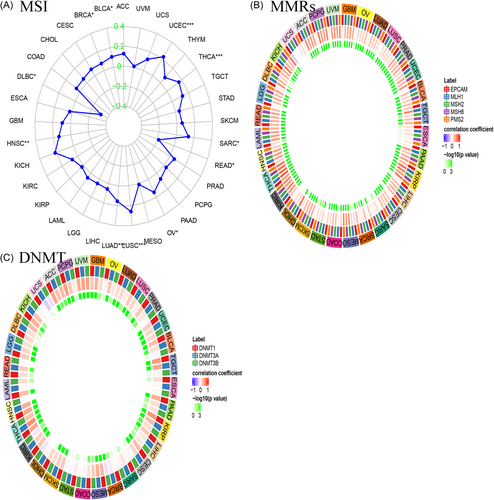
The absence of mismatch repair in certain tumors was revealed by establishing a link between intracellular mechanisms associated with mismatch repairs and MMRs. An analysis of TCGA gene expression was conducted to assess the link between the expression of MMRs (MLH1, MSH2, MSH6, PMS2, EPCAM) and CCDC25 gene expression, as depicted in Figure 11B. A positive link was found between CCDC25 expression and the five MMRs in the majority of cancer cases. This study examined the link between CCDC25 expression and four crucial DNMTs (Figure 11C). The findings indicated a significant statistical link in THCA, THYM, STAD, PRAD, LUSC, LGG, KIRP, and COAD.
3.7 GSEA analysis
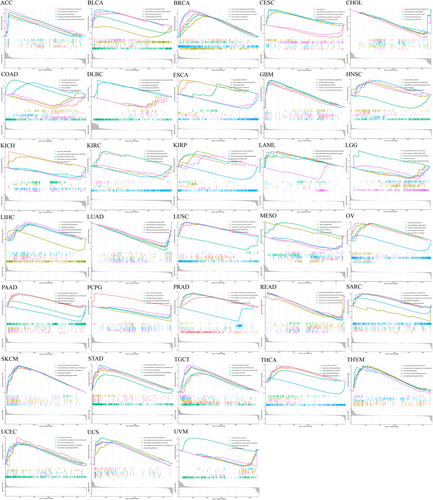
To evaluate the involvement of CCDC25 in tumors, the samples were categorized into two groups based on the CCDC25 expression levels, utilizing the median value as the threshold. Next, both sets of groups underwent KEGG pathway analysis utilizing GSEA.
Figure 12 displays the three most notably enriched pathways. The analysis of GSEA showed heightened activity in several pathways associated with cancer and the immune system among individuals with high CCDC25 expression. ACC, BLCA, GBM, LUAD, PCPG, READ, and THYM exhibited activation of the RIG-I-like receptor signaling pathway and the Toll-like receptor signaling pathway. Moreover, the control of autophagy was detected in ACC, BLCA, BRCA, CHOL, ESCA, GBM, LUAD, LUSC, and PCPG. Finally, primary immunodeficiency was found in THCA and UVM, while BRCA tumors exhibited cytotoxicity mediated by natural killer cells.
3.8 Validation of CCDC25 using immunohistochemistry
The immunohistochemical staining of CCDC25 was obtained from the HPA database. In comparison to the regular samples, the LIHC, THCA, COAD, OV, PRAD, and BRCA samples exhibited elevated protein expression levels of CCDC25 (Figure 13).
4 DISCUSSION
In the human circulatory system, neutrophils, which are the primary white blood cells (WBC), play a vital role in the initial protection against infections. Nevertheless, they can additionally promote the dissemination of cancer cells from initial locations to different regions of the organism.35-37 NET-DNA receptor CCDC25, as indicated by recent research conducted by Yang et al., plays a role in promoting the migration of cancer cells via NETs.38 The presence of CCDC25 was discovered to aid in the ingestion of cancer cells from in vitro samples of human breast cancer cells or primary breast cancer cells, leading to a noteworthy decrease in the in vitro migration of cancer cells. Furthermore, numerous investigations have documented atypical CCDC25 expression in different malignancies.17, 18, 39 Nevertheless, a thorough examination regarding the involvement of CCDC25 in tumors is still pending.
The CCDC25 gene was analyzed in various types of cancer in the TCGA data set. The expression of the gene was elevated in normal tissues such as the brain, nerves, adrenal gland, and fat. In numerous types of cancer, there was a noticeable difference in the levels of CCDC25 between malignant and normal tissues. Notably, the expression of CCDC25 showed a substantial increase in breast, lung, prostate, brain, and pancreatic malignancies. Even though numerous tumors exhibited increased CCDC25 levels, there was no link found between these levels and the outcomes of OS, DFI, PFI, or DSS. Notably, elevated levels of CCDC25 were linked to a better outlook in various types of cancer, including KIRC, ESCA, READ, and LUSC.
CCDC25 expression was significantly linked to immune infiltration, specifically neutrophil infiltration, in various tumors including MESO, LGG, and LUSC. Previous studies emphasized its participation in the NET-DNA process.38 CCDC25 expression exhibited strong links with activated memory CD4 T cells, M2 macrophages, and various other immune cells in numerous types of cancer. A strong positive relationship was noted between the expression of CCDC25 and dendritic cells, as well as M0 macrophages. Moreover, the gene exhibited a complex link with immune neoantigen, TMB, and MSI, placing special emphasis on BRCA and SKCM cancers. A compelling connection was also identified between CCDC25, MMRs, and DNMT. The importance of CCDC25 in tumor immunology is highlighted by this study.
Neutrophils, being the initial barrier against pathogens, engage in phagocytosis, degranulation, and the generation of NETs.16, 40 NETs consist of decondensed nuclear or mitochondrial DNA, which is subsequently decorated with various proteases and inflammatory mediators. The role that NETs play in tumor formation has been increasingly influenced by cancer immunoediting and the interactions between cancer cells and immune system cells. Based on the gathered information, NETs are accountable for awakening dormant cancer cells, resulting in the recurrence of tumors and uncontrolled growth and dissemination41. Furthermore, NETs play a role in the tumor microenvironment. Despite chemotherapy, NET formation can lead to tumor recurrence and spread.41 Overproduction of NETs was observed during intravascular clotting, resulting in capillary thrombosis in animal models.42, 43
5 CONCLUSIONS
Notably in gastric and breast cancers, there is a link between increased CCDC25 expression and immune infiltration, neoantigen, TMB, and MSI. The connection between CCDC25 and different types of immune cells indicates that it could be a potential target for cancer metastasis treatment. Nevertheless, further extensive clinical trials are required since the existing results solely rely on the analysis of databases.
AUTHOR CONTRIBUTIONS
Xianlin Cheng: Data curation; resources. Xinhai Yin: Supervision; validation; writing—original draft. Jukun Song: Conceptualization; formal analysis; writing—original draft.
ACKNOWLEDGMENTS
We wish to acknowledge the participants and investigators of the TCGA portal.
CONFLICT OF INTEREST STATEMENT
The authors declare no conflict of interest.
TRANSPARENCY STATEMENT
The lead author Jukun Song affirms that this manuscript is an honest, accurate, and transparent account of the study being reported; that no important aspects of the study have been omitted; and that any discrepancies from the study as planned (and, if relevant, registered) have been explained.
Open Research
DATA AVAILABILITY STATEMENT
The data that support the findings of this study are available from the corresponding author upon reasonable request. Data can be downloaded from the TCGA portal (https://www.cancer.gov/ccg/research/genome-sequencing/tcga).


