Prevalence of depression among Iranian children and adolescents: An updated systematic review and meta-analysis
Abstract
Background and Aims
One of the most common mental disorders among children and adolescent is depression. Some of the conducted studies indicate a too-high prevalence of depression, which cannot be generalized to the entire country. So the pooled estimation of the results of different studies is very important to reach valid results. So the current study aimed to determine the prevalence of depression among Iranian children and adolescents using an updated systematic review and meta-analysis.
Methods
A random-effects model was used to estimate the pooled prevalence of depression (I2 = 99.7% and Cochran's Q, p < 0.001). To assess the effect of different factors on heterogeneity, the univariate meta-regression model was used. Publication bias was evaluated by Beggs and Eggers tests as well as funnel plots. Data were analyzed by STATA v 11 (StataCorp.). The significance level of the tests was considered less than 0.05.
Results
The prevalence of depression was 33.3% (95% CI: 27.3−39.2). The most prevalence estimated using the Beak questionnaire (57.1% [95% CI: 50.2−64.0]) and the lowest was estimated using the K-SADS-PL (9.0% [95% CI: 4.0−13.6]). This estimate among females was more than among males (47.2% [95% CI: 35.4−58.9] vs. 30.5 [95% CI: 7.4−53.6]). Regarding the geographical region, the most and the lowest amount of depression was seen in the central with 41.7% (95% CI: 19.2−64.3) and southern region with 21.9% (95% CI: 14.2−29.6), respectively.
Conclusion
The high prevalence of depressive disorders in Iranian children emphasizes the importance of prevention measures for these disorders.
1 INTRODUCTION
Mental disorders are one of the serious public health challenges worldwide that affect all age groups.1 These disorders affect children's development and growth, as well as academic performance and their potential for productive and fulfilling lives.2 Evidence shows that mental disorders during childhood and adolescence affect children's future lives and cause psychiatric problems in adulthood.3
About 10%−20% of children around the world suffer from mental illnesses, and these disorders cause the loss of 15%−30% of life years due to disability.4 According to the results of a study, 13.4% of children in the world have at least one mental disorder.5 According to published statistics from the United States in 2012, 55 out of 10,000 children and adolescents were admitted to psychiatric wards.6 Other studies from Brazil and Lithuania showed that the prevalence of mental disorders among children and adolescents is about 13%.7, 8 Epidemiological studies in 2010 from 51 Asian countries indicated that the prevalence of mental disorders in children and adolescents is 10%−20%.9 The results of a meta-analysis from India estimated the rate of psychiatric disorders in children and adolescents to be 6.64%.10
One of the most common mental disorders among children and adolescent is depression. According to a recent report on the global burden of diseases, depression is recognized as the main cause of disability in the population.11, 12 Depression is among the 25 main causes of morbidity and disabilities around the world.13 Depression has different symptoms, including feelings of sadness, loneliness, lack of interest in doing activities, poor academic performance, low self-confidence, dropping out of school, and so forth.14, 15 It is important to estimate the prevalence of mental illnesses in children and adolescents to create mental health policies. For this purpose, using epidemiological studies is one of the most important approaches to estimating the prevalence of these disorders.3
In Iran, as in other developing countries, several studies have been conducted on the prevalence of mental disorders, especially depression, in different cities, but the results obtained from each study are very different and cannot be generalized to the entire country due to several factors such as different sample sizes, different sampling methods, as well as different precision. For example, some of the conducted studies indicate a too high prevalence of depression, which cannot be generalized to the entire country because some factors such as understudied groups, sampling approach, and use of questionnaires can affect on results' generalizability.16 The prevalence of depression in Kazerun using the Zong questionnaire was 42%,17 in Rasht using the DASS-21 earned 6%,18 in Khorasan Razavi using the the 21-item BDI was 32%,19 and in Isfahan using the CDI questionnaire was reported 22%.20 So the pooled estimation of the results of different studies is very important to reach valid results. So the current study aimed to determine the prevalence of depression among Iranian children and adolescents using an updated systematic review and meta-analysis.
2 MATERIALS AND METHODS
The current systematic review and meta-analysis were conducted based on the preferred reporting cases for systematics reviews and meta-analyses (PRISMA) guidelines21 and Meta-Analysis of Observational Studies in Epidemiology (MOOSE) protocol.22 The search strategy and assessment of eligibility criteria were performed independently by at least two authors.
2.1 Search strategy
This systematic review and meta-analysis were performed to estimate the pooled prevalence of depression among Iranian children and adolescents from the original studies published in international electronic databases including PubMed, Scopus, Science Direct, and Google Scholar. The mentioned databases were searched to retrieve eligible studies that estimate the prevalence of depression among Iranian children and adolescents. The used keywords include: “epidemiology” OR “prevalence” AND “depressive disorder” OR “depressive” OR “depression” AND “Iranian” AND “child” OR “children” OR “Iranian children”.
2.2 Inclusion and exclusion criteria
Inclusion criteria include original cross-sectional research in Iran which estimated the prevalence of depression among Iranian children and adolescents (6−18 years) from January 1990 to December 2022. Review articles, case reports, cohorts, case series, and letters to the editor were excluded.
2.3 Qualitative evaluation
To assess the quality of included studies A modified version of the Newcastle−Ottawa scale for cross-sectional studies which was developed by Wells et al., in 2004 was used.23 The mentioned checklist contains five questions and the range of scores is between 0 and 10. Based on the scores obtained, the studies can be in one of four groups: unsatisfactory (less than 5 stars), satisfactory (5−6 stars), good (7−8 stars), and very good (9−10 stars). Two researchers separately assessed the quality of the studies and differences were referred to a third person.
2.4 Data extraction
The required data which includes, first author name, study year, sample size, city, age group, type of instrument, and prevalence of depression were extracted from each included study.
2.5 Statistical analysis
The heterogeneity was assessed using Cochran's Q test, T2, and I2 statistics with values >75%. Due to the presence of heterogeneity between studies, a random-effects model was used to estimate the pooled prevalence of depression (I2 = 99.7% and Cochran's Q, p < 0.001). To assess the effect of different factors on heterogeneity, the univariate meta-regression model was used. Publication bias was evaluated by Beggs and Eggers tests as well as funnel plots. Data were analyzed by STATA v 11 (StataCorp.). The significance level of the tests was considered less than 0.05.
2.6 Ethical considerations
Since the present study is a systematic review, ethical considerations are not applicable.
3 RESULTS
3.1 Study selection process
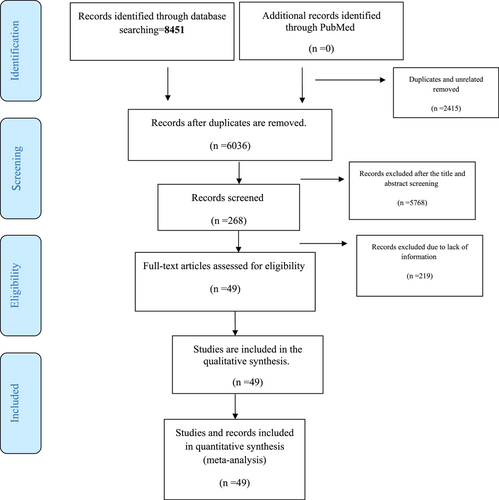
Based on the initial search results, 8451 articles were found. Out of this number, 2415 items were removed due to being repetitive. Among the remaining 6036 articles, 5768 articles were removed after screening based on abstract and title. Among the remaining 268 articles, 219 articles were excluded due to a lack of required data, and finally, 49 related records were included in the final analysis (Table 1). Figure 1 shows the PRISMA flow diagram for included studies in the current meta-analysis. All of the included studies were performed in 6−18 years children and adolescents. The total sample size of included studies was 99,089 cases. Twenty-one records had ≤500 cases and the sample size in 28 records was more than 500 cases. Among the included studies, 14 and three studies determined the prevalence of depression in females and males, respectively and 32 records did not consider sex subgroups. Forty-one study performed before 2020, and eight studies were published this year.
| First author | Year | City | Population | Design | Age group | Sample size | Quality score |
|---|---|---|---|---|---|---|---|
| Noorbala A24 | 1996 | Tehran | High-school | Cross-sectional | 6−18 | 1478 | 8 |
| Narimani M25 | 1998 | Ardebil | High-school | Cross-sectional | 6−18 | 127 | 7 |
| Abdolahiyan E26 | 1999 | Mashhad | Elementary school | Cross-sectional | 6−18 | 2071 | 6 |
| Shoja'ei-Zadeh D17 | 2001 | Fars | High-school | Cross-sectional | 6−18 | 240 | 6 |
| Zargham A27 | 2001 | Isfahan | High-school | Cross-sectional | 6−18 | 323 | 7 |
| Hosseinifard M28 | 2002 | Kerman | High-school | Cross-sectional | 6−18 | 830 | 7 |
| Monirpour N29 | 2005 | Tehran | High-school | Cross-sectional | 6−18 | 388 | 7 |
| Montazeri M30 | 2013 | Isfahan | Guidance school | Cross-sectional | 6−18 | 250 | 7 |
| Rajabi G31 | 2004 | Khuzestan | High-school | Cross-sectional | 6−18 | 400 | 7 |
| Soltanifar M32 | 2007 | Tehran | Elementary school | Cross-sectional | 6−18 | 1054 | 7 |
| Jenaabadi H33 | 2010 | Sistan and Baluchistan | High-school | Cross-sectional | 6−18 | 125 | 6 |
| Mogharab M34 | 2011 | South Khorasan | High-school | Cross-sectional | 6−18 | 450 | 7 |
| Shahnazi M35 | 2008 | East Azerbaijan | Unclassified | Cross-sectional | 6−18 | 364 | 8 |
| Turi A36 | 2015 | South Khorasan | High-school | Cross-sectional | 6−18 | 400 | 8 |
| Shakibaei F20 | 2014 | Isfahan | Guidance school | Cross-sectional | 6−18 | 1606 | 7 |
| Partoazam H37 | 2009 | West Azerbaijan | High-school | Cross-sectional | 6−18 | 216 | 9 |
| Rostamzade Z38 | 2007 | West Azerbaijan | High-school | Cross-sectional | 6−18 | 3023 | 7 |
| Kordi M39 | 2015 | Khorasan-e Razavi | High-school | Cross-sectional | 6−18 | 407 | 7 |
| Ahangar K40 | 2012 | Tehran | Guidance school | Cross-sectional | 6−18 | 103 | 7 |
| Sadeghian E41 | 2010 | Hamadan | High-school | Cross-sectional | 6−18 | 600 | 8 |
| Habibpour Z42 | 2009 | Isfahan | High-school | Cross-sectional | 6−18 | 400 | 7 |
| Sooky Z43 | 2010 | Isfahan | High-school | Cross-sectional | 6−18 | 762 | 8 |
| Shams G44 | 2011 | Yazd | High-school | Cross-sectional | 6−18 | 909 | 7 |
| Riahi F45 | 2017 | Lorestan | High-school | Cross-sectional | 6−18 | 600 | 8 |
| Shabani Z46 | 2017 | Ilam | High-school | Cross-sectional | 6−18 | 340 | 8 |
| Nooraliey47 | 2015 | Hamadan | High-school | Cross-sectional | 6−18 | 400 | 8 |
| Ghorbanibirgani A48 | 2014 | Khuzestan | Guidance school | Cross-sectional | 6−18 | 1000 | 7 |
| Bakhteyar K49 | 2018 | Lorestan | High-school | Cross-sectional | 6−18 | 1202 | 8 |
| Shakibaei F50 | 2018 | Isfahan | Guidance school | Cross-sectional | 6−18 | 706 | 7 |
| Javadi M51 | 2017 | Qazvin | High-school | Cross-sectional | 6−18 | 1040 | 8 |
| Shivappa N52 | 2016 | Tehran | High-school | Cross-sectional | 6−18 | 300 | 8 |
| Pirdehghan A53 | 2016 | Yazd | Guidance school | Cross-sectional | 6−18 | 700 | 8 |
| Servatyari K54 | 2019 | Kurdistan | High-school | Cross-sectional | 6−18 | 370 | 7 |
| Shaikhahmadi S55 | 2016 | Kurdistan | High-school | Cross-sectional | 6−18 | 595 | 7 |
| Riahi F3 | 2022 | Khuzestan | Unclassified | Cross-sectional | 6−18 | 1028 | 7 |
| Nazari H56 | 2022 | Lorestan | Unclassified | Cross-sectional | 6−18 | 1001 | 7 |
| Salmanian M57 | 2020 | all provinces of Iran | Unclassified | Cross-sectional | 6−18 | 30532 | 9 |
| Mohammadi MR58 | 2016 | Tehran, Shiraz, Isfahan, Tabriz, and Mashhad | Unclassified | Cross-sectional | 6−18 | 2051 | 8 |
| Mohammadi MR58 | 2016 | Tehran, Shiraz, Isfahan, Tabriz, and Mashhad | Unclassified | Cross-sectional | 6−18 | 1067 | 8 |
| Mohammadi MR58 | 2016 | Tehran, Shiraz, Isfahan, Tabriz, and Mashhad | Unclassified | Cross-sectional | 6−18 | 984 | 8 |
| Ahmadpanah M59 | 2018 | Hamadan | Unclassified | Cross-sectional | 6−18 | 1025 | 7 |
| Talepasand S60 | 2019 | Semnan | Unclassified | Cross-sectional | 6−18 | 1037 | 7 |
| Khaleghi A61 | 2018 | Tehran | Unclassified | Cross-sectional | 6−18 | 2095 | 6 |
| Alavi S62 | 2021 | All provinces of Iran | Unclassified | Cross-sectional | 6−18 | 30553 | 7 |
| Safavi P63 | 2019 | Chaharmahal and Bakhtiari | Unclassified | Cross-sectional | 6−18 | 1038 | 7 |
| Mohammadi MR64 | 2022 | All provinces of Iran | Unclassified | Cross-sectional | 6−18 | 356 | 8 |
| Amirian H16 | 2022 | Kermanshah | Unclassified | Cross-sectional | 6−18 | 993 | 7 |
| Sangouni AA19 | 2022 | Khorasan-e Razavi | Unclassified | Cross-sectional | 6−18 | 933 | 8 |
| Abdollahi E18 | 2022 | Rasht | Unclassified | Cross-sectional | 6−18 | 617 | 7 |
3.2 Prevalence of depression
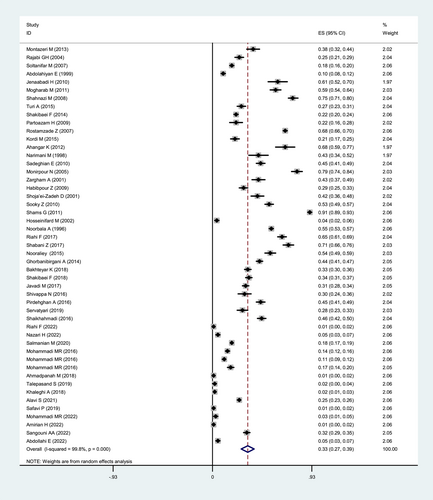
The prevalence of depression in Iranian children and adolescents was 33.3% (95% CI: 27.3−39.2) (Figure 2). The most prevalence estimated using the Beak questionnaire (57.1% [95% CI: 50.2−64.0]) and the lowest was estimated using the K-SADS-PL (9.0 [95% CI: 4.0−13.6]). The prevalence of depression among females was more than among males (47.2% [95% CI: 35.4−58.9] vs. 30.5 [95% CI: 7.4−53.6]). Regarding the geographical region, the most and the lowest amount of depression was seen in the central with 41.7% (95% CI: 19.2−64.3) and southern region with 21.9% (95% CI: 14.2−29.6), respectively. The prevalence of depression in studies published before 2020 was more than in studies published after 2020 (37.6% [95% CI: 30.7−44.4] vs. 9.5% [95% CI: 2.3−16.7]). Also, this prevalence in studies with less sample size was higher than the studies with more sample size (Table 2).
| Variables | Number of studies or records | Sample size | Estimation (95% CI) | Q | I2 | T2 |
|---|---|---|---|---|---|---|
| Tool | ||||||
| CDI | 3 | 3525 | 17.7 (10.0−25.5) | <0.001 | 99.1 | 0.0045 |
| DASS | 5 | 2194 | 27.7 (11.3−44.1) | <0.001 | 99.0 | 0.0347 |
| Beak | 12 | 8489 | 57.1 (50.2−64.0) | <0.001 | 97.6 | 0.0143 |
| DSM | 2 | 1734 | 18.1 (1.0−51) | <0.001 | 99.7 | 0.0922 |
| K-SADS-PL | 13 | 73,772 | 9.0 (4.0−13.6) | <0.001 | 99.4 | 0.0065 |
| SCL | 3 | 1955 | 36.6 (2.0−71.3) | <0.001 | 99.7 | 0.0922 |
| ZUNG | 3 | 856 | 31.6 (20.7−42.6) | <0.001 | 91.7 | 0.0086 |
| Other | 8 | 6546 | 47.9 (26.6−69.1) | <0.001 | 99.7 | 0.0938 |
| Sex | ||||||
| Female | 14 | 9506 | 47.2 (35.4−58.9) | <0.001 | 99.8 | 0.0494 |
| Male | 3 | 1557 | 30.5 (7.4−53.6) | <0.001 | 98.7 | 0.0410 |
| Both sex | 32 | 88,026 | 27.4 (22.1−32.7) | <0.001 | 99.8 | 0.0224 |
| Publication year | ||||||
| Before 2020 | 41 | 37.6 (30.7−44.4) | <0.001 | 99.8 | 0.0494 | |
| After 2020 | 8 | 9.5 (2.3−16.7) | <0.001 | 99.7 | 0.0095 | |
| Geographical location | ||||||
| Central | 8 | 9469 | 44.8 (23.1−66.4) | <0.001 | 99.9 | 0.14 |
| South | 7 | 4421 | 25.2 (16.3−34.1) | <0.001 | 99.6 | 0.008 |
| North | 18 | 12,530 | 36.3 (24.1−48.6) | <0.001 | 99.8 | 0.07 |
| West | 10 | 7126 | 35.1 (24.0−46.3) | <0.001 | 99.7 | 0.03 |
| National | 6 | 65,543 | 14.7 (9.2−20.2) | <0.001 | 98.4 | 0.003 |
| Sample size | ||||||
| ≤500 | 21 | 8010 | 40.6 (30.1−51.1) | <0.001 | 99.3 | 0.05 |
| >500 | 28 | 91,079 | 27.9 (21.4−34.5) | <0.001 | 99.9 | 0.05 |
| Overall | 49 | 99,089 | 33.3 (27.3−39.2) | <0.001 | 99.8 | 0.03 |
3.3 Sensitivity analysis and meta-regression
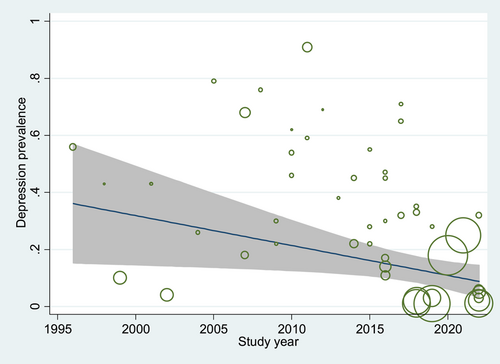
According to sensitivity analysis results, the pooled estimation was not affected by any study. The effect of instrument type, study year, sample size, gender, and study location was assessed on pooled estimation. According to a simple meta-regression analysis, the effect of gender on pooled estimation was statistically significant (p:0.01) (Table 3). Figure 3 showed the estimated depression prevalence according to the study year. Considering this figure the prevalence of depression among children and adolescents showed a decreasing trend over time.
| Factors | Coefficient | Standard error | t | p > t | 95% confidence interval | |
|---|---|---|---|---|---|---|
| Instrument | 0.01 | 0.02 | 0.38 | 0.71 | −0.03 | 0.04 |
| Year | −0.01 | 0.01 | −1.95 | 0.06 | −0.02 | 0.00 |
| Sample size | 0.00 | 0.00 | 0.34 | 0.73 | 0.00 | 0.00 |
| Gender | −0.10 | 0.04 | −2.59 | 0.01 | −0.17 | −0.02 |
| Region | −0.03 | 0.03 | −0.95 | 0.35 | −0.09 | 0.03 |
| _cons | 21.25 | 10.60 | 2.00 | 0.05 | −0.13 | 42.63 |
3.4 Publication bias
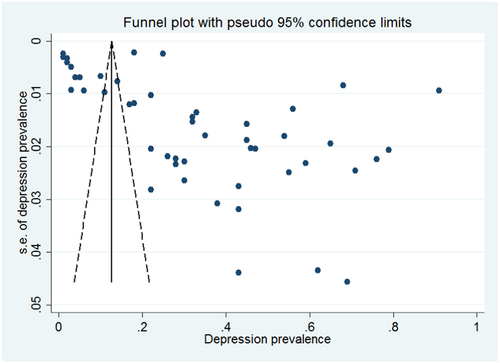
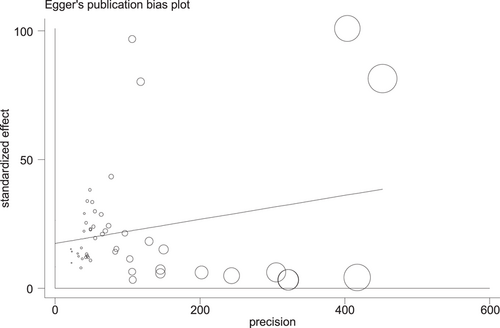
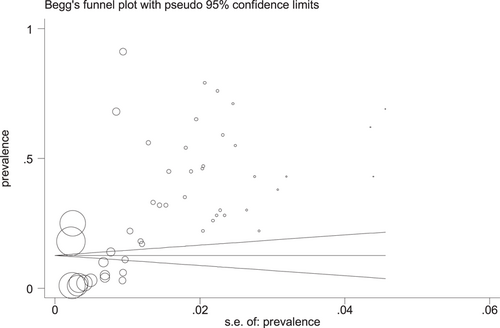
According to the results of the funnel plot and Egger's (p = 0.001) and Begg's (p = 0.001) tests, there was a significant publication bias on the results (Figures 4-6).
4 DISCUSSION
Depression is one of the most prevalent mental health disorders among people, especially in children and adolescents.65 Determining the point prevalence in populations can provide very useful information for planning and developing prevention measures. Point prevalence is the proportion of the population with a disease or a specific outcome at a specific point in time.66 So due to the importance of the subject, the current study aimed to determine the point prevalence of depression in Iranian children and adolescents in a systematic review and meta-analysis study.
Our results showed that the prevalence of depression in Iranian children and adolescents was 33.4% (95% CI: 28.2−38.6). The most prevalence estimated using the Beak questionnaire (57.1% [95% CI: 50.2−64.0]) and the lowest was estimated using the K-SADS-PL (9.0% [95% CI: 4.0−13.6]). The prevalence of depression among females was more than among males (47.2% [95% CI: 35.4−58.9] vs. 30.5 (95% CI: 7.4−53.6]). Regarding the geographical region, the most and the lowest amount of depression was seen in the central with 41.7% (95% CI: 19.2−64.3) and southern region with 21.9 (95% CI: 14.2−29.6), respectively.
Our results showed that the prevalence of depression in Iranian children and adolescents was 33.4%. A systematic review study that was conducted using 10 studies in Australia and on 7650 participants between 10 and 24 years of age showed a 21.3% prevalence of depression in this country.1 Another study in China showed that 13.06% of primary and high school students experienced depressive symptoms.67 The prevalence of depression signs among adolescents in 26 low- and middle-income countries was 5.5%.68 Studies from other developing countries, especially in the Middle East, have reported different numbers for the prevalence of depression in children and adolescents, for example, the prevalence of these disorders in Saudi Arabia is 42.9% 69 in Qatar 34.5%,70 Turkey 26.6%, Egypt 15.3%, United Arab Emirates 17.5%, Iraq 35%, and Lebanon 26.6%.71-73 While the prevalence of these disorders in more developed countries such as Denmark (10%), China (9.5%), Brazil, and Norway (7%) was much lower.74, 75 Estimates of the prevalence of depression are different between different studies and in different countries, and this difference can be caused by the use of different measurement tools, different sample sizes, or different methodological approaches in measuring depression.76
Different studies used different tools to assess the presence of depression among children and adolescents. The estimated depression using different tools was not the same. Our results showed that the most prevalence of depression was estimated using the Beak questionnaire (57.1%) and the lowest was estimated using the K-SADS-PL (9.0%). This result is consistent with previous studies.77 The reason for the difference in the results obtained from different questionnaires or tools can be due to the different structures of the tools, different criteria of the tools to define depression, and also different cut points to determine these disorders. The validity and diagnostic value of depression screening tools can be different due to different factors such as the number of questions, the number of dimensions, and the time required to fill out the questionnaire. For example, shorter questionnaires that require less time to answer than longer questionnaires may provide different results in the same population.
Regarding the geographical region, the most and the lowest amount of depression was seen in the central with 41.7% (95% CI: 19.2−64.3) and southern region with 21.9%(95% CI: 14.2−29.6), respectively. The difference in the prevalence of depression in different regions was seen in previous studies.13, 78 An explanation for the difference is ethnicity and different coverage or access to mental health facilities in different regions.79 About the role of ethnicity, it can be mentioned that due to the existence of special traditions and customs in some ethnicities, the scope of people's activity is less and this creates suitable conditions for the occurrence of depression. Also, in the assessment of the distribution of psychiatrists and treatment centers, it can be found that the majority of facilities related to mental health are concentrated in the north of Iran, such as Tehran, and this unequal distribution can affect the prevalence and incidence of these disorders. Another point that can be one of the main factors in creating a difference in the prevalence of mental disorders in different regions is economic and social status so that based on the studies, these disorders are more common in less developed regions or poor economic status than other regions.80-82 In general, many health and treatment facilities can be seen in more developed areas, and the presence of these facilities makes it easier for people to access them. On the other hand, families living in more prosperous and developed areas mostly have higher education, which affects the interaction of families with their children and adolescents which can have an important role in the occurrence of mental disorders in children and adolescents.
According to our results, the prevalence of depression among females was more than among males (47.2% [95% CI: 35.4−58.9] vs. 30.5 [95% CI: 7.4−53.6]). This finding is similar to previous studies.83, 84 The reason for the higher prevalence of mental disorders in girls is not well known.85 But part of this difference can be caused by boys' concealment of mental problems and not expressing them so that girls express the problem, while this issue does not apply to boys.86 Also, the role of physiological and biological factors should not be ignored, because girls are usually more sensitive than boys and are more affected by surrounding events.85, 87 Previous studies indicate significant gender differences in depression-related gene expression in men and women, which may be the reason for the disparity in the prevalence and pathobiology of the disease between men and women.88 Also, Hormonal factors are among the most effective factors in the occurrence of mental disorders in women. Considering that the peak onset of depression disorders in women coincides with their reproductive years, hormonal risk factors may play an important role in depression. Estrogen and progesterone have been shown to affect the neurotransmitter, neuroendocrine, and circadian systems involved in mood disorders. It is a fact that women may experience mood disorders associated with the menstrual cycle, such as premenstrual dysphoric disorder (PMDD). PMDD refers to a mood disorder that occurs before the menstrual cycle and is characterized by symptoms of depression and moodiness and refers to the relationship between female sex hormones and psychological disorders.89-91
Our results showed that the prevalence of depression in studies published before 2020 and a sample size of less than 500 was more than in the studies published after 2020 and a sample size of more than 500 cases. This difference can be due to the different quality of the studies, such as the different sample sizes and the way the samples were selected. For example, the selection bias in studies with few sample sizes can affect results and lead to overestimation in the determined prevalence.
4.1 Limitations of the study
The current study had some limitations which include the presence of significant heterogeneity between different studies. In general, different studies were conducted in different populations with different cultural characteristics, and this variation can affect the pooled estimate. Also, the use of different tools to measure the prevalence of depression by different studies was another important factor that should not be ignored. Also, the lack of information about the severity of depression in many studies was another limitation of the current study. The lack of separation between adolescents and children in primary studies was one of the other limitations of the present study.
5 CONCLUSION
The results of the present study indicated a high prevalence of depression in Iranian children and adolescents (33%). Also, the prevalence of depression among girls was higher than that of boys (47.2% vs. 30.5%). The high prevalence of depressive disorders in children emphasizes the importance of prevention measures for these disorders. Therefore, health policymakers should pay special attention to the implementation of prevention programs such as education for children and their parents to improve their level of mental health as well as empower them to deal with critical situations.
AUTHOR CONTRIBUTIONS
Maedeh Bazargan: Conceptualization; data curation; formal analysis; investigation; methodology; project administration; supervision; validation; visualization; writing—original draft; writing—review and editing. Akram Dehghani: Data curation; investigation; methodology; project administration; validation; visualization; writing—original draft; writing—review and editing. Mohammad Arash Ramezani: Data curation; investigation; methodology; project administration; validation; visualization; writing—original draft; writing—review and editing. Alireza Ramezani: Data curation; investigation; methodology; project administration; validation; visualization; writing—original draft; writing—review and editing.
CONFLICT OF INTEREST STATEMENT
The authors declare no conflict of interest.
TRANSPARENCY STATEMENT
The lead author Maedeh Bazargan affirms that this manuscript is an honest, accurate, and transparent account of the study being reported; that no important aspects of the study have been omitted; and that any discrepancies from the study as planned (and, if relevant, registered) have been explained.
Open Research
DATA AVAILABILITY STATEMENT
All data relevant to the study are included in the article.


