Treatment on the Spleen Prevents the Progression of Secondary Sarcopenia in Patients With Liver Cirrhosis
Abstract
Hyperammonemia is an important stimulator of myostatin expression, a negative regulator of muscle growth. After splenectomy or partial splenic artery embolization (PSE), hyperammonemia often improves. Thus, we investigated changes in skeletal muscle index (SMI) in patients following an operation on the spleen and in patients who did not undergo an operation on their spleen. The study was designed retrospectively, in which we analyzed data collected between January 2000 and December 2015. Patients were assigned to the splenectomy/PSE or nontreatment group. Changes in SMI (ΔSMI), ammonia (Δammonia), myostatin (Δmyostatin), irisin (Δirisin), and branched-chain amino acids/tyrosine molar ratio (ΔBTR) were analyzed between baseline and 5-year follow-up both before and after inverse probability of treatment weighting adjustment (IPTW). Patients (102) were enrolled (splenectomy/PSE, n = 45; nontreatment group, n = 57) before IPTW adjustment: ΔSMI (2.6 cm2/m2 vs. −8.8 cm2/m2, respectively) (P < 0.001), Δmyostatin (−867 vs. −568, respectively) (P < 0.001), Δammonia (−34 and 16, respectively) (P < 0.001), and ΔBTR (0.89 and −0.665, respectively) (P < 0.001). There were no differences between splenectomy and PSE regarding these factors. Moreover, after IPTW adjustment, significant differences were observed between the splenectomy/PSE and nontreatment group for the median ΔBTR (0.89 and −0.64, respectively) (P < 0.001), Δammonia (−33 and 16, respectively) (P < 0.001), Δmyostatin (−894 and 504, respectively) (P < 0.001), and ΔSMI (1.8 cm2/m2 and −8.2 cm2/m2, respectively) (P < 0.001). Conclusions: Both splenectomy and PSE were associated with the prevention of secondary sarcopenia in patients with LC. Moreover, it can be expected that muscle volume loss is reduced by splenectomy or PSE in patients with hyperammonemia.
Abbreviations
-
- BCAA
-
- branched-chain amino acid
-
- BTR
-
- branched-chain amino acids/tyrosine molar ratio
-
- CI
-
- confidence interval
-
- CT
-
- computed tomography
-
- FIB-4
-
- Fibrosis 4 index
-
- HBsAg
-
- hepatitis B surface antigen
-
- HCV
-
- hepatitis C virus
-
- IPTW
-
- inverse probability of treatment weighting adjustment
-
- LC
-
- liver cirrhosis
-
- MELD
-
- Model for End-Stage Liver Disease
-
- PS
-
- propensity score
-
- PSE
-
- partial splenic arterial embolization
-
- SMA
-
- skeletal muscle area
-
- SMI
-
- skeletal muscle index
-
- SMV
-
- skeletal muscle volume
Sarcopenia is characterized by a loss of skeletal muscle mass and has previously been associated with poor quality of life and prognosis(1) and is a common complication of liver cirrhosis (LC).(2, 3) Associations between skeletal muscle mass and LC complications have been linked with impaired metabolic and contractile function of skeletal muscles, commonly observed in sarcopenia.(4) Although the etiology linking LC and loss in skeletal muscle mass is likely to be multifaceted, the starvation state associated with cirrhosis is likely to impair protein synthesis and accelerate proteolysis.(5) The catabolic states commonly observed in patients with LC are likely to enhance the demand for amino acids for energy, primarily from skeletal muscle, which is likely to contribute to sarcopenia.
Alternatively, recent data have indicated that hyperammonemia may cause sarcopenia(6) and can transcriptionally up-regulate myostatin expression through a nuclear factor kappa B–mediated mechanism and decrease α-ketoglutarate by cataplerosis.(4, 5, 7, 8) Hyperammonemia has also been shown to increase myostatin, a negative regulator of muscle growth, and may be an additional mechanism contributing to sarcopenia in patients with LC.(4, 5, 7, 8) Currently, nonabsorbed disaccharides (e.g., lactulose, lactitol) and nonabsorbable antibiotics (e.g., neomycin, rifaximin) are the primary treatments for hepatic encephalopathy.(9) There is a possibility that a reduction in hyperammonemia occurs following splenectomy or partial splenic arterial embolization (PSE) by eliminating splenic blood flow, normalizing vasoactive agents, and obliterating portosystemic shunt.(10-12) If hyperammonemia is improved after splenectomy/PSE, skeletal muscle volume (SMV) may be maintained. Moreover, irisin is a cytokine produced by muscles after physical exercise. An increase in oxygen consumption, loss of body mass, improved glucose tolerance, and decrease in insulin secretion are the result of irisin activity. If the SMV was maintained after splenectomy or PSE, irisin might be elevated.(13) In this study, we investigated changes in SMV in patients following an operation on the spleen and in patients who did not undergo operation on their spleen.
Patients and Methods
Patients
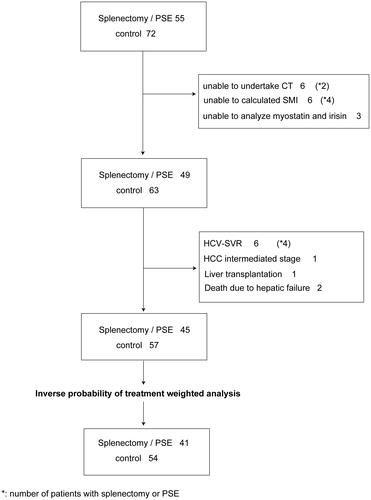
This was a retrospective study design in which we analyzed data collected between January 2000 and December 2015. The study protocols were approved by the institutional ethics committee. The study protocol conformed to the ethical guidelines of the 1975 Declaration of Helsinki. Informed consent in writing was provided by all patients before the splenectomy, PSE, or computed tomography (CT). In the splenectomy/PSE group, consent for treating spleen and CT were acquired. In the control group, consent for CT was acquired. Additional consent for inclusion in the current study was not required. At the time of enrollment and 5-year follow-up (acceptable up to 5 years and 11 months), skeletal muscle index (SMI) was measured by CT on at least two occasions to ensure consistency of measurements. Inclusion criteria were as follows. For patients in whom a liver biopsy to confirm LC was not appropriate, the following criteria were used as alternatives: collateral vessels, splenomegaly, platelet counts <10 × 104 cells/μL, and/or Fibrosis-4 index (FIB-4) < 4.0. The indication of splenectomy/PSE is shown as follows: (1) untreatable gastric varices by balloon-occluded retrograde transvenous obliteration (n = 3), (2) refractory esophageal varices after endoscopic treatment (n = 3), (3) bleeding tendency caused by thrombocytopenia (n = 8), and (4) interferon treatment for hepatitis C with thrombocytopenia (n = 31). Patients undergoing spleen surgery were provided with full details relating to the splenectomy and PSE, in addition to any complications and potential benefits of the surgery. The choice of splenectomy, PSE, or conservation was the patient’s decision. Patients were assigned to the splenectomy/PSE or nontreatment group. All patients with Child-Pugh class A or B were consecutively enrolled for the study period in our hospital. In the control group, 24 patients were treated by splenectomy, and 21 patients were treated by PSE. Branched-chain amino acids (BCAAs) were administered to patients with hypoalbuminemia (less than 3.5 g/dL). Exclusion criteria were as follows: sustained virological response achieved by direct-acting antivirals throughout the study (n = 6), occurrence of intermediate or advanced hepatocellular carcinoma (n = 1), not being suitable or able to undertake the CT scan at baseline or the 5-year follow-up due to death (n = 1), and liver transplantation performed during this study (n = 2) (Fig. 1). All patients received treatment with lactulose in the splenectomy/PSE group.
Evaluation of Muscle Area, Myostatin, and Irisin
The total muscle area at the middle of the third lumbar vertebra (cm2/height [m2]) calculated from the CT scans was calculated from the CT scans by an experienced technician using the workstation software (VINCENT; Fuji Film, Tokyo, Japan) and defined as the skeletal muscle area (SMA). SMI was defined as the SMA (cm2/m2).(14) Muscle areas analyzed included the psoas, erector spinae, quadratus lumborum, transversus abdominis, external and internal obliques, and rectus abdominis. Serum myostatin (R&D Systems, Minneapolis, MN) was measured using commercially available kits. Serum irisin was also measured by commercially available kits (Phoenix Pharmaceuticals, Inc., Burlingame, CA). Patients were instructed to fast overnight (>8 hours), and a blood sample was collected at the same time of day at baseline and at the 5-year follow-up.
Statistical Analyses
All statistical analyses were performed using STATA version 15 (StataCorp LLC, College Station, TX). Qualitative data are expressed as means (±SD), and quantitative data are expressed as medians with first and third quartiles. Clinical characteristics between the splenectomy/PSE and the nontreatment group were compared using the Mann-Whitney U test. Percentages were compared using the chi-squared test or Fisher’s exact test, as appropriate. To reduce bias between the splenectomy/PSE and nontreatment group, inverse probability of treatment weighting adjustment (IPTW) was performed. The propensity score (PS) was estimated by modeling the probability of receiving one of the procedures for the spleen. To determine the probability of receiving a procedure on the spleen, a multivariable logistic model was constructed with the following covariates: age, sex, etiology, platelet count, albumin, prothrombin time (PT), and total bilirubin. This logistic model allowed a PS to be calculated for each patient. In the IPTW adjustment, weights for the splenectomy/PSE group were the inverse of the PS, and weights for patients in the nontreatment group were the inverse of (1  PS). The IPTW adjusted values were incorporated into a weighted Pearson product-moment correlation coefficient analysis to evaluate the relationship between the change in ammonia compared with changes in myostatin, irisin, or SMI. Stabilized IPTWs were calculated to reduce the variability and ensure unbiased estimation of the treatment effect. To evaluate the difference between with and without a procedure for the spleen, the Mann-Whitney U test was performed before and after weighting. Moreover, to predict the significant factors for the increase of SMI, a multivariable logistic model was constructed with the following covariates: age, sex, etiology, treatment FIB-4 index, Model for End-Stage Liver Disease (MELD) score, BCAA supplementation, liver volume, and spleen volume.
Results
Clinical Characteristics of the Patients With and Without Splenectomy Procedure
The patients’ baseline characteristics are presented in Table 1. The mean data of the splenectomy/PSE and nontreatment groups were comparable with regard to sex, age, etiology, platelet count, albumin, PT, total bilirubin, ammonia, branched-chain amino acids/tyrosine molar ratio (BTR), and SMI. The median age was significantly higher in the nontreatment group (P < 0.001). Albumin, PT, and BTR were significantly higher in the nontreatment group (P < 0.001), but ammonia and spleen volume were higher in the splenectomy/PSE group. The rate of patients without hepatitis B surface antigen (HBsAg) and anti–hepatitis C virus (HCV) was significantly higher in the nontreatment group (P = 0.021). Myostatin was correlated with ammonia (R2, 0.122; P = 0.006) and inversely associated with BTR (R2, 0.096; P = 0.017). Irisin was inversely associated with ammonia (R2, 0.06; P = 0.049) at baseline. Other factors were not significantly associated with myostatin or irisin. The number of patients with BCAA medicated in the splenectomy/PSE group was significantly high (29 vs. 17, P < 0.001). Of the patients without BCAA intake at baseline, 8 patients (4 patients in the splenectomy/PSE group and 4 patients in the control group) were administered BCAAs. After weighting, there were no significant differences between the two groups.
| Before Weighting | After Weighting | |||||
|---|---|---|---|---|---|---|
| Spleen Group | Control Group | P Value | Spleen Group | Control Group | P Value | |
| Age (years) | 62 (58-66) | 66 (62-72) | <0.001* | 62 (59-67) | 64 (60-70) | 0.220 |
| Male : Female | 22:23 | 36:21 | 0.164 | 25:16 | 32:22 | 0.832 |
| Height (m) | 1.6 (1.5-1.7) | 1.6 (1.5-1.7) | 0.989 | 1.6 (1.5-1.7) | 1.6 (1.5-1.7) | 0.189 |
| Weight (kg) | 59.5 (52.3-67.4) | 60.0 (53.2-66.3) | 0.751 | 64.0 (53.3-67.5) | 61.1 (53.0-67.0) | 0.827 |
| HBV : HCV : NBNC | 5:36:4 | 4:35:18 | 0.021* | 2:27:11 | 8:27:20 | 0.225 |
| Albumin (g/dL) | 3.3 (3.0-3.7) | 3.7 (3.5-4.2) | <0.001* | 3.6 (3.2-3.9) | 3.6 (3.3-4.0) | 0.432 |
| PT (%) | 72.4 (66.8-83.8) | 84.9 (77.6-102.6) | <0.001* | 72.2 (67.2-86.8) | 83.2 (72.4-89.9) | 0.066 |
| T. Bil (mg/dL) | 1.0 (0.8-1.5) | 0.9 (0.6-1.2) | 0.063 | 1.1 (0.8-1.9) | 0.9 (0.7-1.5) | 0.188 |
| Child-Pugh (A : B) | 31:14 | 53:4 | 0.003* | 29:12 | 43:11 | 0.336 |
| MELD score | 4.5 (0.9–7.5) | 3.4 (0.9-6.2) | 0.266 | 4.9 (1.0-7.7) | 4.0 (0.8-8.3) | 0.764 |
| NH3 (mg/dL) | 67 (53-87) | 36 (32-46) | <0.001* | 68 (53-87) | 44 (34-68) | 0.001* |
| BTR | 3.31 (2.47-3.99) | 4.53 (3.63-6.03) | <0.001* | 3.49 (2.35-4.01) | 3.83 (3.01-5.70) | 0.014* |
| Spleen volume (mL) | 394 (258-498) | 282 (178-389) | 0.002* | 384 (282-540) | 311 (199-398) | 0.033* |
| Myostatin (pg/mL) | 4340.0 (3121.0-8066.0) | 5445.0 (2875.0-7438.5) | 0.444 | 5303.0 (2995.0-8707.0) | 6414.0 (4587.0-8272.0) | 0.402 |
| Irisin (pg/mL) | 24.4 (18.9-31.9) | 26.0 (21.25-32.2) | 0.312 | 28.2 (21.1-32.8) | 29.8 (15.1-35.6) | 0.921 |
| SMI (cm2/m2) | 41.0 (36.2-47.4) | 46.0 (39.2-49.5) | 0.083 | 42.1 (36.8-48.9) | 46.4 (41.1-50.7) | 0.082 |
| BCAA supplementation intake | 29 | 17 | <0.001* | 22 | 21 | 0.145 |
- Abbreviations: HBV, Hepatitis B virus; NH3, ammonia; NBNC, both HBsAg and anti-HCV negative; T. Bil, total bilirubin.
- * P < 0.05.
Comparison for Change in Ammonia, Albumin, BTR, and Muscle Area Before Weighting (Splenectomy/PSE Group Vs. Control Group)
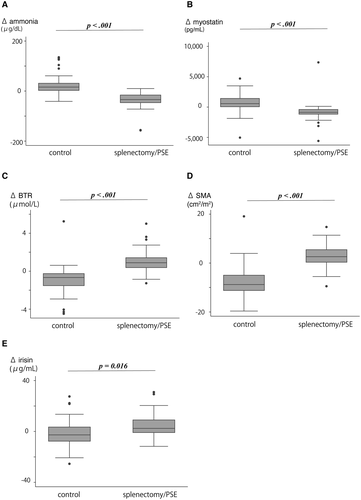
Changes in SMI (ΔSMI/5 years), ammonia (Δammonia/5 years), Child-Pugh score (ΔCPS/5 years), MELD score (ΔMELD/5 years), FIB-4 (ΔFIB-4/5 years), myostatin (Δmyostatin/5 years), irisin (Δirisin/5 years), and BTR (ΔBTR/5 years) were analyzed between baseline and the 5-year follow-up (Fig. 2 and Table 2). Significant median differences were observed between the splenectomy/PSE and nontreatment groups: ΔSMI (2.6 cm2/m2 [0.20-6.18] vs. −8.8 cm2/m2 [−11.31 to −4.78], respectively; P < 0.001), Δmyostatin (−867 [−1202 to −367] vs. −568 [9 to −1632.5], respectively; P < 0.001), Δammonia (−34 [−48.5 to −13] and 16 [2-32], respectively; P < 0.001), ΔBTR (0.89 [0.33-1.47] and −0.665 [−1.55 to −0.23], respectively; P < 0.001), and Δirisin (2.4 [−1.0 to 9.2] vs. −2.7 [−7.9 to 4.1], respectively; P = 0.016); and deterioration of ΔCPS (25 [55.6%] vs. 52 [91.2%], respectively; P < 0.001), ΔMELD score (−0.41 [−2.61 to 2.03] vs. 1.74 [−0.27 to 3.29], respectively; P = 0.007), and ΔFib-4 (−3.46 [−5.01 to −2.01] vs. 1.20 [0.23-2.51], respectively; P < 0.001). The progression of SMI was shown in 10 patients (22.2%) despite the splenectomy/PSE. There tended to be a difference between the patients with and without progression of SMI for the MELD score (6.46 [4.00-8.83] vs. 3.82 [0.42-7.42], respectively; P = 0.069), whereas there was no significant difference for other factors.
| Before Weighting | After Weighting | |||||
|---|---|---|---|---|---|---|
| Spleen Group | Control Group | P Value | Spleen Group | Control Group | P Value | |
| Δmyostatin (pg/mL) | −867 (−1,202 to −367) | −568 (−1,632.5 to 9) | <0.001* | −894 (−1,202 to −335) | 504 (−265 to 1,260) | 0.220 |
| Δirisin | 25:16 | 32:22 | 0.832 | |||
| Δammonia (mg/dL) | −34 (−48.5 to −13) | 16 (2 to 32) | <0.001* | −33 (−50 to −1) | 16 (−3 to 53) | <0.001* |
| ΔBTR | 0.89 (0.33 to 1.47) | −0.67 (−1.55 to −0.23) | <0.001* | 0.89 (0.29 to 1.75) | −0.64 (−1.11 to −0.16) | <0.001* |
| ΔSMI (cm2/m2) | 2.6 (0.20 to 6.18) | −8.8 (−11.31 to −4.78) | <0.001* | (1.8% (−0.23 to 4.69) | −8.2% (−11.2 to −4.7) | 0.225 |
- * P < 0.05.
Comparison for Change in Ammonia, Albumin, BTR, and Muscle Area Before Weighting (Splenectomy Vs. PSE Vs. Control Group)
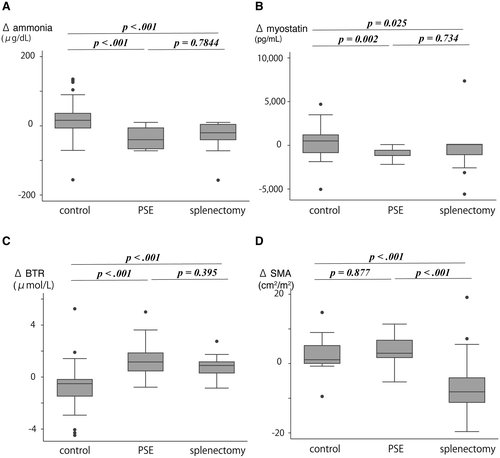
Moreover, to investigate whether the spleen procedure influenced outcomes, we divided the spleen group into a splenectomy and a PSE group. The median ΔBTR in splenectomy, PSE, and control group was 0.89 (0.24 to 1.32), 1.16 (0.45 to 1.88), and −0.51 (−1.51 to −0.15), respectively (splenectomy vs. PSE, P = 0.395; splenectomy vs. nontreatment group, P < 0.001; PSE vs. control, P < 0.001). Significant differences were observed among the splenectomy, PSE, and nontreatment groups for the median Δammonia (−982 [−2,709.5 to −154.25], −717 [−1,164 to −367], and 517 [−265 to 1452], respectively [splenectomy vs. PSE, P = 0.734; splenectomy vs. nontreatment, P = 0.025; and PSE vs. control, P = 0.002]) and ΔSMI (2.98 [0.88-6.86], 1.11 [−0.04 to 5.29], and −8.15 [−11.2 to −4.02], respectively [splenectomy vs. PSE, P = 0.877; splenectomy vs. nontreatment, P < 0.001; and PSE vs. nontreatment, P < 0.001]) (Fig. 3).
Comparison for Change in Ammonia, Albumin, BTR, and Muscle Area After Weighting (Splenectomy/PSE Group Vs. Control Group)
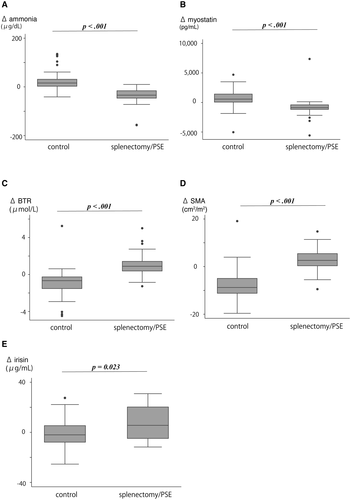
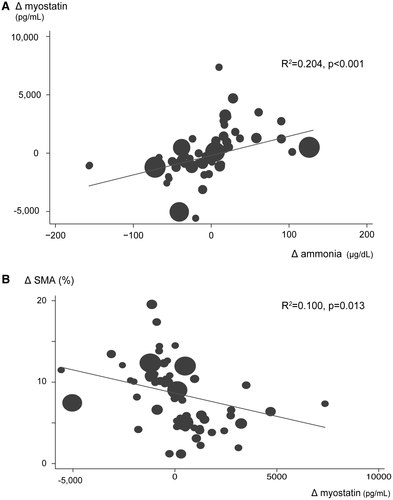
Using the weighted analysis, changes in SMI, myostatin, BTR, and ammonia were compared between the splenectomy/PSE and nontreatment groups (Fig. 4 and Table 2). Significant differences were observed between the splenectomy/PSE and nontreatment groups for the median ΔBTR (0.89 [0.29-1.75] and −0.64 [−1.11 to −0.16], respectively; P < 0.001), Δammonia (−33 [−50 to −1] and 16 [−3 to 53], respectively; P < 0.001), Δmyostatin (−894 [−1,202 to −335] and 504 [−265 to 1,260], respectively; P < 0.001), ΔSMI (1.8 cm2/m2 [−0.23 to 4.69] and −8.2 cm2/m2 [−11.2 to −4.7], respectively; P < 0.001), and Δirisin (5.6 [−5.0 to 15.7] vs. −2.0 [−8.0 to 5.5], respectively; P = 0.023). ΔAmmonia was positively associated with Δmyostatin (R2, 0.204; P < 0.001). Moreover, Δmyostatin was inversely associated with ΔSMI (R2, 0.100; P = 0.013). In contrast, Δmyostatin was not correlated with ΔBTR (R2, 0.047; P = 0.243) (Fig. 5). During the 5-year follow-up, 14 patients (2 in the splenectomy/PSE group and 12 in control group) appeared to be symptomatic of hepatic encephalopathy (including mild confusion, agitation, irritability, sleep disturbance, or decreased attention). Finally, independent associations of SMI increase with age, sex, etiology, splenectomy/PSE, FIB-4 index, MELD score, BCAA supplementation, liver volume, and spleen volume were evaluated by multivariate analysis. In this analysis, age and splenectomy/PSE were significantly independent factors (odds ratio 0.030, 95% confidence interval [CI] 0.001-0.993, P = 0.049; odds ratio 32.246, 95% CI 1.622-641.026, P = 0.023) (Tables 2 and 3).
| Odds Ratio | 95% CI | P Value | |
|---|---|---|---|
| Age > 65 years | 0.030 | 0.001-0.993 | 0.049* |
| Male | 0.170 | 0.015-1.909 | 0.151 |
| HBV vs. NBNC | 26.097 | 0.302-2, 254.684 | 0.152 |
| HBV vs. HCV | 27.303 | 0.421-1, 770.844 | 0.120 |
| HCV vs. NBNC | 0.956 | 0.046-19.885 | 0.977 |
| Splenectomy/PSE | 32.246 | 1.622-641.026 | 0.023* |
| FIB-4 index | 0.735 | 0.421-1.284 | 0.204 |
| MELD score | 1.456 | 0.963-2.203 | 0.075 |
| BCAA supplementation | 1.116 | 0.092-13.543 | 0.931 |
| Liver volume (mL) | 1.001 | 0.997-1.005 | 0.675 |
| Spleen volume (mL) | 0.997 | 0.990-1.004 | 0.417 |
- * P < 0.05.
- Abbreviations: HBV, hepatitis B virus; NBNC, both HBsAg and anti-HCV negative.
Discussion
This study aimed to investigate whether hyperammonemia was associated with secondary sarcopenia in patients with LC. The data presented in the current study suggest that a procedure on the spleen can attenuate the loss of skeletal muscle, which may potentially improve hyperammonemia.
Several etiologies have been suggested that link sarcopenia with LC, two of which are changes in muscle protein synthesis and inhibition of muscle growth. Skeletal muscle mass is maintained by a balance among protein synthesis, protein breakdown, and the regenerative capacity, which is regulated by muscle satellite cell function.(15) Activation of the intracellular target mammalian target of rapamycin (mTOR) stimulates protein synthesis through several intracellular signaling pathways. mTOR is activated through protein kinase B, which is up-regulated by insulin, insulin-like growth factor 1, testosterone, physical activity and/or exercise, and BCAAs, particularly leucine.(16) In the current study, BTR was significantly increased in patients receiving a splenectomy or PSE when compared with patients not receiving a spleen treatment. Although the ratio between BCAA and tyrosine molar concentration is difficult to determine, clinicians use the BTR ratio, as it has been associated with several liver functions.(17)
The findings here are in agreement with previous studies that have reported improved hepatic functional reserve and nutritional metabolism following a splenectomy or PSE as a consequence of an improved portal hypertension.(12, 18) The cause of improvement of FIB-4 was not the change of fibrosis but platelet after splenectomy/PSE. In the current study, we propose that following a splenectomy or PSE, muscle protein synthesis was maintained by an increase in BCAAs. The inhibitory effects of ammonia on muscle growth are well established.(19, 20) Recently, an association between sarcopenia and hepatic encephalopathy in cirrhosis has been reported.(21) Hyperammonemia in skeletal muscle has been shown to transcriptionally up-regulate myostatin expression through a p65NFkB-mediated mechanism, decreasing alpha (α)-ketoglutarate by cataplerosis. Reductions in α-ketoglutarate are able to stabilize hypoxia-inducible factor 1α, activating myostatin and inhibiting pyruvate to acetyl coenzyme a oxidation.(22) This is important because an increase in myostatin, the predominant negative regulator of satellite cell differentiation and proliferation, has been identified as a major driving force of sarcopenia-associated aging.(23) In the present study, we observed no significant differences between the splenectomy/PSE and nontreatment groups. However, following spleen surgery, myostatin levels were significantly reduced in the splenectomy/PSE group, which is likely to have contributed to improvements in hyperammonemia.
During the splenectomy, the portosystemic shunt can be closed by surgical ligation(24); failure to do so decreases the flow of portosystemic shunt. Previous studies have identified that the splenectomy portal vein pressure decreases due to a reduction in blood flow from the splenic artery to the splenic vein. Therefore, hepatofugal flow is responsible for reductions in blood flow of the portosystemic shunt. Similar findings have been observed following PSE, whereby hyperammonemia is improved by a reduction of the blood flow from the portosystemic shunt(25-27) and is likely to contribute to the reduction in myostatin observed here following spleen surgery. We propose that the mechanism discussed here is responsible for reduced myostatin levels after both splenectomy and PSE. In the present study, we also observed a direct association between ammonia and myostatin, and that myostatin was inversely proportional to SMV. Furthermore, we observed no association between the change in BTR and myostatin. Collectively, these data suggest that improvements in hyperammonemia may be one of the contributing factors to maintaining SMV. In multivariate analysis, age and splenectomy/PSE were independent factors with SMV increase. It is more difficult for elderly patients to recover SMV than young ones. To increase SMV, splenectomy/PSE is a very important factor. Interestingly, much debate remains over which spleen treatment (splenectomy vs. PSE) provides the best clinical outcomes for hypersplenism.(28) In the current study, we did not identify any significant differences between the two procedures (splenectomy vs. PSE). Similar findings have been reported by Amin et al.,(28) who reported that both splenectomy and PSE are effective treatments for cytopenia secondary to chronic liver disease. The data from the current study suggest that both surgeries are effective in reducing the loss of skeletal muscle and that the choice of surgery should be based on what is the safest clinically for the patient.
However, any procedure on the spleen to inhibit SMV loss may be unethical. Current therapeutic approaches to treat hepatic encephalopathy include lactulose and rifaximin (to reduce ammonia levels) and BCAA supplementation (to maintain leucine levels). Although there were no patients with refractory encephalopathy in this study after lactulose medication, only when refractory hepatic encephalopathy has occurred despite the use of alternative medications should splenectomy or PSE be discussed with patients with sarcopenia and LC as a treatment option. The SMI was not improved in 10 patients (22.2%) despite splenectomy/PSE. Although there were no significant differences, the MELD score tended to be at a high level in those 10 patients than others. Although detailed analysis is difficult due to the small number of cases, the patients with poor hepatic reserve function may not be improved sufficiently after splenectomy/PSE.
The current study is not without limitation. First, the small sample size means that any generalization will be difficult. There should not be a difference for any factors between the two groups. BTR is not important because of the differences in the baseline value of ammonia, and we want to analyze how ammonia and BTR were changed after splenectomy/PSE; therefore the differences in baseline of those factors were left out. Future studies may benefit from conducting multicentered trials in which large numbers of patients can be recruited and there is no significant difference for any factors. Second, the follow-up period of 5 years may not have been enough to effectively evaluate the effect of spleen surgery on maintaining SMV. A longer follow-up period is required to investigate the long-term effects of the spleen surgery. Finally, we only investigated myostatin-mediated and BTR-mediated mechanisms; further mechanisms are likely to contribute to the maintenance of SMV in patients with LC. For example, BCAA supplementation intake or extensive exercise may influence the SMV. In this study, most of the patients did not perform extensive exercise. Because only 8 patients were administered BCAA supplementation after being enrolled in this study, it was not clarified whether BCAA supplementation and exercise influenced SMV. Future studies should analyze these points.
In conclusion, we demonstrated that both splenectomy and PSE are associated with the prevention of the loss of skeletal muscle in secondary sarcopenia in patients with LC. Particularly in patients with hyperammonemia, it can be expected that muscle volume loss is reduced by splenectomy or PSE.


