The Co-mutational Spectrum Determines the Therapeutic Response in Murine FGFR2 Fusion-Driven Cholangiocarcinoma
Abstract
Background and Aims
Intrahepatic cholangiocarcinoma (ICC) is the second most common primary liver cancer and a highly lethal malignancy. Chemotherapeutic options are limited, but a considerable subset of patients harbors genetic lesions for which targeted agents exist. Fibroblast growth factor receptor 2 (FGFR2) fusions belong to the most frequent and therapeutically relevant alterations in ICC, and the first FGFR inhibitor was recently approved for the treatment of patients with progressed, fusion-positive ICC. Response rates of up to 35% indicate that FGFR-targeted therapies are beneficial in many but not all patients. Thus far, no established biomarkers exist that predict resistance or response to FGFR-targeted therapies in patients with ICC.
Approach and Results
In this study, we use an autochthonous murine model of ICC to demonstrate that FGFR2 fusions are potent drivers of malignant transformation. Furthermore, we provide preclinical evidence that the co-mutational spectrum acts not only as an accelerator of tumor development, but also modifies the response to targeted FGFR inhibitors. Using pharmacologic approaches and RNA-interference technology, we delineate that Kirsten rat sarcoma oncogene (KRAS)–activated mitogen-activated protein kinase signaling causes primary resistance to FGFR inhibitors in FGFR2 fusion–positive ICC. The translational relevance is supported by the observation that a subset of human FGFR2 fusion patients exhibits transcriptome profiles reminiscent of KRAS mutant ICC. Moreover, we demonstrate that combination therapy has the potential to overcome primary resistance and to sensitize tumors to FGFR inhibition.
Conclusions
Our work highlights the importance of the co-mutational spectrum as a significant modifier of response in tumors that harbor potent oncogenic drivers. A better understanding of the genetic underpinnings of resistance will be pivotal to improve biomarker-guided patient selection and to design clinically relevant combination strategies.
Abbreviations
-
- AHCYL1
-
- adenosylhomocysteinase like 1
-
- BRAF
-
- B-Raf proto-oncogene, serine/threonine kinase
-
- cDNA
-
- complementary DNA
-
- CI
-
- combination index
-
- Dox
-
- doxycycline
-
- ERK
-
- extracellular signal-regulated kinase
-
- FAK
-
- FGFR2-AHCYL1- KrasG12D cell line
-
- FGFR2
-
- fibroblast growth factor receptor 2
-
- FPK
-
- FGFR2-PPHLN1-KrasG12D cell line
-
- FRS2
-
- fibroblast growth factor receptor substrate 2
-
- IC50
-
- half-maximal inhibitory concentration
-
- ICC
-
- intrahepatic cholangiocarcinoma
-
- KRAS
-
- Kirsten rat sarcoma oncogene
-
- KRPC
-
- Kras-driven pancreatic cancer cell line
-
- MAPK
-
- mitogen-activated protein kinase
-
- MEK
-
- MAPK/ERK kinase
-
- mOS
-
- median overall survival
-
- pERK
-
- phosphorylated extracellular signal-regulated kinase
-
- pFRS2
-
- phosphorylated fibroblast growth factor receptor substrate 2
-
- PGK
-
- phosphoglycerate kinase
-
- PI3K
-
- phosphatidylinositol 3-kinase
-
- pMEK
-
- phosphorylated MEK
-
- PPHLN1
-
- periphilin 1
-
- pSHP2
-
- phosphorylated SH2 domain–containing protein tyrosine phosphatase 2
-
- RNAi
-
- RNA interference
-
- rTTA
-
- reverse tetracycline-transactivator
-
- shRNA
-
- short hairpin RNA
-
- Trp53
-
- tumor protein p53
-
- WT
-
- wild-type
-
- Yap1
-
- Yes1 associated transcriptional regulator
Intrahepatic cholangiocarcinoma (ICC) is a highly aggressive malignancy that arises within the liver and displays features of biliary differentiation. The only potentially curative treatment is surgical resection, but due to late manifestation of clinical symptoms, less than a third of patients are eligible for surgery. Owing to frequent and early postsurgical disease recurrence, nearly all patients with ICC are eventually bound to receive palliative chemotherapy.(1) ICC is an intrinsically highly chemoresistant disease, with a median overall survival (mOS) below 1 year under palliative systemic therapy with gemcitabine and cisplatin.(2) Apart from initial data from the United Kingdom in favor of second-line treatment with 5-fluoruracil and oxaliplatin (ABC-06 study, presented at ASCO 2019), no established second-line chemotherapeutic concepts exist.
Although the molecular landscape of ICC is heterogeneous, a recurrent repertoire of driver genes exists: Several studies suggest that approximately 40% of patients harbor targetable lesions, such as mutations in BRAF (B-Raf proto-oncogene, serine/threonine kinase) or isocitrate dehydrogenase 1/2, indicating that genetically informed personalized concepts are promising in a defined subset of patients.(3-7) One of the most frequent alterations that occurs in up to 15% of ICC cases are genetic rearrangements that involve the transmembrane receptor tyrosine kinase fibroblast growth factor receptor 2 (FGFR2). The N-terminal FGFR2 portion is fused in frame to one of more than 100 fusion partners identified so far.(6) The resulting chimeric protein retains the extracellular, transmembrane, and kinase domains of FGFR2, while the fusion partner provides a dimerization/oligomerization motif. An increased dimerization potential, and likely also the loss of inhibitory regulatory elements in the 3´ region of FGFR2, results in the constitutive, ligand-independent receptor activation.(3)
Functional proof of the transformative potential of FGFR2 fusions has been provided by in vitro studies as well as in vivo models using murine fibroblasts or established human cell lines.(8-10) In addition, the therapeutic promise of FGFR2 fusions has led to the clinical development of FGFR inhibitors, which have successfully completed phase 2 clinical trials and are currently further developed in phase 3 studies for FGFR2 fusion–positive ICC. Overall response rates to FGFR-targeted agents range between 20% and 35% in the second or higher lines of therapy, and exceed the efficacy of conventional chemotherapy. On the basis of the Fight-202 phase 2 trial, the FGFR inhibitor pemigatinib was recently granted accelerated approval by the Food and Drug Administration (FDA) for the treatment of previously treated cholangiocarcinoma. However, the observation that, even in a genetically defined subgroup, only one of three tumors responds to the targeted approach, implies that various mechanisms exist that are capable of mediating primary therapeutic resistance. To improve up-front patient stratification and optimize therapeutic efficacy, it will be important to better understand the underlying molecular cause of primary resistance.
Here, we describe a genetically flexible murine model of FGFR2 fusion–driven ICC and illustrate, how the co-mutational spectrum can lead to primary therapy resistance toward FGFR inhibitors. In addition, we provide in vitro and in vivo evidence that sensitivity to FGFR inhibitors can be rescued by molecularly informed cotreatment strategies.
Experimental Procedures
Animal Experiments
All animal experiments were approved by local authorities (the Lower Saxony State Office for Consumer Protection and Food Safety). The B6.12954 Krastm4Tyj (KraslslG12D/wt) strain was a gift from Albrecht Neesse (Georg-August University, Göttingen, Germany) and maintained at the local animal facility of Hannover Medical School. NOD.Cg-Prkdcscid Il2rgtm1Wjl/SzJ (NSG) mice were bred at and purchased from the local animal facility. Seven-week to 8-week-old male and female animals were used for all experiments. Unless otherwise stated, experimental animals were fed a standard diet (1324 M; Altromin, Lage, Germany) and maintained in individually ventilated cages with access to food and water ad libitum. Interventions were done during the 14-hour day cycle.
To generate primary tumors, liver electroporations were performed as previously described(11) (and detailed in the Supporting Methods). For in vivo drug treatments, animals bearing subcutaneous tumors were randomized, and treatments were started when tumor volumes reached approximately 100 mm3. Tumor growth was followed by digital caliper measurements and calculated as 0.5 × length × width2 (length > width). Experimental animals were euthanized when tumor volumes reached 1,200 mm3.
The following compounds and concentrations were used for in vivo experiments: BGJ398 (30 mg/kg, once a day, by oral gavage, resuspended in polyethylene gycol 400/0.5% Tween80/5% propylene glycol), gemcitabine (100 mg/kg, twice per week, intraperitoneal delivery, diluted in NaCl 0.9%), and trametinib (1 mg/kg, once a day, by oral gavage). Doxycycline (Dox)–containing food (625 mg/kg) was purchased from Envigo Teklad (Horst, Netherlands).
Short Hairpin RNA Transduction and Depletion Assays
To enable tet-regulatable gene expression, the FPK (FGFR2-PPHLN1-KrasG12D) and FAK (FGFR2-AHCYL1-KrasG12D) cell lines were transduced with reverse tetracycline-transactivator (rtTA3)–encoding lentiviral particles (pRRL.SFFV-rtTA3-IRES-EcoR-PGK-Puro), kindly provided by Johannes Zuber, IMP, Vienna). Puromycin-selected cells were then subjected to a second round of transduction with short hairpin RNA (shRNA)–encoding retroviruses: 48 hours after polyethylenimine transfection with 7 µg of vector DNA (TRIN_miRE_shKras.247, TRIN_miRE_shKras.368, or TRIN_miRE_shRenilla.713; 3 µg polyethylenimine per µg DNA), viral supernatant was collected from Platinum E cells (Cell Biolabs, San Diego, CA) and supplemented with 4 µg/mL polybrene (Sigma-Aldrich, Milwaukee, WI). Cells were neomycin-selected to 90%-95% Venus-positive cells. For depletion assays, Dox (Sigma-Aldrich, St. Louis, MO) was added to the cell culture medium at a final concentration of 1 µg/mL, and cells were cultured in the absence or presence of the FGFR inhibitor BGJ398 (2 µM). The shRNA-expressing population (Venus+/dsRed2+) was followed longitudinally by flow cytometry.
Results
FGFR2 Fusions Drive Malignant Transformation In Vitro and In Vivo
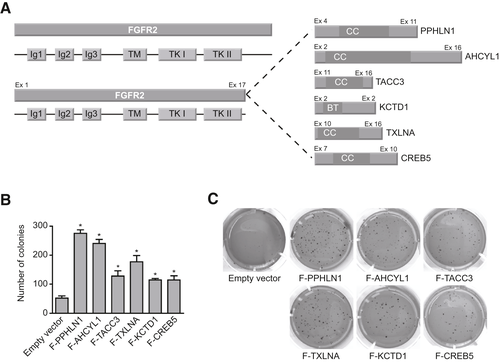
We used a soft-agar assay to test the colony formation capacity of six different FGFR2 fusions (Fig. 1A). All fusions enhanced anchorage-independent growth compared with empty vector control (Fig. 1B,C). To further evaluate whether the increased colony formation potential observed in vitro translates into accelerated tumor development in vivo, we used an orthotopic ICC liver electroporation model.(11) Based on an early study that reported a frequent co-occurrence of FGFR2 fusions and KRAS (Kirsten rat sarcoma oncogene) mutations in ICC,(8) we electroporated transposon constructs encoding for the respective fusion complementary DNAs (cDNAs), a positive control cDNA (Yes1 associated transcriptional regulator [Yap1]) or a negative control cDNA (green fluorescent protein), under the control of a phosphoglycerate kinase (PGK) promoter into the livers of transgenic mice harboring the lox-stop-lox-KrasG12D allele (KraslslG12D/wt).(12) In contrast to overexpressed mutant KRAS, which led to rapid tumor development in the original liver electroporation ICC model,(11) the transgenic allele that is transcribed from the endogenous locus achieves more “physiologic” levels of oncogene expression. The latent allele was activated by the co-electroporated and transiently expressed Cre recombinase, and Trp53 (tumor protein p53) was disrupted by CRISPR/Cas9 gene editing(13) (Fig. 2A,B).
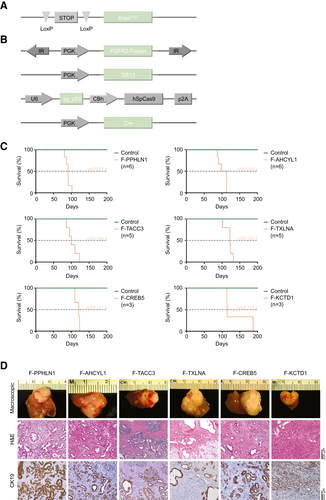
Mice that received the plasmid mix containing a fusion cDNA developed liver tumors with full penetrance and had to be sacrificed with a mOS of 3 to 4 months following electroporation (Fig. 2C). PCR-based amplification of a region spanning the respective fusion “breakpoints” on genomic DNA extracted from the tumors confirmed stable integration of the fusion cDNA in all tested samples (Supporting Fig. S1A).
Although mice that received the positive control cDNA (Yap1) also rapidly developed tumors and had to be sacrificed between 9 and 10 weeks after electroporation (Supporting Fig. S1B), no tumor growth was detected in any of the 15 control-electroporated mice within the observational timeframe of up to 6.5 months (Supporting Fig. S1B). The unexpected observation that the activation of the latent mutant KrasG12D allele in combination with single-guide RNA (sgRNA)–mediated disruption of Trp53 is not sufficient to induce tumors in the adult murine liver indicates that the FGFR2 fusions function as the relevant oncogenic drivers in this model. Histologically, tumors predominantly presented as poorly differentiated adenocarcinomas with regions of moderate differentiation that displayed cytokeratin 19–positive ductal structures surrounded by a dense tumor stroma, overall reminiscent of human ICC (Fig. 2D). Three of 22 evaluated tumors showed features of poorly differentiated HCC.
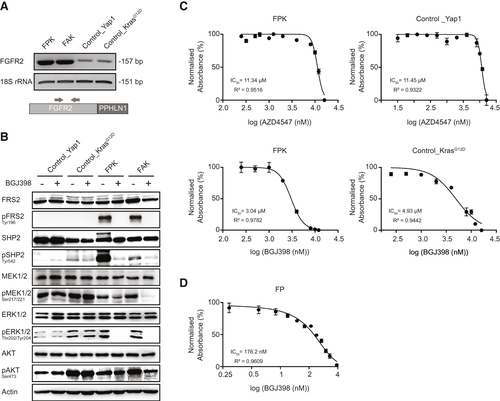
For further in vitro studies, we derived cell lines from a subset of FGFR2-driven tumors (FGFR2–periphilin 1 [PPHLN1] and FGFR2–adenosylhomocysteinase like 1 [AHCYL1], denoted here as FPK and FAK cells). Efficient CRISPR/Cas9-mediated editing of Trp53 was confirmed by surveyor assay and immunoblotting (Supporting Fig. S1C). Despite extensive efforts to validate expression of the fusion proteins by western blot or immunohistochemistry, we were not able to conclusively detect the chimeric fusion proteins using different commercially available antibodies designed to recognize an epitope in the 5’ region of FGFR2 (data not shown). Therefore, to provide proof of active transcription, we determined FGFR2 levels by semiquantitative PCR on reverse-transcribed cDNA from fusion versus nonfusion cell lines. For nonfusion controls, we used a cell line that we derived from a Yap1-driven control tumor, in addition to a previously published murine KRAS-driven cholangiocarcinoma cell line.(14) Primers were designed to detect both the fusion and the endogenous murine wild-type (WT) FGFR2 cDNA (Fig. 3A). The increased band intensity indicated elevated mRNA expression in the fusion lines compared with endogenous FGFR2 levels in the nonfusion controls. In addition, liquid chromatography–mass spectrometry analysis confirmed the presence of the fusions on the protein level in crude cell lysates from FPK and FAK cell lines (Supporting Table S1). Further functional proof of FGFR2 activity was provided by detection of enhanced levels of canonical FGFR2 downstream targets, such as phosphorylated fibroblast growth factor receptor substrate 2 (pFRS2) and phosphorylated SH2 domain–containing protein tyrosine phosphatase 2 (pSHP2) in fusion-positive versus fusion-negative cell lines (Fig. 3B).
FGFR2 Fusion-Positive Tumor Cell Lines Harboring a Mutant Kras Allele Are Resistant to FGFR Inhibitors Despite Efficient Interruption of Downstream Signaling
Based on the observation that all mice injected with the FGFR2 fusion plasmid developed tumors, whereas no tumor development was observed in the negative control mice, we assumed that FGFR2 acts as the oncogenic driver in our model. Therefore, the respective tumor-derived cell lines should be genuinely sensitive to treatment with FGFR inhibitors.
As expected, treatment with BGJ398 (infigratinib), a clinically advanced FGFR inhibitor with positive phase 2 data for patients with ICC,(15) resulted in decreased levels of phosphorylated extracellular signal-regulated kinase (pERK), phosphorylated mitogen-activated protein kinase (pMEK), pSHP2, and pFRS2, specifically in the fusion-positive cell lines. The minor impact of the drug on phosphorylated AKT serine/threonine kinase 1 is in line with previous reports, that phosphatidylinositol 3-kinase (PI3K) signaling is only marginally affected by FGFR inhibitors (Fig. 3B).(16) Surprisingly, although pharmacologic FGFR inhibition efficiently disrupted FGFR-downstream signaling in the presence of mutant Kras, half-maximal inhibitory concentrations (IC50) of four different FGFR inhibitors were unexpectedly high in the fusion cell lines, and without striking or consistent differences between the fusion and nonfusion cells (Fig. 3C and Supporting Table S2). In contrast, an FGFR2-PPHLN1-driven cell line derived from a tumor that was engineered in a Kras WT littermate control (termed FP; Supporting Fig. S2A,B) was decisively more responsive to BGJ398 (Fig. 3D) and TAS120 (Supporting Table S2), but was rendered resistant through the introduction of alternative RAS signaling activators (Supporting Fig. S2C).
Therefore, despite the observation that KrasG12D was not sufficient to drive malignant transformation in our model, we reasoned that the co-mutant Kras allele was the cause of primary resistance to the FGFR inhibitors.
KRAS Inhibition Re-sensitizes FGFR2 Fusion–Positive, KRAS Mutant Cells to FGFR Inhibition
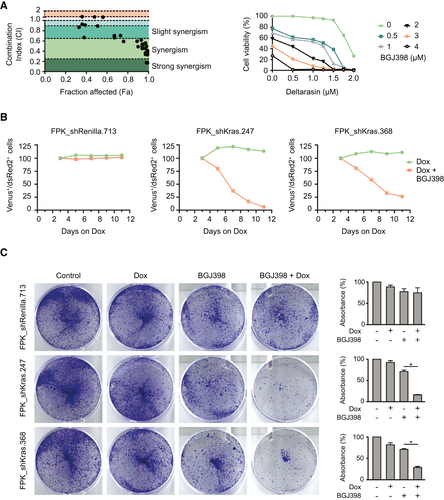
Thus far, no clinically developed direct KRASG12D inhibitor exists. KRAS requires the correct subcellular localization to exert its oncogenic activity, which is in part regulated by the prenyl-binding protein PDEδ. Therefore, to address whether targeting KRAS signaling together with FGFR inhibition acts synergistically in our FGFR2 fusion model, we performed an in vitro two-drug combination assay using BGJ398 together with the preclinical small molecule KRAS-PDEδ inhibitor deltarasin.(17) Cells were cotreated with BGJ398 and deltarasin at different concentrations, and CompuSyn was used to calculate the combination index (CI) and fraction affected (Fa) for each combination drug value. Most of the CI values were within the synergistic range (Fig. 4A and Supporting Fig. S3A).
As a small molecule inhibitor, deltarasin does not exclusively affect KRAS localization, but also binds to other G-protein-coupled receptors, ion channels, and transporters. Off-target effects can be promoted by the high drug concentrations that are necessary to suppress residual PDEδ activity, which can be sufficient to sustain oncogenic RAS signaling.(18) To rule out that the synergistic effects observed in the drug assay were due to off-target activity, we chose to recapitulate our findings by using a genetic approach. We cloned shRNAs targeting Kras, or a neutral control (shRenilla), into the TRE-dsRed2-miRE/shRNA-PGK-Venus-IRES-NeoR vector system.(19) This neomycin-selectable tet-on vector system contains fluorescent reporters that enable longitudinal tracking of cells with potent target knockdown: Transduced cells constitutively express the fluorescent marker Venus, and Dox induces activation of the tetracycline-responsive element that drives shRNA expression, linked to the red fluorescent marker dsRed. Following insertion of an rtTA cassette, we stably transduced the FPK and the FAK cell line with the inducible shRNA constructs. In addition, to control for the functional efficacy of KRAS knockdown, we included a previously characterized murine cancer cell line (KRPC) that depends on mutant KrasG12D as an oncogenic driver, and was rendered tet-on competent by integration of an rtTA cassette.(20) To rule out RNA interference (RNAi)–induced off-target effects, two separate shRNAs targeting Kras were used throughout the experiment, and efficient KRAS knockdown was confirmed by western blot on lysates from Dox-treated cells after neomycin selection (Supporting Fig. S3B).
The modified cell lines were cultured in the presence of either Dox only to induce KRAS knockdown, or Dox plus BGJ398 for KRAS knockdown in the presence of an FGFR inhibitor. The relative percentage of the Venus/dsRed double-positive, shRNA-expressing population was followed by flow cytometry (Supporting Fig. S3C) for up to 12 days.
In all cell lines transduced with the neutral control shRNA, the proportion of hairpin-expressing cells remained constant over the course of the experiment, independent of the presence or absence of the FGFR inhibitor. Notably, FPK_shKras and FAK_shKras cells were not depleted following induction of KRAS knockdown alone, demonstrating that proliferation of these cells does not critically depend on signaling through mutant KRAS (Fig. 4B and Supporting Fig. S3D, green curve). KRAS-driven KRPC cells (without FGFR2 fusion) were rapidly depleted after Dox addition, thus providing proof for the functional activity of the Kras hairpins (Supporting Fig. S3E).
In contrast, when the shKras-transduced FPK and FAK cells were cultured in the presence of the FGFR inhibitor after induction of KRAS knockdown, the hairpin-expressing population rapidly decreased (Fig. 4B and Supporting Fig. S3D, red curves), while the addition of the FGFR inhibitor did not influence the depletion kinetics observed in KRPC cells (Supporting Fig. S3E).
The superior activity of the FGFR inhibitor in the presence of KRAS knockdown in FPK_shKras and FPK_shRenilla cells was further corroborated in a clonogenic growth assay. Of note, the results of this assay likely underestimate the consequence of KRAS knockdown in the BGJ-treated cells, as the quantification of “bulk” cell densities does not control for the approximate 30% of cells that fail to efficiently express the shRNA (Fig. 4C).
Together, these data support the view that the FGFR2-driven, Kras mutant cell lines are not addicted to the Kras co-mutation, and that the superior depletion in the presence of KRAS knockdown is caused by synergistic effects.
In Vivo RNAi Confirms That KRAS Knockdown in FGFR2 Fusion-Positive, KRAS Mutant Tumors Delays Tumor Growth Only in the Presence of an FGFR Inhibitor
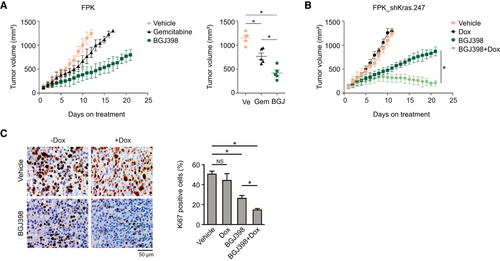
Next, we set out to confirm these results in an in vivo environment. First, we addressed the therapeutic consequences of either monotherapy with gemcitabine as part of the standard chemotherapy regiment in patients with ICC, or treatment with BGJ398. Compared with vehicle-treated controls, gemcitabine treatment significantly reduced tumor growth in mice injected subcutaneously with FPK cells. Treatment with BGJ398 resulted in a further delay in tumor growth, suggestive of a superior performance in vivo compared with its in vitro efficacy (further discussed subsequently) (Fig. 5A). In a second experiment, we injected mice with the FPK_shKras.247 cell line. Following tumor growth, mice were randomized to receive vehicle, vehicle plus Dox (to induce KRAS knockdown), BGJ398, or BGJ398 plus Dox. Recapitulating our in vitro observations, KRAS knockdown alone did not affect tumor growth compared with vehicle treatment, whereas KRAS knockdown in the BGJ-treated cohort led to superior inhibition of tumor growth compared with mice that received only BGJ398 (Fig. 5B). Histologically, the superior response to BGJ398 in the presence of KRAS knockdown was accompanied by a significant reduction in Ki67 expression (Fig. 5C).
Resistance to BGJ398 in FPK Cells Is Mediated Through the MEK/ERK Axis
Compounds targeting crucial KRAS-signaling hubs have largely failed as monotherapy, in part due to the activation of strong feedback mechanisms that are capable of rapidly overruling the effects of the respective inhibitors. Two downstream pathways with pivotal importance for KRAS oncogenic signaling are the MEK/extracellular signal-regulated kinase (ERK) cascade and the PI3K cascade. To assess whether pharmacologic blockage of one or the other pathway could enhance the effect of FGFR inhibition, we treated our original FPK cell line with the PI3K inhibitor buparlisib, or the MEK inhibitor trametinib, at their respective approximate IC20-IC30 concentrations (Supporting Fig. S2D) and with or without concurrent BGJ398 treatment. Clonogenic growth assays on single-treated versus combination-treated cells showed that cotreatment with BGJ398 and the MEK inhibitor outperformed the effect of the FGFR inhibitor plus the PI3K inhibitor (Fig. 6A). Consistently, administration of BGJ398 in combination with trametinib in vivo resulted in a dramatic therapy response in mice bearing subcutaneous FPK tumors (Fig. 6B). This provides evidence that the MEK/ERK axis acts as the crucial downstream effector of FGFR-inhibitor resistance in our KRAS mutant cells.
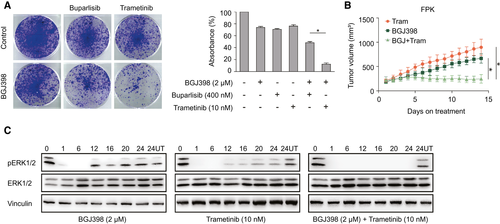
Rapid activation of feedback loops can severely compromise the efficacy of targeted therapies.(20) The MAPK pathway is activated by KRAS, which is also a downstream target of FGFR2, resulting in reduced pERK levels in FPK and FAK cells treated with BGJ398 (Fig. 3B). To address the mechanistic underpinnings of the FGFR-inhibitor resistance, and its relief following KRAS knockdown or MEK inhibitor treatment, we longitudinally monitored pERK expression levels in FPK cells treated with either BGJ398 or trametinib. Both BGJ398 and trametinib as monotherapies led to pERK rebound by 12 hours after addition of the drug. In contrast, in cells that were treated with both the FGFR inhibitor and the MEK inhibitor, pERK re-expression was decisively delayed (Fig. 6C).
Together, despite the genuine lack of sensitivity of FPK and FAK cell lines toward KRAS knockdown, pERK rebound following FGFR inhibition can be suppressed by MEK inhibition. This observation suggests that targeted inhibition of FGFR signaling permits de-repression or activation of alternative pathways and creates a “secondary” dependency on KRAS signaling, which is overcome by combinatorial treatment. Of note, despite the high in vitro IC50, we observed a significant delay in tumor growth of FPK cells treated with an FGFR inhibitor in vivo, although further inhibition could be achieved by concomitant KRAS knockdown. Under standard cell culture conditions, high concentrations of growth factors are present in fetal calf serum-supplemented medium. Therefore, pro-proliferative cues that are transmitted from the microenvironment to the tumor cells, such as after relief of negative feedback loops, are likely most effective in the presence of intense external stimuli.
In summary, these results indicate that the co-mutational spectrum of the FGFR2 fusion–driven ICC cell lines decisively influences response to pharmacologic FGFR inhibition, and that the sensitivity to FGFR inhibitors can be restored by implementing co-targeting strategies.
To determine whether human FGFR2 fusion patients are a molecularly “homogeneous” or rather “heterogeneous” cohort, we performed unsupervised clustering of bulk transcriptome data from local patients with ICC (n = 162). FGFR2 fusion–positive cases were broadly distributed across the clusters, which indicated that the presence of the FGFR2 fusion is not the overarching determinant of the molecular profile (Supporting Fig. S4A). Second, we asked whether a subset of the FGFR2 patients displayed a profile similar to the KRAS mutant cases. By comparing 15 KRAS codon 12 or codon 13 mutant ICCs to 29 FGFR2 fusion–positive cases, we determined 258 differentially regulated genes (Supporting Table S3). Unsupervised clustering on the basis of these genes showed that 4 of the 29 FGFR2 fusion–positive ICCs, as well as a subset of non-KRAS/nonfusion cases, display a molecular pattern reminiscent of KRAS mutant ICC (Supporting Fig. S4B). Mutational analysis of transcriptome data from these four FGFR2 fusion–positive patients revealed that these tumors bore genetic alterations in genes associated with MAPK activation (Supporting Fig. S5A). This is in line with the previously described frequent MAPK signaling activation in biliary tract cancers(21) (Supporting Fig. S5B). Within a cohort of 457 FGFR2 fusion–positive patients with ICC, genetic alterations in NF1, NF2, EGFR, ERBB2, ERBB3, MET, PDGFRA, NRAS, and BRAF, were found in 7.4% of cases.
Overall, human ICC transcriptome analysis suggests that FGFR2 fusion–positive patients are a molecularly heterogeneous subgroup, but that individual cases exhibit expression patterns reminiscent of mutant KRAS ICC.
Discussion
ICC is a highly aggressive malignancy with a devastating prognosis, but a considerable subset of patients harbors genetic alterations that are amenable for precision oncology. Several phase 3 trials that evaluate targeted therapies in FGFR2 fusion–positive ICC are ongoing, and based on the results of the Fight-202 study, the selective FGFR inhibitor pemigatinib has recently gained FDA approval.(22)
To date, most precision oncology trials match genetic alterations with monotherapies that address the presumed driver alteration. For many patients, this has proven to be a successful concept. For example, up to 35% of ICC patients with FGFR2 fusions experience clinically relevant tumor shrinkage under treatment with FGFR inhibitors.(22) However, critical evaluation of clinical trial data also illustrates that the presence of a strong and targetable oncogenic driver does not necessarily guarantee therapeutic success. To further “personalize” and advance precision oncology, parameters that distinguish patients with druggable genetic alterations who will or will not benefit from the respective drugs need to be identified. ICC is a rare cancer, and although FGFR2 fusions belong to the most frequent genetic alterations in this tumor, the absolute number of FGFR2-fused patients is low. Further substratification within the cohort of fusion-positive ICC would result in even smaller patient subgroups, which, in the setting of a clinical trial, might require years of patient accrual until statistically significant patterns evolve.
Murine models can help us to understand the underlying mechanisms of resistance and to generate strategies to improve existing targeted therapies. Here, we used the liver electroporation approach to create an autochthonous model of FGFR2 fusion–driven cancer. Through the integration of sgRNAs, latent transgenic alleles, and the sleeping beauty transposase system, the model is genetically highly flexible and enables rapid in vivo to in vitro translation through the generation of genetically defined tumor cell lines.
Interestingly, while all mice that received a fusion cDNA developed liver tumors, none of the negative control mice showed signs of tumor development following activation of the latent Kras allele and CRISPS/Cas9-mediated disruption of Trp53. Of note, the same genetic combination is sufficient to induce tumorigenesis in both transgenic and organoid-based murine cholangiocarcinoma models, or when mutant KRAS is expressed from an exogenous promoter in the electroporation approach.(11, 14, 23) This observation illustrates that the threshold that needs to be met in murine cholangiocarcinoma models to achieve efficient malignant transformation is context-dependent and cell type–dependent, and further influenced by the timing and dosage of the oncogenic stimulus.
Considering the lack of tumor development in the negative control group, we demonstrate that the FGFR2 fusion acts as the key oncogenic driver in our model. However, the biological and therapeutic relevance of the co-mutated Kras allele is reflected by the delayed tumor growth and incomplete penetrance in mice that lack mutant Kras, and is further supported by the resistance of Kras mutant, FGFR2-driven cell lines to FGFR inhibitors. Using pharmacological approaches, and by combining them with in vitro and in vivo RNAi, we show that the resistance depends on the activity of mutant KRAS, and that sensitivity to FGFR inhibition can be restored by either inhibiting KRAS itself, or MEK as one of its downstream effectors. FGFR2 activates KRAS through the growth factor receptor–bound protein/son of sevenless axis, and MEK/ERK is a signaling hub of physiologically, but also of aberrantly activated, KRAS. The strong reduction of pERK levels in FPK cells observed after addition of the FGFR inhibitor indicates that FGFR signaling decisively determines the activation level of the MEK/ERK axis during steady-state conditions, independent of the mutant Kras allele. The rapid pERK rebound is in line with the lack of sensitivity to the inhibitors in vitro, but can be significantly delayed by co-treatment with a MEK inhibitor. Notably, the combined action of FGFR inhibition and KRAS or MEK inhibition in our model appears to be not additive, but synergistic, and is capable of overcoming primary resistance. Our data suggest that the relief of FGFR signaling in tumors with concomitant KRAS activation leads to a signaling switch—possibly by influencing feedback loops—that permits active signaling of (mutant) KRAS through MEK and ERK, creating a secondary dependency on mutant KRAS.
According to recent literature, autocrine FGFR-pathway activation confers adaptive resistance to BRAF/MEK inhibition in BRAF-driven malignancies,(24) and a compensatory increase of FGFR1 activation results in adaptive drug resistance toward MEK inhibition in KRAS mutant lung cancer.(25) These findings further highlight the close interplay between RAS and FGFR signaling, and indicate that a better understanding of mechanisms that lead to primary resistance will also help to unravel mediators of secondary therapeutic failure, and vice versa.
The reported high frequency of KRAS mutations in patients with FGFR2 fusion–positive ICC(8) could not be recapitulated in more recent sequencing studies. Indeed, in a clinical trial, only 2 in 140 patients with FGFR2-rearranged ICC harbored a concomitant KRAS mutation.(26) Nevertheless, we believe that our work provides proof of concept that the co-mutational spectrum in FGFR2-fused cholangiocarcinoma, including mutations that increase activation of RAS downstream signaling, can profoundly alter the response to targeted FGFR inhibition. However, a caveat to our work is that the artificial nature of our model has to be taken into consideration, and, given the limited number of cases in which these co-mutations may indeed arise, the clinical impact remains to be determined.
Beyond mutations in KRAS, several genetic modes of MAPK signaling exist in patients with biliary tract cancers, and transcriptome analysis from a cohort that included 29 local FGFR2 fusion–positive patients with ICC revealed the molecular heterogeneity of this genetic subgroup. Larger patient cohorts with accompanying clinical and molecular data are needed to delineate whether patients with specific transcriptional profiles, including those with “KRAS-like” ICC profiles (not necessarily driven solely by KRAS mutations) are less sensitive to FGFR inhibitors. The translational programs of currently recruiting clinical trials will further elucidate the molecular underpinnings of FGFR inhibitor resistance in patients with ICC. In consideration of the overall limited number of patients, genetically defined preclinical models will be important for the identification and characterization of biomarkers that have the potential to advance patient stratification, and for the development of experimentally informed co-treatment strategies.
In summary, we have used an autochthonous murine model of ICC to functionally validate FGFR2 as a driver of cholangiocarcinogenesis, and to mechanistically address the pathobiology of primary resistance in patients with FGFR2 fusions. We demonstrate that the dependency of malignant transformation on FGFR2 fusions as oncogenic drivers does not inevitably predict sensitivity toward FGFR-targeted agents. Moreover, we provide evidence that molecularly informed combination approaches in FGFR2 fusion–positive ICC are capable of overcoming primary resistance, which can be mediated by the co-mutational spectrum.
Acknowledgment
The authors thank Eric Jende and Meriame Nassiri for their expert technical assistance throughout the investigation, and Scott W. Lowe, Johannes Zuber, Arul M. Chinnaiyan, and Albrecht Neesse for generously providing crucial resources.
Author Contributions
G.K.: Conceptualization, Formal analysis, Data curation, Methodology, Investigation, Validation, Visualization, Writing – original draft, Writing – review & editing. S.M.: Formal analysis, Investigation, Visualization, Writing – review & editing. G.L.: Investigation, Methodology, Writing – review & editing. D.B.: Data curation, Formal analysis, Investigation, Software. T.R.-P.: Resources, Investigation. T.P.: Resources, Investigation. K.M.: Formal analysis, software, resources. F.K.: Resources, Methodology. N.W.: Resources, Methodology. R.M.W.: Resources, Methodology, Software. A.P.: Investigation, Validation. J.U.M.: Software, Resources, Data curation. M.S.: Conceptualization, Methodology, Writing – review & editing. A.V.: Conceptualization, Funding acquisition, Methodology, Supervision, Writing – review & editing, Writing – review & editing. A.S.: Conceptualization, Funding acquisition, Methodology, Supervision, Writing – original draft, Writing – review & editing.


