Imaging for the diagnosis of hepatocellular carcinoma: A systematic review and meta-analysis
Potential conflict of interest: Dr. Sirlin consults and is on the speakers' bureau for Bayer. He received grants from GE and Siemen's.
Supported by a contract from the American Association for the Study of Liver Diseases (to M.M.).
Abstract
Multiphasic computed tomography (CT) and magnetic resonance imaging (MRI) are both used for noninvasive diagnosis of hepatocellular carcinoma (HCC) in patients with cirrhosis. To determine if there is a relative diagnostic benefit of one over the other, we synthesized evidence regarding the relative performance of CT, extracellular contrast–enhanced MRI, and gadoxetate-enhanced MRI for diagnosis of HCC in patients with cirrhosis. We also assessed whether liver biopsy versus follow-up with the same versus alternative imaging is best for CT-indeterminate or MRI-indeterminate liver nodules in patients with cirrhosis. We searched multiple databases from inception to April 27, 2016, for studies comparing CT with extracellular contrast–enhanced MRI or gadoxetate-enhanced MRI in adults with cirrhosis and suspected HCC. Two reviewers independently selected studies and extracted data. Of 33 included studies, 19 were comprehensive, while 14 reported sensitivity only. For all tumor sizes, the 19 comprehensive comparisons showed significantly higher sensitivity (0.82 versus 0.66) and lower negative likelihood ratio (0.20 versus 0.37) for MRI over CT. The specificities of MRI versus CT (0.91 versus 0.92) and the positive likelihood ratios (8.8 versus 8.1) were not different. All three modalities performed better for HCCs ≥2 cm. Performance was poor for HCCs <1 cm. No studies examined whether adults with cirrhosis and an indeterminate nodule are best evaluated using biopsy, repeated imaging, or alternative imaging. Concerns about publication bias, inconsistent study results, increased risk of bias, and clinical factors precluded support for exclusive use of either gadoxetate-enhanced or extracellular contrast–enhanced MRI over CT. Conclusion: CT, extracellular contrast–enhanced MRI, or gadoxetate-enhanced MRI could not be definitively preferred for HCC diagnosis in patients with cirrhosis; in patients with cirrhosis and an indeterminate mass, there were insufficient data comparing biopsy to repeat cross-sectional imaging or alternative imaging. (Hepatology 2018;67:401-421).
Abbreviations
-
- CI
-
- confidence interval
-
- CT
-
- computerized tomography
-
- HCC
-
- hepatocellular carcinoma
-
- MRI
-
- magnetic resonance imaging
-
- NFS
-
- nephrogenic systemic fibrosis
Hepatocellular carcinoma (HCC) is unique among malignancies in having tumor characteristics on cross-sectional multiphasic contrast computed tomography (CT) or magnetic resonance imaging (MRI) that allow for a highly accurate diagnosis of HCC without an invasive biopsy.1-4 The ability of cross-sectional imaging studies to reliably detect and diagnose HCCs in the cirrhotic liver rests primarily on characterizing the enhancement of a suspected tumor relative to background liver in the hepatic arterial, portal venous, and subsequent phases.5 The differences in blood flow and extracellular volume between HCC tissues and non-neoplastic cirrhotic liver tissue lead to hallmark imaging characteristics during the multiphasic flow of contrast, including arterial phase hyperenhancement, subsequent washout appearance, and capsule appearance.6, 7 The pathophysiological underpinnings of arterial-phase hyperenhancement, washout appearance, and capsule appearance are complex and reviewed elsewhere.8 Also of fundamental importance is pretest probability: patients with cirrhosis have a high pretest probability of HCC and a low pretest probability of nonmalignant nodules that may resemble HCC at imaging. In such patients, nodules with the hallmark imaging features of HCC can be reliably diagnosed as HCC.9
While the imaging features distinctive of HCC can be observed both by multiphasic CT and MRI, MRI offers a number of additional imaging sequences that can be helpful in HCC diagnosis, including T2-weighted sequences, diffusion-weighted imaging, and, in combination with the use of a partially extracellular and partially hepatocellular contrast agent such as gadoxetate disodium, the ability to distinguish even relatively small and subtle lesions by hypointensity in the hepatobiliary phase.10-13 MRI has important diagnostic disadvantages, however, including greater technical complexity, higher susceptibility to artifacts, and less consistent image quality. In particular, MRI quality may be compromised in patients with difficulty breath-holding, trouble keeping still, or large-volume ascites. Also, although noncontrast MRI may detect tumor nodules, such sequences rarely provide sufficient specificity to enable noninvasive diagnosis of HCC. Thus, while noncontrast MRI may provide useful information, it does not reliably permit definitive diagnosis and staging of HCC in most patients. For these reasons, the comparative diagnostic performance of multiphasic CT and MRI in real-life practice remains uncertain.
Another area of controversy is the optimal management of patients in whom CT or MRI detects a nodule with some, but not all, of the hallmark features of HCC. The differential diagnosis for such nodules includes HCC, non-HCC malignancy, and nonmalignant entities. Because imaging does not establish a specific diagnosis in such cases, prior clinical practice guidelines by the American Association for the Study of Liver Diseases recommended biopsy for all liver lesions >1 cm initially detected by surveillance ultrasound and interpreted as indeterminate by diagnostic call-back CT and MRI.9, 13 The evidence supporting this recommendation was not provided, however. Due to the limitations of biopsy2, 14 and the complexities of working up suspected HCC, alternative strategies such as follow-up or alternative imaging may be preferable in individual cases.
We conducted this systematic review and meta-analysis to synthesize the existing evidence about the comparative performance of multiphasic CT and MRI with extracellular or gadoxetate contrast in the diagnosis of HCC in patients with underlying cirrhosis. While a number of systematic reviews and meta-analyses have examined the performance of CT and/or MRI in the diagnosis of HCC,15-24 relatively few studies have examined these imaging modalities in comparative studies in which CT was directly compared to either extracellular or partially extracellular and partially hepatocellular contrast agent MRI. A number of the publications included studies that were not directly comparative,15, 17-19, 21, 22 and some did not include more recent studies.16, 20 Two studies published since our analyses were performed provide some complementary information and are reviewed in the Discussion.22, 23 Also, we examined the available evidence supporting biopsy or additional imaging for indeterminate lesions in patients with cirrhosis.
Materials and Methods
We followed a predefined protocol developed by the HCC clinical practice guideline writing and systematic review committees of the American Association for the Study of Liver Diseases. We reported this systematic review according to the Preferred Reporting Items for Systematic Reviews and Meta-Analyses statement.25
ELIGIBILITY CRITERIA
Two questions were identified by the American Association for the Study of Liver Diseases practice guidelines committee. Table 1 describes detailed inclusion and exclusion criteria for the two questions of interest. For question 1, we included studies that enrolled adults diagnosed with cirrhosis and suspected HCC and compared multiphasic CT versus MRI with and without extracellular contrast or gadoxetate disodium. For question 2, we included studies that enrolled adults with cirrhosis and indeterminate hepatic lesion and compared biopsy, repeated imaging, or alternative imaging for the diagnostic evaluation.
| Q1 | Q2 | |
|---|---|---|
| Population | Adults with cirrhosis and suspected HCC | Adults with cirrhosis and an indeterminate nodule after contrast-enhanced CT or MR or CEUS |
| Intervention versus comparison | Diagnosis and staging of HCC with contrast-enhanced, multiphasic CT versus MR with and without extracellular contrast or gadoxetate disodium | Repeat imaging after observation period 2-3 months versus biopsy versus repeat alternative imaging technique |
| Outcomes | Accuracy of identifying and staging HCC | Survival, cost-effectiveness, stage at diagnosis, patient tolerance |
| Study design | Comparative studies | Comparative studies |
| Exclusions | Noncomparative studies that included either MRI or CT only; reviews, case reports, and studies with fewer than 5 patients | Noncomparative studies, reviews, case reports, and studies with fewer than 5 patients |
- Abbreviation: CEUS, contrast-enhanced ultrasonography.
SEARCH STRATEGY
A comprehensive search of several databases from each database inception to April 27, 2016, in any language was conducted. The databases included Ovid Medline In-Process & Other Non-Indexed Citations, Ovid MEDLINE, Ovid EMBASE, Ovid Cochrane Central Register of Controlled Trials, and Scopus. The search strategy was designed and conducted by an experienced librarian with input from the primary investigators. Supporting Tables S1 and S2 demonstrate the detailed search strategy for questions 1 and 2, respectively.
STUDY SELECTION
Using an online reference management system (DistillerSR; Evidence Partners, Inc.), two reviewers independently screened the titles and abstracts for potential eligibility. Full text versions of the included abstracts were retrieved and screened in duplicate. Disagreements were harmonized by consensus and, if not possible by consensus, through arbitration by a third reviewer.
DATA EXTRACTION
We extracted the following variables from each study: study characteristics including primary author, time period of study/year of publication and country of study; patient baseline characteristics including country, age, lesion number, lesion size, alpha-fetoprotein level, Child-Pugh score, and cause of cirrhosis; index and reference test characteristics; outcomes of interest. We extracted true-positive, false-positive, false-negative, and true-negative values of the index tests (MRI versus CT). Data extraction was done in duplicate.
METHODOLOGICAL QUALITY AND RISK OF BIAS ASSESSMENT
We used the Quality Assessment of Diagnostic Accuracy Studies 2 tool26 to assess the risk of bias and applicability of diagnostic accuracy studies. We assessed the following domains: patient selection, index test, reference standard, flow, and timing. Quality of evidence was evaluated using the Grading of Recommendations Assessment, Development, and Evaluation approach.27
STATISTICAL ANALYSIS
We calculated measures of diagnostic test accuracy (sensitivity, specificity, likelihood ratios, and diagnostic odds ratios) using a bivariate regression model, allowing for correlation between sensitivity and specificity. I2 >50% suggests high heterogeneity. Summary receiver operating characteristic curves were also estimated. Statistical analyses were conducted using Stata version 13 (StataCorp, College Station, TX). We calculated an interaction P value to estimate the statistical significance between the accuracy measures of the two index tests (MRI versus CT). A separate analysis of studies that only reported detection rates (without a 2 × 2 diagnostic table) was performed. In this subset of studies we pooled the detection rate with 95% confidence intervals (CIs) using Jeffreys method. We pooled log-transformed event rates with DerSimonian and Laird random-effect models. We assessed publication bias by examining funnel plot asymmetry and Egger's regression test. Subgroup and sensitivity analyses were done based on the cohort enrollment date (<2,000 and ≥2,000), the size of the hepatic lesion (<1 cm, 1-2 cm, and >2 cm), and the type of MRI contrast material used (gadoxetate-enhanced versus extracellular contrast–enhanced).
Results
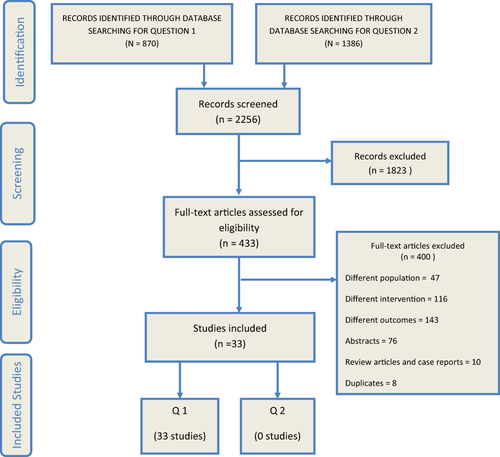
Our search strategy identified 2,256 citations. After screening titles and abstracts, a total of 433 were deemed eligible for full text retrieval. We eventually included 33 studies. Figure 1 demonstrates the study selection process.
Q1: WHAT IS THE DIAGNOSTIC ACCURACY OF MULTIPHASIC CT VERSUS MULTIPHASIC MRI IN ADULTS WITH CIRRHOSIS AND SUSPECTED HCC?
Nineteen studies3, 28-45 reported true-positive, false-positive, false-negative, and true-negative values, while 14 studies5, 46-58 reported only detection rate (sensitivity rate). Table 2 describes the detailed baseline characteristics of the included studies.
| Reference | Study Design/Country | CT Imaging Description | MRI fDescription | Patients (n) | Male (n) | Age (Years) | No. of Lesions | Tumor Size (cm) |
AFP Level (ng/mL) |
Child-Pugh Score | Gold Standard | Cause of Cirrhosis |
|---|---|---|---|---|---|---|---|---|---|---|---|---|
| Chen et al.28 | Retrospective/Japan | Dynamic contrast-enhanced CT | Gadoxetate disodium–enhanced MRI | 139 | 101 | 68 ± 11 | 139 | 0.05-3 | NR | NR |
Pathology (115) Benign imaging features with >1 year follow- up (24) |
NR |
| Golfieri et al.30 | Prospective/Italy | Quadruple-phase MDCT with contrast |
Dynamic 3D MRI performed following administration of gadopentetate dimeglumine |
63 | 53 | 63.3 | 123 | 1-3 | NR |
A 46 B 13 C 4 |
Transplant (10) Resection (6) Liver (8) biopsy 2-year follow-up (9) |
HBV = 22, HCV = 32 Alcoholic = 9 |
| Granito et al.46 | Prospective/Italy | Quadruple-phase MDCT using a helical CT scanner, contrast-enhanced | Gadoxetate disodium–enhanced MRI | 33 | 25 | 70 (48-84) | 48 | 1.8 (0.1-3) | 7 (1.8-375) |
A5 22 A6 6 B7 4 B8 1 |
Radiology Biopsy |
HCV = 19 HBV = 6 Cryptogenic = 4 NASH = 2 Alcohol = 1 PBC = 1 |
| Hassan, et al.32 | Retrospective/Kuwait | MDCT triphasic imaging with nonionic iodinated contrast agent | MRI with contrast (gadodiamide) | 61 | 37 | 46.5 (19-74) | 95 | 0.52 (0.04-1) | NR | NR |
Biopsy Radiological and clinical follow-up |
NR |
| Haradome et al.31 | Retrospective/multicenter |
MDCT scanner with 16 detector rows; all patients received intravenous nonionic contrast medium |
Gd-EOB-DTPA-enhanced MRI |
75 | 60 | 54.7 (42-67) | 86 | 1.74 ± 0.6 | NR |
A 48 B 5 C 1 |
Pathologic specimens: surgical resection (19) or fine needle biopsy (41) |
HCV (23), HBV (14), HCV+HBV (4), alcoholic (10), and cryptogenic (3) |
| Hayashida et al.47 | Retrospective/Japan |
A multidetector row CT scanner with four detector rows, triple-phase contrast- enhanced dynamic CT with nonionic contrast medium |
Dynamic MRI with gadolinium chelate |
38 | 23 | 72 (41-83) | NR | <3 | NR | NR |
Surgical resection (6) Percutaneous needle biopsy (11) Combination of clinical and radiological criteria (21) |
Ethanol = 3 HBV = 5 HCV = 26 HBV+HCV = 1 Autoimmune = 2 Cryptogenic = 1 |
| Hidaka et al.33 | Retrospective/Japan |
A 64-MDCT scanner with contrast |
Contrast-enhanced sequences with Gd-EOB-DTPA | 11 | NR | NR | 17 | <3 | 9.6 (3.2-506) | 9 (6-13) | Histopathological analysis |
HBV = 3, HCV = 7, Others = 1 |
| Hori et al.48 | Japan | Helical CT with contrast medium |
MRI with gadopentetate dimeglumine (Gd-DTPA) |
50 | 38 | 65 (42-81) | 125 |
<1 = 41 1-2 = 43 2-3 = 24 > = 324 |
NR | NR | Radiological |
HBV = 5, HCV = 44, non-B, non-C = 1 |
| Inoue et al.49 | Retrospective/Japan | MDCT scanning using 64 channels with nonionic contrast material | MRI with Gd-EOB-DTPA | 66 | 42 | 66 (54-84) | 86 |
2.1 (0.6-4.0) |
NR |
A 53 B 13 C 0 |
Pathological diagnosis |
HCV-related chronic hepatitis (16), HCV-related cirrhosis (30), HBV-related chronic hepatitis (9), HBV-related cirrhosis (11) |
| Jung et al.50 | Prospective/Germany | Biphasic contrast-enhanced spiral CT | Nonenhanced and Gd-EOB-DTPA-enhanced MRI | 40 | 29 | 66.4 (36-82) | 41 | 5.5 (1.5-12) | NR |
A 14 B 7 C 1, and unknown = 9 |
Pathological diagnosis | NR |
| Kasai et al.34 | Retrospective/Japan | Dynamic enhanced CT images with nonionic contrast material | Gd-EOB-DTPA MRI | 47 | 35 | 65.4 ± 9.1 | 112 | NR | NR | NR |
All available clinical information (including US, CT, MRI findings; laboratory data; histopathological findings; and radiologic follow-up examinations) |
NR |
| Kawada et al.51 | Retrospective/Japan | A 64-channel MDCT with a nonionic iodinated contrast agent |
Dynamic MRI with Gd-EOB-DTPA |
13 | 10 | 67 (51-77) | 15 | <2 | 95.3 (2-437) |
A 12 B 1 |
Pathological diagnosis by US-guided biopsy |
HCV = 8, HBV = 1, Alcoholic = 1, non-B, non-C = 3 |
| Khalili et al.35 | Retrospective/Canada | 64-detector CT scan with precontrast, arterial phase (20s after trigger), portal venous phase (60s), and delayed (equilibrium) phase (180s) |
MRI with gadobenate dimeglumine |
84 | 53 | 58 (22-79) | 101 | 1-2 | NR | NR |
Biopsy Growth of lesion on CT or MRI on follow-up over 18 months Recurrenceor metastasis after treatment |
HBV = 42 HCV = 28, Others = 14 |
| Leoni et al.36 | Italy | Helical multidetector quadruple-phase CT with contrast | Superparamagnetic iron oxide MR and gadolinium MR | 60 | 52 | 65.2 ± 10 |
1 = 46 2 = 13 3 = 1 |
1.8 (1-3) |
11 (2-2,849) |
A 40 B 18 C 2 |
Biopsy |
HCV = 33 HBV = 18 HBV+HCV = 1 Alchol = 6 Cryptogenic = 2 |
| Libbrecht et al.37 | Retrospective/Belgium | Dynamic helical CT with contrast |
MRI with dimeglumine gadopentetate or meglumine gadoterate |
49 | 32 | 53.4 ± 11.6 |
CT = 33 US = 77 MRI = 20 |
CT = 27.5 ± 10.6 MRI = 26.0 ± 11.5 |
NR | NR | Biopsy |
HBV = 9 HCV = 11 Cholestatic liver disease = 8 Alcohol = 12 Other or combination = 9 |
| Maiwald et al.38 | Prospective/Germany | Multiphase-64-slice contrast-enhanced CT | 3-Tesla MRI with Gd-EOB-DTPA | 50 | 42 | 60.6 (29-84) | NR | NR | NR |
A 27 B 16 C 7 |
Biopsy |
Alcoholic = 26, HBV = 2, HCV = 3, Hemochromatosis = 3, Budd-Chiari-syndrome = 1, NASH = 1, Cryptogenic = 14 |
| Di Martino et al.29 | Prospective/Italy | Multiphasic CT using a 64-slice | MRI with gadobenate dimeglumine | 140 | 104 | 66 (23-82) | 254 |
>2 cm, 1-2 cm, <1 cm |
NR |
A 71 B 43 C 26 |
Pathological findings or substantial growth at 12-month follow-up |
NR |
| Mita et al.52 | Retrospective/Japan | Helical CT with nonionic contrast medium | MRI with Gd-EOB-DTPA | 29 | 13 | 70.5 ± 7.96 | 34 | <2 cm |
<20 = 21 <21 = 8 |
NR | Pathological diagnosis |
HBV = 1, HCV = 24, Alcohol = 4 |
| Onishi et al.53 | Retrospective/Japan | Multiphasic CT performed using 8-channel CT (n = 9) or 64-channel CT (n = 22) with iodine and nonionic contrast medium |
MRI with gadoxetate disodium |
31 | 28 | 70.2 (52-82) | 73 |
<1.0 = 28 1-2 = 32 >2 = 13 |
NR |
A 23 B 8 C 1 |
Partial surgical resection (12) Biopsy (4) Liver transplantation (15) |
HBV = 4, HCV = 21, Alcoholic = 4, NASH = 1 |
| Park et al.54 | Retrospective/South Korea | A contrast-enhanced multiphasic helical CT, a 16-row MDCT scanner in 6 cases, a 64-row MDCT scanner in 49 cases, and a 128-row MDCT scanner in 12 cases |
MRI with gadoxetate disodium |
55 | 44 | 55 (28-73) | 67 | <3 cm | NR |
A 53 B 2 |
Pathologically confirmed |
Patients without cirrhosis = 17 (HBV = 13, HCV = 2, Unknown risk factor = 2) Patients with cirrhosis = 38 (HBV = 36, HCV = 1, Alcoholic = 1) |
| Pitton et al.55 | Cohort/Germany | Triphasic contrast-enhanced with a 64-row MDCT | MRI with dynamic contrast-gadolinium-DTPA | 28 | 25 | 67.0 ± 10.8 | NR |
MRI = 1.5 (0.5-14) CT = 1.2 (0.4-12.9) |
NR | 24 / 4 | Biopsy |
Ethanol = 13 HBV = 2 HCV = 7 Cryptogenic = 6 |
| Puig et al.39 | Italy | MDCT | MRI with gadolinium | 50 | NR | NR | 83 | NR | NR | NR | NR | NR |
| Rode et al.40 | Prospective/France | Noncontrast spiral CT | MRI with gadolinium | 43 | 30 | 51 (27-65) | 59 | 1.24 | NR | NR | Pathological |
HBV = 4 HCV = 19 Alcoholism = 14 Biliary disease = 2 Autoimmune hepatitis = 1 Wilson disease = 1 Cryptogenic = 1 |
| Sangiovanni et al.3 | Prospective/Italy | A 64-row MDCT with iodinated contrast medium | Dynamic MRI with gadolinium | 64 | 47 | 65 (44-80) | 67 |
<1 = 2 1-2 = 55 >2 = 2 |
11 (1-2,156) |
A 63 B 1 |
Fine-needle biopsy | NR |
| Sano et al.41 | Retrospective/Japan |
A 16–detector row dynamic contrast material–enhanced CT |
Gadoxetate disodium–enhanced MRI | 64 | 47 | 67 ± 9.3 | 108 | 0.4-2 | NR |
A 54 B 10 |
Pathologic diagnosis | NR |
| Serste et al.42 | Case-only, observational study/France |
Multidetector, multiphasic CT before and after contrast medium |
Dynamic MRI | 74 | 58 |
60 (38-88) |
56 | 1-2 | 8 (1-413) | NR | Biopsy |
HCV = 33 HBV = 20 No cirrhosis = 13 |
| Sugimoto et al.56 | Retrospective/Japan | Helical with precontrast and postcontrast with nonionic contrast medium |
Dynamic contrast-enhanced MRI and enhanced (Gd-EOB-DTPA) MRI |
27 | 13 | 71.5 ± 5.99 | 27 | < 2 |
Hypovascular HCC = 7.7 ± 5.4 Hypervascular HCC = 53.7 ± 118.9 |
NR | Biopsy |
HBV = 1, HCV = 19, Alcohol = 6 Non-HBV/HCV = 1 |
| Sun et al.43 | South Korea | 8-, 16-, and 64-MDCT scanners with no contrast | Gadoxetate disodium–enhanced MRI | 69 | 56 | 55.8 (39-73) | 97 |
HCC = 1.37 ± 0.41 Arterial enhancing pseudolesions = 1.09 ± 0.26 |
NR | NR |
Histopathological confirmation (16) Combination of CT, angiographic findings, lipiodol CT, and AFP levels (28) |
HBV = 56 HCV = 6 Alcohol abuse = 3 Unknown = 4 |
| Toyota et al.57 | Retrospective/Japan |
Contrast-enhanced MDCT, a 64-detector or a 128-detector CT |
Gd-EOB dual gradient-recalled echo (GRE) MRI |
50 | 32 | 68.8 (50-89) | 57 | 2.24 (0.6-8.7) | NR |
A 49 B 1 C 0 |
Histopathology |
HCV = 26 HBV = 18 NASH = 2 Alcoholic = 1 Cryptogenic hepatitis = 3 |
| Tsurusaki et al.58 | Prospective/Japan |
A 64–detector row MDCT unit with contrast material |
Gadoxetate disodium–enhanced MRI | 54 | 39 | 63 (35-84) | 83 | NR | NR |
A 53 B 1 |
Histopathological examination, | HBV = 12 HCV = 34 Non-B, non-C = 8 |
| Ueda et al.44 | Retrospective/Japan |
Noncontrast spiral CT, then spiral CT with contrast |
Dynamic MRI | 512 | 385 | 54.6 (29-84) | 61 | NR | NR | NR |
Angiographic and follow-up findings were used as the gold standard if the lesion was not confirmed histologically |
HBV and/or HCV = 251 Liver cirrhosis = 186 PBC = 9 Alcoholic fibrosis = 66 |
| Xing et al.45 | Prospective/China | Triphasic CT with contrast | Gadoxetate disodium–enhanced MRI | 39 | NR | NR | NR | NR | NR | NR | NR | NR |
| Yamashita et al.5 | Japan | Helical CT with contrast material | Gadolinium-enhanced dynamic or gadopentetate dime- glumine MRI | 50 (42 included in the analysis) | 28 | 67 (48-83) | NR | 1.9 (0.5-3) | NR | NR | Biopsy | NR |
- Abbreviations: AFP, alpha-fetoprotein; Gd-EOB-DTPA, gadolinium-ethoxybenzyl-diethylenetriamine penta-acetic acid HBV, hepatitis B virus; HCV, hepatitis C virus; MDCT, multidetector CT; NASH, nonalcoholic steatohepatitis; NR, not reported; PBC, primary biliary cirrhosis; US, ultrasound.
Methodological Quality of the Included Studies
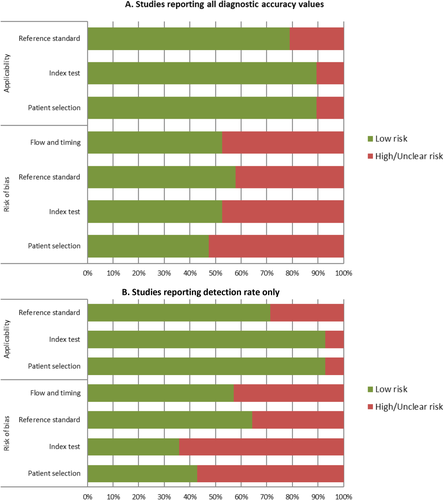
The overall risk of bias of the 19 studies (Fig. 2A) that reported all diagnostic accuracy values was low to moderate. Almost 50% of the studies were judged to have low risk of bias in terms of patient selection, index test, reference standard, flow, and timing. The majority of the studies were considered to have a low risk of bias on applicability to clinical practice in terms of reference standard, index test, and patient selection. The risk of bias for the remaining 14 studies that reported detection rate only was considered low to moderate (Fig. 2B). Detailed assessment of the methodological quality of the studies is provided in Table 3.
| Risk of Bias | Applicability | ||||||
|---|---|---|---|---|---|---|---|
| Reference | Could the selection of patients have introduced bias? | Could the conduct or interpretation of the index test have introduced bias? | Could the reference standard, its conduct, or its interpretation have introduced bias? | Could the patient flow have introduced bias? | Are there concerns that the included patients and setting do not match the review question? | Are there concerns that the index test, its conduct, or interpretation differ from the review question? | Are there concerns that the target condition as defined by the reference standard does not match the question? |
| Chen et al.28 | High | Low | Low | Low | Low | Low | low |
| Golfieri et al.30 | Low | Unclear | High | High | Low | Low | low |
| Granito et al.46 | Low | Low | Unclear | Unclear | Low | Low | low |
| Haradome et al.31 | High | Low | Low | Low | Low | Low | unclear |
| Hassan et al.32 | Unclear | Unclear | High | High | High | High | unclear |
| Hayashida et al.47 | Low | Unclear | High | Unclear | Low | Low | low |
| Hidaka et al.33 | High | Unclear | Low | Unclear | Low | Low | low |
| Hori et al.48 | Low | Unclear | High | High | Low | Unclear | unclear |
| Inoue et al.49 | High | Unclear | Low | Low | Low | Low | low |
| Jung et al.50 | High | Low | Low | Low | Low | Low | low |
| Kasai et al.34 | Low | Unclear | High | High | Low | Low | low |
| Kawada et al.51 | Unclear | Unclear | Low | Low | High | Low | low |
| Khalili et al.35 | Low | Low | Low | Low | Low | Low | low |
| Leoni et al.36 | Low | Low | Unclear | Unclear | Low | Low | low |
| Libbrecht et al.37 | High | Unclear | Low | Low | Low | Low | low |
| Maiwald et al.38 | Low | Low | High | High | Low | Low | low |
| Di Martino et al.29 | Low | Unclear | Low | Low | Low | Low | low |
| Mita et al.52 | High | Unclear | Low | Low | Low | Low | low |
| Onishi et al.53 | High | Low | High | High | Low | Low | unclear |
| Park et al.54 | High | Low | Low | Low | Low | Low | low |
| Pitton et al.55 | Low | Unclear | High | Unclear | Low | Low | low |
| Puig et al.39 | Low | Low | Unclear | Unclear | Low | Low | low |
| Rode et al.40 | Low | Unclear | Low | Low | Low | Low | low |
| Sangiovanni et al.3 | Low | Low | Low | Low | Low | Low | low |
| Sano et al.41 | High | Low | Low | Low | Low | Low | low |
| Serste et al.42 | High | Low | Low | Low | Low | Low | low |
| Sugimoto et al.56 | High | Unclear | Low | Low | Low | Low | low |
| Sun et al.43 | Low | Low | Low | Low | Low | Low | low |
| Toyota et al.57 | High | Low | Low | Low | Low | Low | unclear |
| Tsurusaki et al.58 | Low | High | Low | Low | Low | Low | low |
| Ueda et al.44 | High | Unclear | High | High | Low | Low | unclear |
| Xing et al.45 | Unclear | Unclear | Unclear | Unclear | Unclear | Unclear | unclear |
| Yamashita et al.5 | Low | Unclear | Low | High | Low | Low | high |
Pooled Analysis of Diagnostic Accuracy
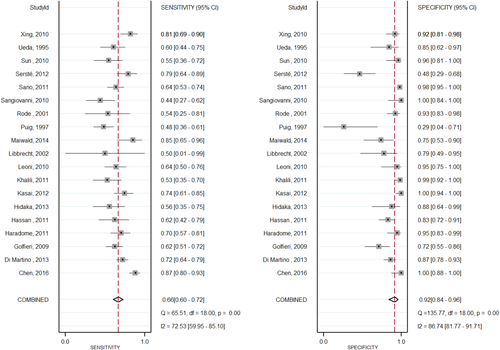
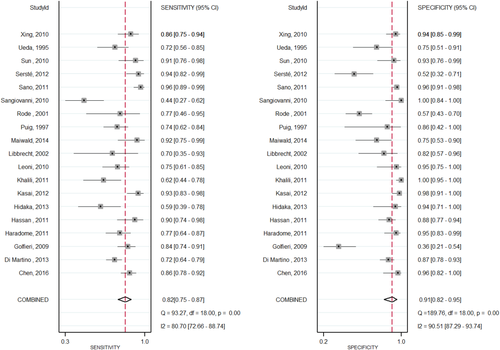
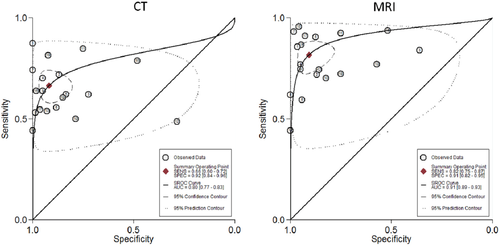
Nineteen studies3, 28-45 compared the diagnostic accuracy of MRI versus CT in detecting HCC. Compared to CT, MRI with an extracellular agent, or MRI with gadoxetate disodium showed a significantly higher sensitivity (0.82; 95% CI, 0.75-0.87; I2 = 80.74; versus 0.66; 95% CI, 0.60-0.72; I2 = 72.53) and lower negative likelihood ratio (0.20; 95% CI, 0.15-0.28; versus 0.37; 95% CI, 0.30-0.44) in diagnosis of HCC lesions. No significant difference was found for the pooled specificity, positive likelihood ratio, or diagnostic odds ratio. Figures 3 and 4 illustrate sensitivity and specificity forest plots of CT and MRI, respectively. Analysis of the receiver operating characteristic area under the curve (Fig. 5) showed that accuracy of MRI for detection of HCC was 0.91 (95% CI, 0.89-0.93) compared to 0.80 (95% CI, 0.77-0.83) for CT. Sensitivity analysis was done to exclude two cohorts39, 44 that enrolled patients before 2000; no change in the results was found. Table 4 shows the diagnostic accuracy of CT versus MRI for diagnosis of HCC.
| Modality | Studies (n) |
Sensitivity (95% CI) I2 (%) |
P |
Specificity (95% CI) I2 (%) |
P |
+ Likelihood Ratio (95% CI) |
P |
– Likelihood Ratio (95% CI) |
P |
Diagnostic Odds Ratio (95% CI) |
P |
|---|---|---|---|---|---|---|---|---|---|---|---|
| All studies irrespective of cohort year | |||||||||||
| Contrast-enhanced CT | 19 |
0.66 (0.60-0.72) I2 = 72.53 |
0.0003 |
0.92 (0.84-0.96) I2 = 86.74 |
0.83 | 8.1 (4.1-16.2) | 0.86 | 0.37 (0.30-0.44) | 0.001 | 22 (10-50) | 0.24 |
| MRI with and without contrast | 19 |
0.82 (0.75-0.87) I2 = 72.90 |
0.91 (0.82-0.95) I2 = 89.81 |
8.8 (4.6-16.9) | 0.20 (0.15-0.28) | 43 (20-92) | |||||
| All cohorts started in the year 2000 or later | |||||||||||
| Contrast-enhanced CT | 17 |
0.69 (0.63-0.76) I2 = 73.9 |
0.002 |
0.94 (0.87-0.98) I2 = 88.93 |
0.82 | 11.9 (5.1-27.7) | 0.96 | 0.32 (0.26-0.40) | 0.01 | 37 (15-90) | 0.3 |
| MRI | 17 |
0.84 (0.77-0.90) I2 = 86.18 |
0.93 (0.84-0.97) | 12.3 (5.1-29.5) | 0.17 (0.11-0.25) | 73 (29-181) | |||||
Subgroup Analysis
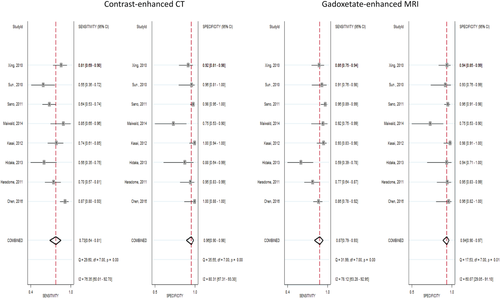
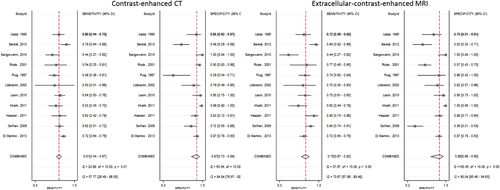
Subgroup analysis was done based on the type of MRI contrast material. Eight studies28, 31, 33, 34, 38, 41, 43, 45 evaluated gadoxetate-enhanced MRI versus CT, and 11 studies3, 29, 30, 32, 35-37, 39, 40, 42, 44 evaluated extracellular contrast–enhanced MRI versus CT in detecting HCC. Pooled analysis demonstrated that both gadoxetate-enhanced MRI and extracellular contrast–enhanced MRI provided significantly higher sensitivity and lower negative likelihood ratio than CT. No significant difference was noticed in the pooled specificity, positive likelihood ratio, and diagnostic odds ratio. Figures 6 and 7 illustrate the forest plots of sensitivity and specificity of gadolinium ethoxybenzyl contrast MRI and extracellular contrast only MRI versus CT, respectively.
Subgroup analysis was done based on the size of the hepatic focal lesion. MRI with an extracellular agent showed a significantly higher sensitivity compared to CT for both hepatic lesions >2 cm (0.88; 95% CI, 0.80-0.93; I2 = 70.5; versus 0.79; 95% CI, 0.70-0.86; I2 = 88.2) and <1 cm (0.69; 95% CI, 0.54-0.81; I2 = 94.6; versus 0.48; 95% CI, 0.34-0.62; I2 = 52). No differences were found in the pooled specificity, negative likelihood ratio, positive likelihood ratio, and diagnostic odds ratio. Also, no differences were identified in pooled performance characteristics between MRI with an extracellular agent and CT for 1-2 cm HCCs or between MRI with gadoxetate and CT for <2 cm HCCs. Table 5 presents subgroup analysis of the diagnostic accuracy of MRI versus CT for the detection of HCC. The sensitivity of contrast-enhanced CT versus gadoxetate-enhanced MRI was 0.73 versus 0.87, with a P value of 0.02, while the sensitivity of contrast-enhanced CT versus extracellular contrast MRI was 0.61 versus 0.75, with a P value of 0.006. The negative likelihood ratio for contrast-enhanced CT versus gadoxetate-enhanced MRI was 0.28 versus 0.13, with a P value of 0.01, while the sensitivity of contrast-enhanced CT versus extracellular contrast MRI was 0.45 versus 0.29, with a P value of 0.002.
| Variable | Modality | Studies (n) |
Sensitivity (95% CI) I2 (%) |
P |
Specificity (95% CI) I2 (%) |
P |
+ Likelihood Ratio (95% CI) |
P |
– Likelihood Ratio (95% CI) |
P |
Diagnostic Odds Ratio (95% CI) |
P |
|---|---|---|---|---|---|---|---|---|---|---|---|---|
| Subgroup analysis based on type of MRI contrast material | ||||||||||||
| Gadoxetate contrast only MRI | Contrast-enhanced CT | 8 |
0.73 (0.64-0.81) I2 = 76.35 |
0.02 |
0.96 (0.90-0.98) I2 = 80.31 |
0.47 | 18.0 (7.2-45.4) | 0.77 | 0.28 (0.20-0.38) | 0.01 | 65 (23-179) | 0.41 |
| Gadoxetate MRI | 8 |
0.87 (0.79-0.93) I2 = 78.12 |
0.94 (0.90-0.97) I2 = 60.07 |
15.3 (8.3-28.3) | 0.13 (0.08-0.22) | 115 (47-278) | ||||||
| Extracellular contrast only MRI | Contrast-enhanced CT | 11 |
0.61 (0.54-0.67) I2 = 57.77 |
0.006 |
0.87 (0.73-0.94) I2 = 84.84 |
0.91 | 4.5 (2.2-9.3) | 0.73 | 0.45 (0.38-0.54) | 0.002 | 10 (4-23) | 0.31 |
| Extracellular contrast MRI | 11 |
0.75 (0.67-0.82) I2 = 73.67 |
0.86 (0.68-0.95) I2 = 90.04 |
5.5 (2.3-13.1) | 0.29 (0.23-0.36) | 19 (8-45) | ||||||
| Subgroup analysis based on size of hepatic lesion | ||||||||||||
| 1-2 cm | Contrast CT | 6 |
0.64 (0.58-0.70) I2 = 61.79 |
0.15 |
0.88 (0.82-0.92) I2 = 90.89 |
0.78 | 6.2 (1.83-20.86) | 0.89 | 0.45 (0.39-0.54) | 0.47 | 13 (4.8-39.6) | 0.78 |
| Extracellular MRI | 6 |
0.70 (0.64-0.75) I2 = 80.4 |
0.87 (0.81-0.91) I2 = 92.1 |
5.5 (1.6-18.3) | 0.39 (0.27-0.55) | 17 (5.1-62.4) | ||||||
| >2 cm | Contrast CT | 3 |
0.79 (0.70-0.86) I2 = 88.2 |
0.09 |
0.9 (0.76 - 0.97) I2 = 0 |
0.71 |
6.46 (2.72-15.32) I2 = 0 |
0.99 |
0.26 (0.07-0.95) I2 = 88.8 |
0.5 |
25.79 (2.8-237.96) I2 = 65.1 |
0.47 |
| Extracellular MRI | 3 |
0.88 (0.80-0.93) I2 = 70.5 |
0.87 (0.73-0.96) I2 = 0 |
6.48 (2.98-14.07) I2 = 0 |
0.15 (0.05-0.5) I2 = 78.3 |
64.66 (19.13-218.55) I2 = 0 |
||||||
| <2 cm | Contrast CT | 2 |
0.68 (0.55-0.79) I2 = 23.2 |
0.31 |
0.98 (0.90-1) I2 = 13.3 |
0.9 |
21.50 (4.32-106.9) I2 = 0 |
0.9 |
0.35 (0.23-0.55) I2 = 29.7 |
0.3 |
57.46 (9.89-333.97) I2 = 0 |
0.73 |
| Gadoxetate MRI | 2 |
0.76 (0.67-0.84) I2 = 0 |
0.96 (0.87-0.99) I2 = 0 |
20.39 (5.2-80.01) I2 = 0 |
0.25 (0.16-0.40) I2 = 0 |
86.5 (17.91-417.99) I2 = 0 |
||||||
| <1 cm | Contrast CT | 2 |
0.48 (0.34-0.62) I2 = 52 |
0.049 |
0.69 (0.51-0.83) I2 = 0 |
0.08 |
1.54 (0.88-2.70) I2 = 0 |
0.55 |
0.77 (0.55-1.08 I2 = 0 |
0.72 |
2.05 (0.84-5.04) I2 = 0 |
0.8 |
| Extracellular MRI | 2 |
0.69 (0.54-0.81) I2 = 94.6 |
0.46 (0.29-0.63) I2 = 84.3 |
1.27 (0.96-1.68) I2 = 0 |
0.63 (0.22-1.77) I2 = 61.3 |
2.3 (0.80-6.55) I2 = 0 |
||||||
| Combination of <1 cm + <2 cm | Contrast CT | 4 |
0.58 (0.44-0.70) I2 = 61.6 |
0.2 |
0.91 (0.60-0.99) I2 = 81.5 |
0.7 | 6.6 (1-43.6) | 0.7 | 0.47 (0.30-0.72) | 0.37 | 14 (1-137) | 0.9 |
| MRI | 4 |
0.74 (0.50-0.89) I2 = 86.28 |
0.83 (0.43-0.97) I2 = 92 |
4.4 (1-20.5) | 0.31 (0.14-0.69) | 1 4 (2-104) | ||||||
Analysis of Studies That Reported Detection Rate Only
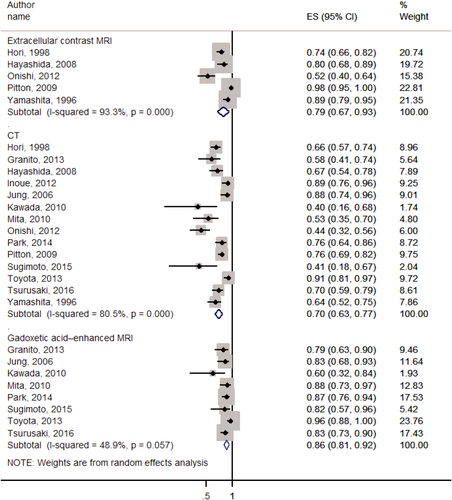
Fourteen studies5, 46-58 compared MRI versus CT and reported only detection/sensitivity rate. Pooled analysis (Fig. 8) showed that detection/sensitivity rate and heterogeneity of CT, extracellular contrast–enhanced MRI, and gadoxetate-enhanced MRI were 0.70 (95% CI, 0.63-0.77; I2 = 80.5%; P < 0.001; 0.79; 95% CI, 0.67-0.93; I2 = 93.3%; P < 0.001; and 0.86; 95% CI, 0.81-0.92; I2 = 48.9%; P = 0.057, respectively). Stratified analyses based on the size of hepatic lesions and the degree of HCC differentiation are shown in Supporting Figs. S9-S13.
Publication Bias
Visual inspection of the funnel plot suggests possible publication bias (Supporting Fig. S14), which is consistent with the results of Egger's regression test (P = 0.04).
Quality of Evidence
The quality of evidence (i.e., certainty in the estimates) is considered low to moderate, downgraded due to the methodological limitations of the included studies and possible publication bias.
Q2: ADULTS WITH CIRRHOSIS AND AN INDETERMINATE HEPATIC NODULE UNDERGO A BIOPSY, REPEATED IMAGING, OR ALTERNATIVE IMAGING FOR THE DIAGNOSTIC EVALUATION
No studies were found eligible to answer this population, intervention, comparison, and outcomes question.
Discussion
MAIN FINDINGS
We identified 33 studies in this systematic review which evaluated the performance of multiphasic cross-sectional contrast CT in comparison to contrast MRI performed with extracellular contrast agent or with the partially extracellular/partially hepatocellular agent gadoxetate. Nineteen of the studies assessed all parameters for determining the diagnostic accuracy of the tests, while 14 reported only the detection rate or sensitivity of the tests. Pooled analysis of the 19 studies that compared the diagnostic accuracy of MRI to CT showed a significantly higher sensitivity (0.82 versus 0.66) as well as a significantly lower negative likelihood ratio (0.20 versus 0.37) for MRI over CT. However, the specificity was 0.91 for MRI versus 0.92 for CT, and the positive likelihood ratios of 8.8 for MRI versus 8.1 for CT were not different (Table 4). Overall, the summary receiver operating characteristic curves showed a higher area under the curve of 0.91 for MRI versus 0.80 for CT. The results were similar when considering only the 17 studies started in the year 2000 or later (Table 4).
In subgroup analyses by type of MRI contrast material, similar observations were made with an absolute 14% increase in sensitivity for gadoxetate-enhanced MRI and for extracellular contrast–enhanced MRI over CT (Table 5). There was an unexplained better performance of cross-sectional imaging overall in the studies comparing CT to gadolinium ethoxybenzyl contrast, potentially suggestive of an unknown systematic bias in these studies.
In subgroup analyses by lesion size, MRI showed higher per-lesion sensitivity for <1 cm HCCs and for >2 cm HCCs but not for 1-2 cm HCCs or for <2 cm HCCs. Moreover, although the sensitivity of MRI for <1 cm HCCs was higher compared to CT (0.69 versus 0.49), specificity at a trend level was lower (0.46 versus 0.69).
Our results are similar to those of recent systematic reviews and meta-analyses, which found that multiphasic MRI is more sensitive than CT, while maintaining similar specificity.18-23 The one meta-analysis published since our analysis was performed included studies in which there was no direct comparison between CT and MRI and is therefore complementary to ours.23 The major distinguishing feature of this study was the inclusion of only those studies that directly compared CT with MRI, thus reducing potentially substantial biases in studies without direct performance comparisons. In particular, the reported accuracy of imaging for HCC diagnosis depends on multiple factors that may vary across studies, including population characteristics (e.g., severity of cirrhosis, degree of portal hypertension, and frequency of obesity) and applied reference standard (e.g., follow-up imaging, biopsy, hepatectomy pathology). Restricting our analysis to articles reporting within-study performance helps mitigate the confounding effects of these variables. Other distinguishing features of our study compared to some meta-analyses15-17, 20, 21, 23 were the inclusion of CT, extracellular agent MRI, and gadoxetate-MRI and the subanalyses by contrast material and lesion size.
STRENGTHS AND LIMITATIONS
While multiphasic MRI appears to be marginally more sensitive than CT in the pooled analysis of comparative studies, examination of the data suggested possible publication bias, and the quality of the evidence was considered to be low to moderate, with particular concerns including the methodological limitations of the studies and inconsistencies across studies. Consequently, the differences in pooled diagnostic performance are considered insufficient to definitively recommend MRI over CT. Key factors driving this conclusion include the overall low quality of the evidence, practical concerns about generalizability to nonacademic settings, and recognition that multiple factors beyond diagnostic accuracy inform the optimal selection of imaging modalities in individual patients.
Compared to multiphasic CT, multiphasic MRI has the advantages of providing greater soft tissue contrast, more detailed evaluation of nodule and background liver tissue characteristics, and absence of exposure to ionizing radiation. However, MRI also has important disadvantages, including greater cost, higher technical complexity, longer scan times, increased tendency to artifact, and less consistent image quality due to patient factors such as difficulty with breath-holding, difficulty holding still, or high-volume ascites. MRI also has a larger variety of contraindications, and—particularly outside the United States—substantially less availability, leading to longer wait times for imaging.
In contrast, CT is more readily available and faster and, due to more wide open scanner bores, less likely to provoke claustrophobia but has the shortcoming of exposing patients to radiation. Both CT and MRI require intravenous access and contrast agents, the use of which may be problematic in patients with acute kidney injury or chronic renal failure.
The choice between CT and MRI also depends on patient safety preferences as both modalities are associated with potential downstream adverse health consequences including the incompletely understood long-term effects of exposure to ionizing radiation (CT) and gadolinium deposition (MRI). Because those risks are difficult to quantify and predict, individual patient preferences should be considered. Additionally, MRI with gadolinium-based agents may be preferable in patients with mild to moderate chronic kidney disease due to the reduced risk of contrast-induced nephrotoxicity, while patients with end-stage kidney disease on dialysis should probably undergo CT with iodinated agents to prevent the rare development of nephrogenic systemic fibrosis (NSF). Contrast-enhanced imaging should be rescheduled for patients with acute kidney injury if possible. In regard to the risk of NSF from use of MRI contrast agents in patients with chronic renal failure, while there have been some publications suggesting that newer MRI contrast agents may be associated with increased risk of NSF, there is insufficient evidence from well-controlled studies to address this question. A prospective, multicenter, nonrandomized phase 4 study of gadoxetate disodium including patients with moderate (n = 193) and severe (n = 85) renal impairment did not raise any clinically significant safety concern, and no NSF cases were observed.
CLINICAL AND RESEARCH IMPLICATIONS
- Patients with ascites: Ascites can introduce severe artifacts on MRI, especially at 3 tesla. Such patients may be better off with CT. If MRI is pursued, 1.5T scanning should be considered.
- Poor breath-holders: Poor breath-holders may be better off with CT for the same reason. Robust free-breathing sequences are under development and someday may eliminate this problem, but such sequences are not yet widely available
- Liver decompensation and/or severe iron overload: Gadoxetate disodium uptake by the liver tends to be reduced in patients with decompensated liver disease. In patients with severe iron overload, the uptake may be preserved, but the ability of the agent to enhance the liver and characterize lesions may be compromised. In such patients, extracellular contrast agent MRI or CT may be preferable.
- Contrast agent contraindications: CT and MRI contrast agents may be contraindicated in some patients due to safety concerns, while other patients may refuse contrast agents or have inadequate intravenous access. In such patients, noncontrast MRI may be best. Contrast-enhanced ultrasound is another option in patients in whom CT or MRI is contraindicated for safety considerations; but this modality has only recently been approved in the United States, and the requisite expertise for its application is not yet widespread.
- Gadoxetate-MRI is more sensitive for <2 cm HCCs than CT or extracellular contrast agent MRI. Thus, gadoxetate-MRI may be the preferred modality in clinical practice paradigms (such as in Asia) that emphasize aggressive locoregional treatment or excision of small HCC lesions.
- Extracellular contrast agent MRI and CT are marginally more specific for <2 cm HCCs than gadoxetate-MRI. Thus, the former two modalities may be preferred in clinical practice paradigms (such as in the United States) that emphasize liver transplantation for treating early-stage HCC without requiring biopsy confirmation.
The results of this systematic review highlight the need for rigorously designed and executed comparative studies that can reliably answer the question of the relative performance of multiphasic CT versus extracellular contrast–enhanced or gadoxetate-enhanced MRI and comparison of gadoxetate-enhanced MRI versus extracellular contrast–enhanced MRI. An additional question related to imaging for HCC is whether adults with cirrhosis and an indeterminate hepatic nodule are best served by diagnostic evaluation using biopsy, repeated imaging, or alternative imaging. As there was a complete lack of applicable studies identified by the search strategy, this is a critical area for future research.


