Single-cell DNA and surface protein characterization of high hyperdiploid acute lymphoblastic leukemia at diagnosis and during treatment
Graphical Abstract
Abstract
High hyperdiploid (HeH) B-cell acute lymphoblastic leukemia (B-ALL) is the most prevalent subtype of childhood ALL. This leukemia is characterized by trisomies and tetrasomies of specific chromosomes and additional point mutations. Here, we used single-cell targeted DNA and antibody sequencing to determine the clonal evolution of HeH B-ALL during development and chemotherapy treatment. Chromosomal copy number changes were mostly stable over all the leukemia cells, while mutations were typically subclonal. Within all 13 cases, at least one RAS mutant (KRAS or NRAS) subclone was detected (range: 1 to 4 subclones with RAS mutations), indicating the importance of RAS signaling in HeH B-ALL development. NSD2 mutations were detected in 4 out of 13 cases and always in a subclone with RAS signaling mutations. Single-cell DNA sequencing detected residual leukemia cells during chemotherapy treatment, and analysis of chromosomal copy number changes aided in the accurate detection of these cells. Our single-cell data demonstrate that chromosomal changes are acquired prior to additional mutations and that RAS signaling mutations are present in all HeH cases, often as subclonal mutations. This single-cell multi-omics study enabled us to extensively characterize the genetic and surface protein heterogeneity in patients with HeH B-ALL.
INTRODUCTION
Acute lymphoblastic leukemia (ALL) is the most common childhood cancer and can be subdivided into B cell ALL (B-ALL, approximately 85% of cases) and T cell ALL (T-ALL, approximately 15% of cases).1 B-ALL can be further classified according to genetic subtype, with high hyperdiploid (HeH) B-ALL being the most common subtype in children, representing around 25% of cases.2 HeH B-ALL is generally associated with a good prognosis.3-5 However, because of its high prevalence, HeH B-ALL still accounts for 15%–25% of all relapses in children with B-ALL.3, 5
HeH B-ALL is defined as aneuploid leukemia with a chromosomal number that varies between 50 and 52 as a lower threshold and 58 and 67 as an upper threshold, cutoffs that vary slightly in different studies.6 In HeH B-ALL, specific chromosomes are gained, which most commonly includes a tetrasomy of chromosome 21 and additional trisomies of chromosome 4, 6, 10, 14, 17, 18, and X.6 HeH B-ALL typically develops in utero from a preleukemic precursor B cell with a high hyperdiploid karyotype.7 The initiating event (“first hit”) causing this aneuploidy in most patients is likely an erroneous cell division, during which the cell gains the additional chromosomes all at once.6 Woodward et al. proposed that an initial tripolar mitosis in a diploid cell followed by clonal evolution might be causing aneuploidy.8 In a fraction of individuals having this preleukemic clone, additional hits might occur, triggering the development of childhood HeH leukemia.9, 10 Previous studies using whole genome/exome sequencing identified recurrent RAS pathway mutations as important drivers of disease in about half of the HeH leukemias.11, 12 Moreover, children with germline mutations in RAS signaling (RASopathies) are at increased risk of developing B-ALL, with HeH B-ALL being the most common ALL subtype in patients with a specific PTPN11 germline mutation (Noonan syndrome).13
Measurable residual disease (MRD), the number of residual leukemia cells measured in the first months of treatment, is one of the most important and independent risk stratificators.14-18 MRD is typically measured at the end of induction (EOI), the first phase of chemotherapy treatment in ALL and typically around 30 days of treatment, and later at the end of consolidation (EOC), the second treatment phase. For B-ALL, MRD at EOI has shown the highest predictive value, with levels higher than 0.01% at EOI indicating a higher risk of relapse.19-21 Standard of care methods to detect MRD include multiparametric flow cytometry (MFC) to identify leukemia-associated immunophenotypes and PCR-based methods, for example, qPCR analysis of immunoglobulin or T cell receptor gene rearrangements. These technologies reach sensitivities of 10−4 for most flow cytometry panels up to 10−5 for PCR-based methods and for next-generation flow cytometry (e.g., the EuroFlow panel consisting of two 8-color tubes).22, 23 Even though higher MRD values correlate with a worse prognosis, the optimal MRD threshold varies by genetic risk group.24 For HeH B-ALL, an MRD threshold at EOI of 0.03% instead of 0.01% has been suggested.24, 25 By integrating MRD results and genetic risk subtypes, an optimization of risk stratification can be obtained. This allows for improved identification of children with high or low risk of relapse, as performed in the AIEOP-BFM ALL 2000 study,20 the St-Jude Study XV,16 the UKALL 1997-2003 trials,17 and more recently in the ALLTogether1 Trial (NCT04307576).
Previous studies investigating the genetic aberrations in HeH B-ALL have mostly used bulk sequencing approaches and focused on aneuploidy and chromosomal instability (CIN), on copy number variants (CNVs), and on small nucleotide variants (SNVs) occurring in HeH B-ALL.8, 11, 12, 26-33 While some studies have observed clonal heterogeneity of chromosomes in HeH B-ALL to some extent,8, 26, 30, 32, 34 there is limited knowledge about the heterogeneity of SNVs in this subtype. Targeted single-cell DNA sequencing (scDNA-seq) is the best way to investigate the clonal heterogeneity of SNVs in a highly detailed manner. Previous work of our lab in B-ALL has shown that only certain genetic subtypes, including HeH B-ALL and PAX5-altered B-ALL, did exhibit clonal heterogeneity based on SNVs at diagnosis.31 However, only a small cohort of HeH B-ALL patient samples was investigated in that study. Furthermore, the heterogeneity of surface proteins in HeH B-ALL has not yet been evaluated.
Even though patients with HeH B-ALL generally have a favorable risk profile, a better understanding of the biological complexity of HeH B-ALL might ultimately pave the way for novel diagnostic and treatment strategies. For instance, it could enable the implementation of lower-intensity treatment protocols for children who are at the lowest risk for relapse, which could decrease the short- and long-term side effects of chemotherapy. Therefore, we have extensively investigated the clonal heterogeneity of HeH B-ALL at diagnosis and at MRD timepoints using scDNA-seq combined with single-cell surface protein sequencing.
METHODS
Patient samples
Bone marrow (BM) and peripheral blood (PB) samples, obtained at diagnosis and during treatment, were collected from children and adults diagnosed with HeH B-ALL at the University Hospital in Leuven (UZ Leuven). The study acquired the necessary approval from the Ethical Committee of UZ Leuven, with written informed consent obtained from every patient in accordance with the Declaration of Helsinki. The adult patient (XF98) was treated according to HOVON100 and pediatric patients were treated either according to the European Organisation for Research and Treatment of Cancer (EORTC) 58081 protocol (XH135, XG111, XG115) or according to the ALLTogether1 Trial (NCT04307576, all remaining patients). Mononuclear cells were extracted from fresh BM and PB samples using Ficoll-Paque and were viably frozen. Single-cell sequencing data of two patients (XG111 and XG115) have been published before,31 but patient samples were re-sequenced with the new amplicon panel for this study.
Enrichment of samples during treatment
The MARS gentle cell separator (Applied Cells) was used to enrich B-ALL cells in patient samples collected during treatment (if enough cells were available). During sample preparation, cells were stained with antibodies conjugated to phycoerythrin (PE) dye, targeting human CD10 (Clone CB-CALLA, Cat: 12-0106-42; eBioscience), CD19 (Clone SJ25C1, Cat: 12-0198-42; eBioscience), and CD34 (Clone 563, Cat: 550619; BD Bioscience). After 1 wash, cells were stained with MARS anti-PE Magnetic Nanobeads (Applied Cells). Before enrichment, cells were counted using the MACSQuant VYB Flow Cytometer. Only the magnetic module of the MARS cell sorter was used for the enrichment of leukemic cells. After enrichment, positive and negative cell fractions were again counted using the MACSQuant VYB Flow Cytometer to estimate enrichment fraction of PE-positive cells. Enrichment fraction was calculated by dividing the percentage of PE-positive cells after MARS enrichment by the percentage of PE-positive cells before enrichment.
Single-cell DNA sequencing (scDNA-seq) and single-cell DNA and antibody sequencing (DAb-seq), Mission Bio Tapestri platform
Cryopreserved BM and PB samples were thawed, washed, and filtered using a 30 µm cell strainer. According to manufacturer requirements, cells were counted with LUNA automated cell counter, and cell suspensions of around 4000 cells/µL were prepared, with cell viabilities >80%. We performed scDNA-seq and DAb-seq according to the manufacturer's protocols, respectively (Tapestri Single-Cell DNA Sequencing V2 User Guide and Tapestri Single-Cell DNA + Protein Sequencing V2 or V3 User Guide), and scDNA-seq was performed as previously published.31, 34 For DAb-seq, samples were stained with the BioLegend TotalSeqTM-D Human Heme Oncology Cocktail prior to loading on the Tapestri Platform. We used a custom B-ALL amplicon panel, covering 414 variant hotspots across 39 frequently mutated genes in B-ALL. The panel was custom-designed based on most commonly reported single nucleotide variants (SNVs) and insertions and deletions (indels) in the PeCan pediatric cancer database35 of St. Jude Children's Research Hospital (Supporting Information S1: Figure S1A).
Data analysis
FastQ files rendered after sequencing were processed using the Tapestri Pipeline v2.0.2/v3.4, which generated loom, h5 files and calculated allelic dropout (ADO) rates per sample. Loom files were loaded in Tapestri Insights v2.2 software for prefiltering and downstream analysis. Low-quality cells and variants were removed according to 6 advanced filters, which were all but 1 (variants mutated in <0.5% of cells) set according to the manufacturer's recommendations. Variants were further filtered using R scripts as previously described.31, 34 Variants detected in >80% of patient samples of this cohort and variants annotated at the first or last 5 nucleotides of a given amplicon were removed, as these were most likely artifacts. Furthermore, we excluded intronic and synonymous variants and variants that were identified as being germline, either by being present in 100% of the cells or by being confirmed in remission samples by Sanger sequencing or scDNA-seq. Subsequently, variants with a large discrepancy between variant allele frequency (VAF) by read count and VAF by cell count were excluded. Finally, variants with a VAF between 40%–60%, or 30%–70% for variants on chromosomes known to have three copies based on HeH karyotype, were retained. The remaining variants were validated by loading h5 files in Tapestri Mosaic v3.4 software using the manufacturer's curated Jupyter notebooks and proceeding to CNV calling. In Mosaic, slightly different advanced filters are used (8 instead of 6), and similar to Insights software, recommended filtering was performed, except for two filters (minimum mutated percentage of cells <0.5% and zygosity-specific filter VAF_heterozygosity = 25). However, when analyzing the DNA mutations in the different cells, we noticed that a large number of cells were discarded from the DNA and CNV analyses due to missing genotypes. Custom Python code was written to rescue some of these cells that were labeled as “missing” (genotypes) for further CNV analyses. First, a reference data set was created that contains all mutational profiles of interest in the sample, that is, the mutational profile of all DNA clusters. Subsequently, the mutational profile of all cells with a missing genotype was compared to the reference mutational profiles of the DNA clusters by calculating the Hamming distance between them. The cell was then assigned to the cluster with the reference profile that has the lowest Hamming distance to its own while allowing maximum half of the genotypes to be missing. To avoid genotype assignment errors, we discarded cells in which the Hamming distance was equal to multiple reference mutational profiles.
To identify the non-leukemic cells in the samples, we used the amplicon coverage. First, the number of reads per amplicon was normalized. Subsequently, a dimensionality reduction was performed by determining the principal components (PCA) and subsequently applying the UMAP algorithm on the first PCA components (Supporting Information S1: Figure S2). Clusters were determined by the Louvain algorithm on a shared nearest-neighbor graph. By combining these (CNV) clusters with the DNA clusters (clusters based on the different mutations), we were able to identify clusters of cells with chromosomal copy number changes but without mutations (CH clone) and cells without chromosomal changes and without mutations (CN clone). This method failed for 1 sample (XJ178). In the cases where protein data was available, the nonleukemic cells were defined based on both the amplicon coverage and the expression of the cell surface markers, as these cells do not express typical B-ALL markers (e.g., CD10, CD19) but other specific markers of the immune cells.
For CNV calling, the algorithm required the selection of a good reference population consisting of assumably (diploid) wild-type cells. This was either subclone CN (nonleukemic cells without any detected mutations) or a selection of normal T cells, B cells, natural killer (NK) cells, and erythroid cells based on surface protein data. The algorithm then calculated the CNVs based on the median number of reads per amplicon per cell in comparison to the reference population. These CNVs could then be correlated back to the genetic subclones, that is, the clones based on the SNVs and small indels, found in each sample at diagnosis. The resolution for CNV calling was limited to the regions on the genome for which amplicons were included in the panel. By using this CNV calling in Mosaic, a variant was removed occasionally if it did not correspond to a HeH subclone.
Selection of DNA subclones and surface protein analysis
DNA subclones were initially identified using Tapestri Insights software. Unlike previous publications,31, 34 zygosity information was retained for each variant. However, Tapestri Mosaic software was used to identify ADO clones (ADO score > 0.8) with false-positive homozygous variant calling. These ADO subclones were excluded from further analyses. Moreover, Tapestri Mosaic v3.4 and v3.7 were used to analyze surface protein data, using manufacturer's curated Jupyter notebooks. We identified “sticky cells,” which are cells that bind most antibodies in an aspecific way (including some control IgG antibodies), with the function “sample.protein.label_sticky_cells()” in Mosaic v3.7. These cells were labeled “unspecific” in the figures. Phylogenetic trees of somatic variants at diagnosis were inferred using the single-cell inference of tumor evolution (infSCITE)36 software, as previously described.31 This was visualized using donut charts and phylogenetic trees. All other figures (bar plot, CNV and protein heatmap, protein Uniform Manifold Approximation and Projection (UMAP)) were generated using Tapestri Mosaic software.
Patient-derived xenograft (PDX)
Primary BM cells (1 × 10⁶ cells) were injected into the tail vein of immunodeficient NOD.Cg-Prkdcscid Il2rgtm1Wjl/SzJ (NSG) mice. All animal experiments were approved and supervised by the KU Leuven ethical committee. Every 2 weeks, expansion of leukemic cells was monitored by staining the PB for human CD45 (hCD45). After successful engraftment (hCD45 >50% in the PB), mice were sacrificed, and cells of the spleen were harvested and viably frozen for later scDNA-seq.
Data sharing statement
All single-cell DNA and antibody sequencing data (fastQ and vcf files) have been deposited at the European Genome-phenome Archive (EGA), hosted at the EMBL-EBI/CRG, with accession number EGAS50000000580.
RESULTS
HeH B-ALL is characterized by multiple subclones at diagnosis
To obtain more insight into the role of mutations in the development and progression of HeH B-ALL, we investigated the clonal heterogeneity of this type of leukemia at diagnosis. We performed high-throughput targeted single-cell DNA sequencing (scDNA-seq) of 13 samples (12 BM and 1 PB sample) of newly diagnosed HeH B-ALL cases, using a similar approach as previously described.31, 34 Patient characteristics can be found in Table 1. Standard genetic characterization at diagnosis was performed by conventional karyotyping, multiplex ligation-dependent probe amplification (MLPA), optical genome mapping (OGM), fluorescent in situ hybridization (FISH), and (reverse transcription) PCR. This confirmed leukemic cells with a high hyperdiploid karyotype in all cases, with typical trisomies of chromosomes 4, 6, 10, 17, 18, and X and a tetrasomy of chromosome 21. OGM provides a genome-wide overview of CNVs and structural variants at higher resolution than conventional karyotyping.37 Chromosomal gains and losses were readily picked up with the CNV pipeline, although care must be taken in case of hyper- and/or hypodiploid cases to ensure correct baseline ploidy calling. Differences can be observed between conventional karyotyping and optical mapping regarding the detection of subclones, as conventional karyotyping involves cell culture (which may stimulate the outgrowth of specific clones) while OGM cannot always call variants in small subclones (<15% of cells) depending on coverage (~300× in routine diagnostics).37
| Patient | Gender | Age group (y) | WBC count (cells/µL) | % blasts | Leukemia type | Genetics | Immunophenotype | Conventional karyotype and FISH | OGM formula | Risk group |
|---|---|---|---|---|---|---|---|---|---|---|
| XF98 | Male | 16–25 | 25,620 | 77 | BCP-ALL, type pre-B-ALL | High hyperdiploid, CDKN2A/B deletion, PAR1 duplicationa | Pos: CD19, cyCD79a, CD10 (stronger), CD20 (weak/partial), TdT (weak), CD34 (weak), cyIgM, CD22, HLA-DR, and neg: CD45 | 53-56,XY,+X,+Y[7],+4,+6,+8[7],+10[4],+14[5],+17[7],+21,+21[cp8]/46,XY[2] | / | / |
| XG111 | Female | 1–10 | 10,300 | 95.3 | BCP-ALL, type common B-ALL | High hyperdiploid | Pos: CD19, CD34, CD10 (stronger), TdT (weak), and weak to neg for CD45 and CD20 | 55,XX,+4,+6,+8,+10,+14,+17,+18,+21,+21[4]/46,XX[6] | ogm[GRCh38] (4)x3,(6)x3,(8)x3,(10)x3,(14)x3, (17)x3,(18)x3,(21)x4 | AR1 |
| XG115 | Female | 1–10 | 10,620 | 98.3 | BCP-ALL, type common B-ALL | High hyperdiploid, CDKN2A/B, ETV6 (exon 1) deletion, PAR1 duplicationa | Pos: cyCD79a, CD19, CD45 (neg to weak), CD10 (strong), TdT, CD34, CD22, HLA-DR and neg: CD20, cyIgM, sIgLambda, sIgKappa | 56,XX,+X,+4,+6,+8,+10,+17,+18,+21,+21,+mar[7]/55sl,t(15;15)(q21;q24),−17[2]/46,XX[2], FISH: trisomy Xp22/CRLF2 (no rearrangement), non-balanced IGH/14q32 rearrangement | ogm[GRCh38] (X)x3,(4)x3,(6)x3,(8)x3,9p21.3(21 636 919_23 285 480)x1,(10)x3,12p13.2(11 635 931_11 654 206)x1,(14)x3,t(14;14)(q11.2;q32.33)(22 422 983;106 294 644),(17)x3,(18)x3,(21)x4 | VLR |
| XH135 | Male | 1–10 | 18,700 | 95 | BCP-ALL, type common B-ALL | High hyperdiploid, CDKN2A/B deletion, ETV6, BTG1, EBF1 and PAR1 duplicationa | Pos: cyCD79a, TdT, CD10, CD19 (het), CD22, CD34. Weak to neg: CD45 and neg:CD20. Very weak and partial: cyIgM. | 60,XY,−5[5],+6,+8,+10, +11[5],+12,+14[5],+15,+16[5],+17,+18[3],+21,+21[5],+3-7mar, inc[cp6]/46,XY[3] – FISH: trisomy of Xp22-Yp11 | ogm[GRCh38] (X)x2,(4)x3,(5)x3,t(4;5)(q34.3;q31.1)(179 501 025;136 258 772),t(5;5)(q33.1;q35.3)(152 558 057;187 110 343),t(5;10)(q33.2;q23.31)(153 843 504;90 199 407),t(5;10)(q35.1;q24.2)(171 252 456;97 709 101),9p21.3(21 801 680_22 314 347)x1,(6)x3,(8)x3,(10)x4,(12)x3, 12p13.2(11 699 080_11 790 985)x1,(14)x3,(16)x3,(17)x3,(18)x3,(21)x4 | AR1 |
| XI145 | Female | 1–10 | 5410 | 89.7 | BCP-ALL, type common B-ALL | High hyperdiploida | Pos: CD45 (neg to weak), cyCD79a, CD19, CD34 (partial), CD10 (strong), CD22, HLA-DR (weak) and neg: TdT, CD20, cyIgM, sIgKappa, sIgLambda | 55,XX,+X,+4,+6,+10,+14, +17,+18,+21+21[10] | ogm[GRCh37](4)x3,(6)x3,(10)x3,(14)x3,(17)x3,(18)x3,(21)x4,(X)x3 | IR LOW |
| XI148 | Male | 1–10 | 3530 | 94.7 | BCP-ALL, type common B-ALL | High hyperdiploid, ETV6::BCL2L14 fusion, ETV6 and ERG deletiona | Pos: CD19 (partial), TdT (weak), CD10 (stronger), CD45 (weak to neg), CD34 (partial) and neg: CD20 | 56-58,XY,+X,+X[8],+4, +6,+7,+8[8],+10[6], +14,add(17)(q25), +?18,+?18[7],+21, +21[cp10]/46,XY[1] | ogm[GRCh37] (4)x3,(6)x3,(7)x3,(8)x3,(10)x3,(12)(p13.2)(11 825 707_11 985 066)x1,(14)x3,(17)(q21q25.3)(37 685 926_77 521 027)x4,(18)x4,(21)x4,(21)(q22.2)(39 750 741_39 813 306)x2,(X)x2 | IR HIGH |
| XI150 | Male | 1–10 | 7590 | 94.3 | BCP-ALL, type common B-ALL | High hyperdiploida | Pos: CD45 (weak), TdT (partial), CD10 (stronger), CD19, CD34 (weak/partial) and neg: CD20 | 55,XY,+X,+4,+6,add(12)(p13),+17,+18,+21,+21,+21,+21[11]/46,XY[1] | ogm[GRCh37] (X)x2,(4)x3,(6)x3,7p22.3p14.2(1616 408_36 744 866)x3,t(7;12)(p14.2;p13.33)(36 750 339;145 847),(17)x3,(18)x3,(21)x6 | IR LOW |
| XI162 | Male | 1–10 | 2030 | 87.7 | BCP-ALL, type common B-ALL | High hyperdiploida | Pos: CD45 (weak to neg), CD19, CD34 (partial), CD10, TdT (weak) and neg: CD20 | 56,XY,+X,+4,+6,+10, +14,+15,+18,+?18,+21,+21[9][cp11]/46,XY[2] | ogm[GRCh37] (X)x2,(4)x3,(6)x3,(10)x3,(14)x3,(15)x3,(18)x4,(21)x4 | IR LOW |
| XI167 | Male | 1–10 | 4920 | 96 | BCP-ALL, type common B-ALL | High hyperdiploida | Pos: CD45 (weak), CD19, CD34 (partial), CD10, TdT (weak) and neg: CD20 | 53-55,XY,inc[6] - Possible fusion with JAK2/9p24.1 | ogm[GRCh37] (X)x2,1q21.1q44(146 305 863_248 897 546)x3,(4)x3,(6)x3, der(9)ins(9;2)(p24.1;p11.1p11.1)(5498 314;92 185 547_92 266 250)ins(9;?)(p24.1;?)(5498 314;?)dup(9)(p24.1p24.1)(5098 994_5498 314),10p15.3q23.31(64 453_90 222 086)x3,11q12.2q13.4(61 084 312_70 836 960)x1,(14)x3,(17)x3, (18)x3,(21)x4 | IR LOW |
| XJ175 | Female | 11–16 | 1620 | 83.3 | BCP-ALL, type common B-ALL | High hyperdiploida | Pos: cyCD79a, CD19, CD34, CD10 (het), TdT, CD22, HLA-DR, dim/neg: CD45 and neg: CD20, cyIgM, sIgKappa, sIgLambda | 54,XX,+X,+4,+6, i(7)(q10),+8,+10,+14,+17,+21[6]/46,XX[6] | ogm[GRCh37] (X)x3,(4)x3,(6)x3, 7p22.3p11.1(8408 624_58 045 741)x1~2,7q11.21q36.2(64 399 737_154 226 595)x2~3,(8)x3,(10)x3, (14)x3,(17)x3,(21)x3 | IR HIGH |
| XJ176 | Male | 1–10 | 2580 | 91.3 | BCP-ALL, type common B-ALL | High hyperdiploid, RB1 deletiona | Pos: CD45 (weak to neg), CD34 (partial), cyCD79a, TdT, CD10 (stronger), CD19, CD22, HLA-DR (partial) and neg: CD20, cyIgM, sIgKappa, sIgLambda | 54,XY,+X,add(2)(p12),+4,+6,der(?13)t(9;13)(q12;q?),+14,+18,+21,+21,+mar[9]/54,sl,+del(9)(p23p13),-add(13)[4]/46,XY[2] | ogm[GRCh37] (X)x2,t(2;7)(p11.2;p14.1)(90 496 782;38 378 026),(4)x3,(6)x3,(7)x3, 9q21.11q34.3(70 838 153_141 150 069)x3,(13)cth,(14)x3,(18)x3, (21)x4 | IR LOW |
| XJ178 | Male | 1–10 | 5900 | 90.3 | BCP-ALL, type common B-ALL | High hyperdiploid, CDKN2A/B and ETV6 deletiona | Pos: CD45 (het/weak to neg), CD34 (partial), CD19, CyCD79a, CD10 (strong), TdT (partial/weak), CD22, HLA-DR and neg: CD20, cyIgM, sIgKappa, sIgLambda | 53-56,XY,+X[3],+4,+6, +10[4],+14[2],+17[3], +18[2],+21[4],+21[3], +2-3mar,inc[cp5]/46,XY[8] | ogm[GRCh37] (X)x2,(4)x3,(6)x3,9p11.2q34.3(47 295 173_141 150 069)x3, 9p21.3(21 127 258_22 662 958)x0~1,(10)x3,12p13.2(11 344 110_12 817 399)x1,(14)x3,(17)x3,(18)x3, (21)x4 | SR |
| XJ180 | Female | 1–10 | 2600 | 77.3 | BCP-ALL, type common B-ALL | High hyperdiploid, ETV6 deletiona | Pos: CD19, CD34, cyCD79a, CD10 (strong), TdT, CD22, HLA-DR (weak), CD45 (weak to neg) and neg: CD20, cyIgM, sIgKappa, sIgLambda | 55,XX,+X,+X,+4,+10,+14,+17,+18,+21,+21[7]/46,XX[3] | ogm[GRCh37](X)x4,(4)x3,(10)x3,12p13.2(11 865 436_11 917 469)x1,(14)x3,(17)x3,(18)x3,(21)x4 | SR |
- Note: In the table, we describe each diagnostic patient sample: the gender and age group, white blood cell (WBC) count in the peripheral blood using morphology, percentage of leukemic blasts based on morphology in the peripheral blood sample or bone marrow sample used for single-cell sequencing, leukemia type, genetic alterations, immunophenotype, ploidy by conventional karyotyping and FISH, ploidy by optical genome mapping (OGM), and risk group if applicable (none for XF98; for XG111, XG115, and XH135 according to EORTC 58 081 protocol; for other patients according to ALLtogether1 Trial).
- Abbreviations: AR1, average risk group 1; EORTC, European Organisation for Research and Treatment of Cancer; FISH, fluorescent in situ hybridization; het, heterogeneous; IR HIGH, high intermediate risk group; IR LOW, low intermediate risk group; neg, negative; OGM, optical genome mapping; pos, positive; SR, standard risk group; VLR, very low-risk group; y, years.
- a PAR1 duplication is only mentioned in cases assessed using multiplex ligation-dependent probe amplification (MLPA), whereas it is present in all cases with additional chromosome X.
We designed a custom amplicon panel specific for B-ALL, targeting 414 regions in 39 frequently mutated genes in B-ALL, focusing on SNVs and small insertions and deletions (indels) (Supporting Information S1: Figure S1A and Table S1). We sequenced a total of 120,516 cells, with a mean of 4821 cells per sample (Q1: 2336, median: 3353, Q3: 6564). Other quality metrics, such as allelic dropout (ADO) rate, mean reads per cell per amplicon, and mean reads per cell per antibody were as expected (Supporting Information S1: Figure S1B). Similar to another custom ALL panel that we previously designed,31, 34 more than 93% of the amplicons had good coverage (>10 reads per cell per amplicon) (Supporting Information S1: Figure S1C). Underperforming amplicons were discarded from further analysis.
Low-quality variants and cells were excluded from downstream analysis by applying 6 advanced filters of Tapestri Insights software, for example, excluding variants detected in less than 0.5% of cells. This resulted in an average number of 404 (range 180−1135) detected variants per patient (Table S2). Similarly, as previously described, this was followed by the exclusion of additional low-quality variants, like those at the edge of the amplicons and those present in almost all patients.31, 34 This resulted in the selection of 50 good-quality variants in 11 genes across all 13 patients (median: 2, mean: 3.8), as listed in Table S2.
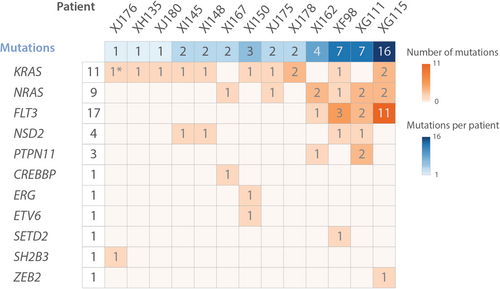
scDNA-seq detected (sub)clonal mutations in all patients, ranging from 1 to 16 mutations per patient (Figure 1). Commonly mutated genes were KRAS, NRAS, FLT3, NSD2, and PTPN11. After selecting the variants of interest, a mean of 3341 cells per sample were retained (Q1: 1379, median: 1837, Q3: 4040) (Table S3). Most cases had multiple subclones, ranging from 2 to 16 subclones per case (Figure 2 and Table S3). Based on chromosomal copy number variations and/or single-cell surface protein profiles (see further in the results), we could identify a fraction of normal cells (CN clone) as well as leukemia cells with high hyperdiploid karyotype but without additional point mutations (CH clone) (Figure 2 and Supporting Information S1: Figure S2).
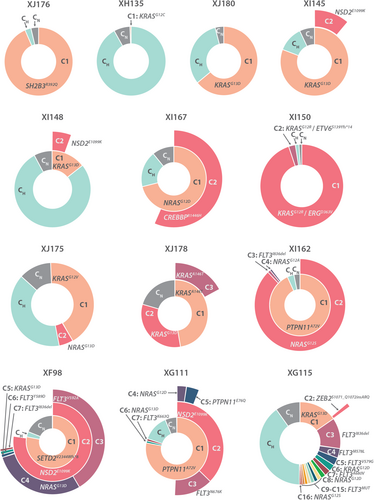
Remarkably, 12 of 13 cases had at least one subclone with a KRAS or NRAS mutation and six cases had multiple RAS mutations, occurring mutually exclusive in different subclones (Figure 2 and Supporting Information S1: Figure S3). Moreover, even in case XJ176, in which no RAS mutations were detected in >0.5% of the cells, we were able to detect a very small subclone (0.18% or 6 cells) with the SH2B3 mutation and an additional KRASG12D mutation (Table S4). Lowering filtering thresholds increases the risk of false positive variants, but based on copy number analysis this additional subclone had a similar HeH karyotype as the large subclone C1, strongly suggesting that this is a real clone (Supporting Information S1: Figure S4A).
Our scDNA-seq analysis thus detected KRAS/NRAS mutations in all HeH B-ALL cases, which is in strong contrast to bulk sequencing studies where RAS mutations were only detected in around 35%–50% of HeH B-ALL samples.11, 12 Moreover, the number of RAS mutations that we detected is most likely an underestimation, as some regions in KRAS and NRAS showed low coverage per cell. These subclonal RAS mutations seem to be specifically important in HeH B-ALL, as similar scDNA-seq in other B-ALL subtypes identified RAS subclones in only 2 out of 14 B-ALL patients (Meyers et al.31 and additional data not shown). Similarly, NSD2 mutations were found in 4/13 (30%) of patient samples using single-cell sequencing, whereas bulk sequencing could only detect mutations in 3%–6% of cases.11, 12 Additionally, RAS mutations and NSD2E1099K mutations (N = 4) co-occurred, whereas RAS mutations and FLT3 mutations (N = 4) were mutually exclusive. By predicting the order of mutation acquisition, phylogenetic trees were constructed, showing either a branched or a sequential pattern of evolution (Supporting Information S1: Figure S3).
To further investigate the oncogenic potential of the different subclones, we transplanted BM cells of the diagnostic sample of XG111 in an immunodeficient mouse and performed scDNA-seq on spleen cells (XG111_XEM) after leukemia had developed. In this PDX, subclones with multiple mutations had a growth advantage over subclones with only one mutation (Supporting Information S1: Figure S4B and Table S5). Most strikingly, subclone C4 with a PTPN11A72V, NSD2E1099K, and NRASG12D mutation, which was present in only 1.4% of cells in the diagnostic BM sample, showed the largest growth, with an abundance of 22.8% in the PDX. Moreover, a new subclone C8 with an additional FLT3A680V mutation could be detected in 20 cells of the PDX that was previously excluded from further analysis because it was detected in only 1 cell of the diagnostic BM sample.
HeH B-ALL shows little heterogeneity in chromosomal copy number at diagnosis
Although the Mission Bio platform is primarily designed to detect mutations (SNVs and indels), we also used the data to infer chromosomal CNVs in the subclones. Based on the genome coverage of the amplicons in our panel, we could infer CNVs for 16 out of 22 autosomes and for chromosome X. Since HeH B-ALL cases typically have abnormal karyotypes with gains of entire chromosomes, the resolution of our detection method was sufficient to detect most of these chromosomal copy number changes. Due to the limited resolution of the CNV detection, we cannot draw conclusions on smaller chromosomal deletions or duplications.
To accurately detect chromosomal copy number changes, we used the subclone CN, which was detected using amplicon coverage, as a reference population for CNV calling (Figure 3). The ploidy inferred by scDNA-seq correlated well with the ploidy of the leukemia cells determined by conventional karyotyping, FISH and/or OGM, indicating that scDNA-seq can accurately detect large CNVs at single-cell level. For those cases where single-cell protein data were available, we could also use those data to identify the normal B, T, NK, and erythroid cell populations (see further in the results), resulting in similar CNV profiles (Supporting Information S1: Figure S5A). In most cases, we clearly detected a cell population that had the HeH chromosomal changes but did not have any additional mutations (CH clone) (Figure 3A–D, Supporting Information S1: Figure S5B). Moreover, in these cases, the subclones with mutations had the same chromosomal aberrations as the subclone without additional mutations. These data illustrate that the chromosomal changes are early initiating events and are stable during further progression while the mutations are acquired later in disease progression.
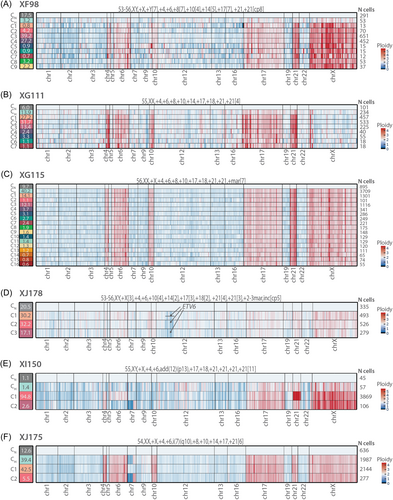
Only in two cases (XI150 and XJ175) did the ploidy of the detected subclones differ slightly (Figure 3E,F). Concerning case XI150, subclone C1 (94.8% of cells) had a gain of chromosomes 6 and 21 in comparison to CH cells, whereas subclone C2 (2.6% of the cells) had an apparent deletion on the short arm (p) and gain of the long arm (q) of chromosome 7, possibly indicating an isochromosome 7q (i(7)(q10)). Regarding case XJ175, subclone C1 seemed to have lost the isochromosome 7q, which was present in subclone CH and C2, and could also be detected with conventional karyotyping.
HeH B-ALL shows heterogeneity in surface membrane proteins at diagnosis
We next used the single-cell DNA and antibody sequencing (DAb-seq) that we obtained for three cases to investigate the heterogeneity of surface membrane proteins in HeH B-ALL. This allowed us to compare the subclones obtained by DNA sequencing with subclones based on protein expression. Data were available for 41 membrane proteins present on leukemia cells as well as immune cells in the tumor micro-environment.
In the 3 HeH B-ALL diagnostic samples, we identified the leukemia cells by low expression of CD45 and high expression of CD10 and CD19 (Figure 4). Within the leukemia cells, different populations were identified by varying presence of CD1c, CD22, CD34, CD38, CD44, CD69, CD71, CD141, CD303, and CD304 (Supporting Information S1: Figure S6A–C). When we visualized the protein data using a UMAP plot colored according to DNA subclones, the DNA subclones were distributed randomly over different protein subgroups, indicating that there was no correlation between specific mutations and immunophenotype (Figure 4B–G).
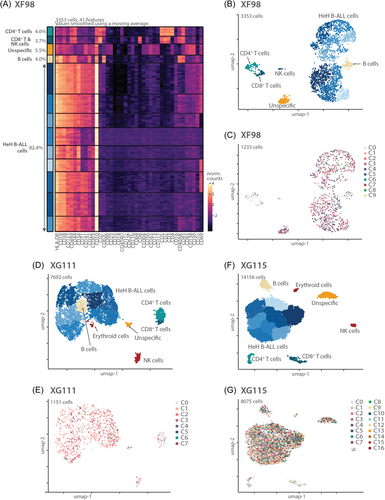
In addition to the leukemia cells, we could easily distinguish CD4+ T cells (CD3+/CD5+/CD45+/CD4+), CD8+ T cells (CD3+/CD5+/CD45+/CD8+), NK cells (CD16+/CD56+/CD3−), and normal B cells (CD45+/CD45RA+/CD19+) in all three cases (Figure 4A,B,D,F and Supporting Information S1: Figure S6A–C). An additional erythroid cell population (CD71+/CD141+) was identified in the BM samples and not in the PB sample. Moreover, in all samples, we identified a cluster with mild positivity for many markers, which we labeled “unspecific,” as they could not be assigned to a certain cell type. Comparing all cell populations identified based on protein expression with the mutation and CNV data, we could clearly identify the leukemia cells (with mutations and CNVs) as well as the normal T cells, normal B cells, and normal NK cells (almost completely lacking mutations and CNVs). Only a very small fraction of the “normal” cells also harbored mutations and CNVs, most likely caused by the fact that clustering based on single-cell protein data was a bit noisy. Those “normal” cells indeed had an intermediate immunophenotype with strong CD10 expression (Supporting Information S1: Figure S6A–C). Again, this underscores that the combination of single-cell DNA and surface protein data is required to accurately identify normal versus leukemia cells.
MRD detection during chemotherapy treatment
HeH B-ALL is currently treated with several rounds of combined chemotherapy. Detection of residual leukemia cells (MRD) at the EOI phase is a major decision point to determine if treatment needs to be intensified or not. Current MRD detection methods include MFC and PCR, but these methods only use part of the characteristics of the leukemia cells and do not look at specific mutations. Here, we determined if scDNA-seq, possibly combined with surface protein analysis, would provide a deeper insight in the residual leukemia cells.
To investigate which leukemic subclones persist during chemotherapy treatment, we performed scDNA-seq for BM samples of cases that had multiple subclones or a large RAS mutated subclone at diagnosis. Samples were collected at relevant clinical time points, including the EOI phase of chemotherapy treatment, and for some cases at the EOC as well (Table 2). Samples collected during treatment only contained a small number of leukemia cells and were therefore enriched for leukemia cells using a gentle sorter (MARS) with magnetic beads for CD10, CD19 and CD34, all markers for B cell precursor ALL. For 2 BM samples (XG111 EOI and XJ175 EOC), few cells were available, and enrichment was not performed, because all cells were necessary to ensure good quality of scDNA-seq.
| Samples | Number of mutated cells scDNA-seq (%) | Factor enrichment | % mutated cells (calculated) | MRD PCR | MRD MFC |
|---|---|---|---|---|---|
| XG111 EOI | 3/915 (0.33%) | NO MARS | 0.33% | Not detectable | / |
| XI145 EOI | 9/14,737 (0.06%) | 1.96 | 0.03% | <0.01% | Not detectable |
| XI148 D15 | 685/1327 (51.61%) | 1.37 | 37.67% | / | 32.50% |
| XI148 EOC | 3/1385 (0.21%) | 5.8 | 0.04% | Not detectable | Not detectable |
| XI150 EOI | 18/6737 (0.27%) | 3.42 | 0.08% | 0.03% | 0.05% |
| XI162 EOI | 2/1372 (0.15%) | 2.1 | 0.07% | <0.001% | / |
| XI162 EOC | 1/1837 (0.05%) | 2a | 0.03% | <0.01% | / |
| XI167 EOI | 2/4397 (0.04%) | 2.85 | 0.01% | <0.01% | Not detectable |
| XJ175 EOI | 281/1657 (16.96%) | 3.78 | 4.49% | 1% | 0.07% |
| XJ175 EOC | 1/1827 (0.05%) | NO MARS | 0.05% | Not detectable | Not detectable |
| XJ178 EOI | 3/1739 (0.17%) | 2.06 | 0.08% | Not detectable | Not detectable |
| XJ180 EOI | 6/3682 (0.16%) | 2.34 | 0.07% | 0.02% | 0.03% |
- Note: For each sample sequenced during treatment, either at Day 15 (D15), end of induction (EOI), or end of consolidation (EOC), the number of residually mutated cells is listed as a fraction of the total number of sequenced cells. Next, the factor of enrichment using the MARS gentle sorter is depicted, based on which we calculated the percentage of mutated cells in the original sample. When available, we showed for each sample MRD as detected by polymerase chain reaction (PCR) methods or multiparametric flow cytometry (MFC) in the clinical lab.
- a This sample was first enriched with a factor 2.9. However, too few cells were left for ensuring high-quality single-cell sequencing, so a fraction of the negative cell population was again added to the positive fraction, resulting in a factor of enrichment of around 2.
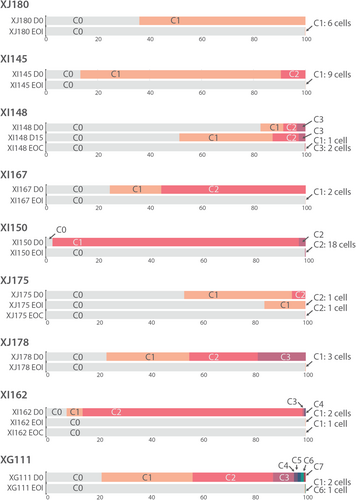
In all eight samples at EOI, residual subclones were detected, which matched with clones identified at diagnosis. In XJ175 and XG111, two residual subclones were detected, whereas in the other six cases only one of the subclones could be found (Figure 5). The residual subclone was mostly subclone C1, which is the first subclone in the phylogenetic tree and usually has only one mutation. Only in XI150 did we find residual cells of subclone C2, which contained 2 mutations. The number of mutant cells detected at EOI was 0 to 170 in 1000 cells (median 2 in 1000) (Table 2). For three cases, we also analyzed BM samples collected at EOC, a later time point during treatment. In sample XI148, we could detect 2 remaining subclones, whereas in both other cases we detected cells from only 1 residual subclone at this later timepoint. As expected, the number of residual cells detected at EOC was lower as compared to cells detected at EOI for the same case. Thus, we were able to detect MRD using scDNA-seq based on mutation analysis. In Table 2 we present the percentage of MRD detected by scDNA-seq corrected for the skewing effect of the enrichment for leukemia cells. However, because of the small number of cells that were sequenced in comparison to conventional MRD detection methods, we cannot make a conclusive statement about the sensitivity of this technique.
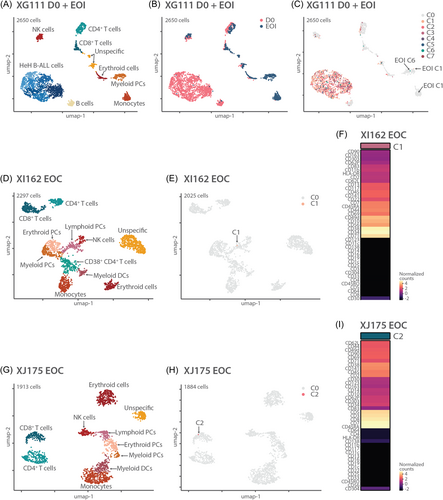
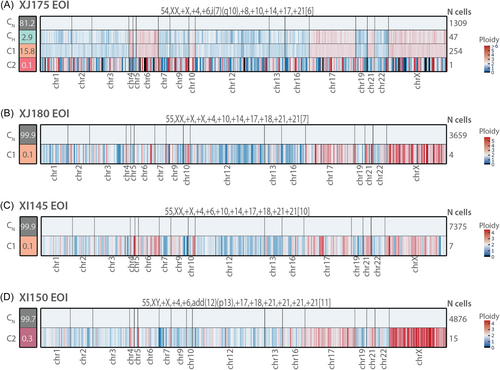
We next used the combination of DNA and protein data (DAb-seq) to refine the analysis of the residual leukemia cells. First, we performed DAb-seq on 3 cases: one EOI sample (XG111) and 2 EOC samples (XI162 and XJ175). Additional immune cell types in comparison to diagnostic samples could now be distinguished: different hematological precursor cells (PCs) (all CD34+/CD38+), including myeloid PCs (also CD123+/CD117+), lymphoid PCs (also CD10+/CD45RA+), and erythroid PCs (also CD117+), and more differentiated cell types like myeloid dendritic cells (DCs) (CD16+/CD11c+/HLA-DR+), monocytes (CD14+/CD45+/CD33+/CD11b+/CD11c+), and CD38+ CD4+ T cells (Supporting Information S1: Figure S7). In these cases, a small number of residual leukemia cells were identified based on mutations, but these clustered mostly with the normal cells instead of the leukemia or lymphoid precursor cells (Figure 6A–I). Vice versa, in the EOI sample, six cells had a protein profile similar to HeH B-ALL cells at diagnosis, but these did not harbor any mutation (Figure 6A–C). Next, we investigated whether residual mutated cells were indeed HeH B-ALL cells by using CNV profiling. For those cases with at least 4 mutated cells at the MRD analysis, we could clearly distinguish a HeH karyotype (Figure 7). CNV profiling in EOI sample of case XJ175 could even demonstrate a population of high hyperdiploid cells without additional SNVs (=CH), similar to samples at diagnosis (Figure 7A). If only one cell was detected, CNV data were too noisy to determine if the cell had an abnormal karyotype (Figure 7A). These data illustrate that CNV analysis at single-cell level can assist in the accurate detection of residual leukemia cells.
DISCUSSION
We performed a single-cell multi-omics study in patients with HeH B-ALL, which revealed clonal heterogeneity in all cases based on mutation analysis (SNVs). The single-cell data clearly indicate that the chromosomal gains (CNVs) are mostly stable over all leukemia cells and thus define an early and likely initiating event in the development of HeH B-ALL. In contrast, the mutations (SNVs) define several subclones and are thus later events that likely shape the progression and evolution of the disease.
Strikingly, all patient samples had at least one mutation in either KRAS or NRAS at diagnosis, sometimes in a very small clone. These mutations lead to a gain-of-function of the KRAS or NRAS protein, which are GTPases that are frequently mutated in cancer, leading to uncontrolled cell proliferation, differentiation, and survival.38, 39 In large-scale bulk sequencing studies (whole genome, exome, and transcriptome), RAS mutations were only found in around 35%–50% of all HeH B-ALL cases.11, 12 Why these RAS mutations are so frequent in HeH B-ALL, and yet sometimes only in very small subclones, is still unclear. Possibly, these minor subclones support the growth of the other leukemia cells or, alternatively, the chromosomal defects cause a stress that leads to such mutations.
We observed RAS and FLT3 mutations to be mutually exclusive, as was clear in the diagnostic sample of XG115 with 4 different RAS mutations and 11 different FLT3 mutations, all in separate subclones. This has been observed in previous bulk and single-cell sequencing studies in B-ALL as well.12, 31 Interestingly, we found RAS mutations and NSD2E1099K mutation always occurring in the same subclone, suggesting an oncogenic cooperation in HeH B-ALL. This was confirmed in a PDX mouse model, where a small subclone with a PTPN11A72V, NSD2E1099K, and NRASG12D mutation (1.4% of the diagnostic patient sample XG111) became the second largest subclone (22.8%) in the PDX. In lung cancer, NSD2 overexpression contributed to proliferation of cancer cells by supporting RAS transcriptional responses,40 suggesting that a similar cooperation might occur in ALL. Moreover, we detected this NSD2 mutation in 4/13 (31%) patients, frequently in a small subclone, whereas bulk sequencing identified this mutation only in 3%–6% of HeH B-ALL cases,11, 12 emphasizing again the added value of single-cell DNA sequencing studies. Since NSD2E1099K was previously shown to be enriched in relapsed B-ALL,41, 42 the increased sensitivity of single-cell DNA sequencing studies for early detection of NSD2-mutant cells might benefit patients who are at risk for relapse.
Bulk sequencing studies investigating chromosomal gains in HeH B-ALL showed conflicting results, with some suggesting all chromosomes being gained in one single event,11, 33 and others suggesting ongoing acquisition of CIN leading to heterogeneity in karyotype.8, 26, 32, 43 We did not detect much heterogeneity in the ploidy status of the leukemia cells, although in 2 cases (XI150 and XJ175) we did detect minor differences in modal number for different DNA subclones. Partly, this low degree of heterogeneity in chromosome count can be explained by the fact that the events leading to high hyperdiploidy happened before the acquisition of additional SNVs, which are subclonal. We did indeed find a high hyperdiploid subclone without additional SNVs in most cases. This was also inferred using bulk sequencing by studying UV-induced SNVs, which were found mostly on only 1 of 3 triploid chromosomes, indicating that copy gains occurred early (possibly in utero7), since they preceded UV exposure.12 We have to note, however, that the resolution to detect copy number changes in our study was low and limited mostly to whole chromosomal gains or losses, meaning that we could have missed certain CNVs. Moreover, this remains a small patient cohort, and other mechanisms of ploidy evolution in HeH B-ALL aside from synchronous early gains have been described, albeit with a frequency of around 15%.12
In addition to diagnostic samples, we also performed single-cell sequencing on samples during treatment, mostly focusing on samples collected at EOI and EOC. We could detect residually mutated cells in all samples at EOI and at EOC using mutation analysis by single-cell DNA sequencing. However, if few mutated cells were left, it remained unclear whether these were in fact residual leukemic cells based on mutation data alone. For samples with more than 4 residual cells in one subclone, we could successfully use CNV profiling, which showed the HeH karyotype of these residual cells, but for cases with fewer cells left, this approach was not possible. During treatment, we performed DAb-seq on three samples to correlate residual mutations to their surface protein profile. The residually mutated cells were not always annotated as HeH B-ALL cells by protein profiling in this study, possibly because limited residually mutated cells were left in these cases.
We also performed single-cell surface protein sequencing in addition to DNA sequencing for some diagnostic patient samples. This way, heterogeneity in surface proteins on leukemia cells could be investigated on top of the genetic mutations. This heterogeneity, mostly in CD22, CD69, CD71, CD141, and CD303, could not be linked to genetic subclones, indicating that presence of these proteins is not directly linked to SNVs in HeH B-ALL cells. Another advantage of having DAb-seq data for these aneuploid cells is that the data can also be used for CNV detection, should this not be possible using scDNA-seq data alone. Based on the protein profiles we could always distinguish HeH B-ALL cells from “normal cells,” as this was not possible for all cases using only scDNA-seq data (case XJ178). Using a population of “normal cells” as a reference was necessary to obtain a cleaner CNV profile, as elucidated for case XG115, in which 40% of cells at diagnosis had no point mutations but did have a clear HeH karyotype. Finally, based on the surface protein profiles, residually mutated cells found during treatment can be better annotated, to distinguish between real B-ALL cells or mutations in other immune cells.
In summary, in this study of 13 patients with HeH B-ALL, we show the advantage of a multi-omics approach, single-cell DNA, and antibody sequencing to identify heterogeneity in SNVs, CNVs, and surface proteins. While this technique is capable to detect MRD, the cost of this technique is still too high to be implemented in the daily routine of the clinic. More studies on larger patient cohorts are necessary to confirm these results. Moreover, comparing matched diagnosis-relapse pairs using this technique could provide useful insights in risks of relapse in HeH B-ALL, potentially leading to a better risk stratification, either by reducing therapy intensity in those with a genuinely good risk or by augmenting therapy in those with a poorer risk profile.
ACKNOWLEDGMENTS
We thank VIB Tech Watch, VIB Single Cell Core, VIB Flow Core Leuven, and VIB Nucleomics Core for their technical support.
AUTHOR CONTRIBUTIONS
Margo Aertgeerts designed the study, performed experiments, analyzed experimental and bioinformatics data, wrote the article, and conducted all figures and tables. Sarah Meyers performed single-cell experiments and wrote the article. Olga Gielen conducted experiments and collected and processed patient samples. Sofie Demeyer analyzed bioinformatics data and wrote the article. Jochen Lamote optimized and performed sorting of cells. Barbara Dewaele, Mercedeh Tajdar, Johan Maertens, Jolien De Bie, Nancy Boeckx, Lucienne Michaux, Anne Uyttebroeck, and Heidi Segers provided patient samples and analyzed clinical, genetic, and flow cytometry data. Kim De Keersmaecker analyzed data. Jan Cools and Heidi Segers designed and supervised the study, analyzed data, and wrote the article. All authors critically proofread the article.
CONFLICT OF INTEREST STATEMENT
Jan Cools is an Editor at HemaSphere. The remaining authors declare no conflicts of interest.
Open Research
DATA AVAILABILITY STATEMENT
The data that support the findings of this study are openly available in EGA at https://ega-archive.org/, reference number EGAS50000000580.
This project was funded by grants from Stand Up to Cancer, the Flemish Cancer Society (J.C., H.S.), and the KU Leuven (C14/18/104) (J.C., K.D.K., J.M., N.B., H.S., M.A.). S.D. received a postdoc fellowship from the Foundation Against Cancer, and S.M. received fellowships from KU Leuven and FWO.


