A cellular reporter system to evaluate endogenous fetal hemoglobin induction and screen for therapeutic compounds
Abstract
Reactivation of fetal hemoglobin expression alleviates the symptoms associated with β-globinopathies, severe hereditary diseases with significant global health implications due to their high morbidity and mortality rates. The symptoms emerge following the postnatal transition from fetal-to-adult hemoglobin expression. Extensive research has focused on inducing the expression of the fetal γ-globin subunit to reverse this switch and ameliorate these symptoms. Despite decades of research, only one compound, hydroxyurea, found its way to the clinic as an inducer of fetal hemoglobin. Unfortunately, its efficacy varies among patients, highlighting the need for more effective treatments. Erythroid cell lines have been instrumental in the pursuit of both pharmacological and genetic ways to reverse the postnatal hemoglobin switch. Here, we describe the first endogenously tagged fetal hemoglobin reporter cell line based on the adult erythroid progenitor cell line HUDEP2. Utilizing CRISPR-Cas9-mediated knock-in, a bioluminescent tag was integrated at the HBG1 gene. Subsequent extensive characterization confirmed that the resulting reporter cell line closely mirrors the HUDEP2 characteristics and that the cells report fetal hemoglobin induction with high sensitivity and specificity. This novel reporter cell line is therefore highly suitable for evaluating genetic and pharmacologic strategies to induce fetal hemoglobin. Furthermore, it provides an assay compatible with high-throughput drug screening, exemplified by the identification of a cluster of known fetal hemoglobin inducers in a pilot study. This new tool is made available to the research community, with the aspiration that it will accelerate the search for safer and more effective strategies to reverse the hemoglobin switch.
INTRODUCTION
Each year, nine million babies are born around the world with a congenital or genetic disease. Twenty-five percent of these newborns suffer from just five conditions.1 Among these are the globinopathies, a group of monogenetic diseases including sickle cell disease (SCD) and β-thalassemia. In these diseases, mutations affect adult β-globin, and thus, symptoms arise after the postnatal switch from fetal (α2,γ2) to adult (α2,β2) hemoglobin expression.2 The importance of the hemoglobin switch (from γ to β) in marking the onset of symptoms was already observed in 1948.3 With this notion, the idea emerged that the re-activation of fetal hemoglobin (HbF) expression would provide an effective treatment for these patients. In the 1960s, the discovery of Greek families with β-thalassemia in combination with a condition called hereditary persistence of fetal hemoglobin (HPFH) proved that HbF expression ameliorates the symptoms of β-thalassemia.4 Reactivation of HbF expression has ever since been a focus of drug discovery efforts for the treatment of patients with β-globinopathies.5, 6 With the emergence of CRISPR-based genetic therapy, reactivation of HbF expression is a promising approach that has already been tested in patients.7-9 In the laboratory setting, an easy-to-use benchtop assay that reports the activation of HbF expression would be helpful when evaluating innovations such as new nuclease enzymes or cell delivery methods.
As an alternative to genetic therapy, pharmacological induction of HbF would provide a more accessible treatment option to the majority of the patient population. Eighty percent of the ~350,000 babies born annually with severe β-globinopathy live in sub-Saharan Africa.10 Currently, hydroxyurea (HU) is the only Food and Drug Administration-approved HbF inducer.11 Unfortunately, the effects of HU are variable, with some patients still developing symptoms and others displaying no significant improvement. In high-income countries, these patients would be candidates for allogeneic bone marrow transplantation or genetic therapy (e.g., the 13-year-old transfusion-dependent boy with SCD showing no response to HU described by Badat et al.12), while in low- and middle-income countries, novel pharmacological inducers of HbF could be life saving. Over the years, many compounds have been tested, and many proteins involved in the hemoglobin switch, such as transcription factors and epigenetic enzymes, have been identified as therapeutic targets.13 To date, very few potent inducers of HbF have been identified, in particular when toxicity and long-term safety are taken into consideration.
To test potential inducers of HbF, a sensitive and specific reporter assay is required. To this end, Breveglieri et al. generated K562 cells carrying fluorescent reporters under the control of the fetal and adult β-like globin genes.14 Their 2019 paper provides an overview of previously published reporter systems to discover novel inducers of HbF.14 These assays rely on reporter constructs in BAC, YAC, or plasmid DNA in different cellular backgrounds including human (K562) and mouse (MEL, GM979) erythroid leukemia cell lines.15-18 None of these reporters tagged the endogenous fetal globin genes HBG1 or HBG2 (encoding Aγ and Gγ globin chains, respectively). Tagging the endogenous HBG genes would report their expression in a native chromatin context. We hypothesized that this would provide an assay with high specificity and sensitivity when screening for activators of HbF expression. Furthermore, none of the previous HbF reporter systems capitalized on HUDEP2 cells, a human erythroid progenitor cell line that is currently widely used to study the hemoglobin switch.19 A major advantage of HUDEP2 cells is that they closely resemble human adult erythroid progenitors and that they do not increase HbF expression under stress conditions, a phenomenon observed with primary erythroid progenitors.20 Alternatively, phenotypic screens can be conducted with enzyme-linked immunosorbent assay (ELISA)-based methods, as previously performed in primary erythroid cells21 and HUDEP2 cells.22 However, for technical reasons, these studies were limited to screening fewer than 20,000 compounds. Performing high-throughput screening (HTS) will increase the likelihood of identifying candidate drugs successfully. HTS typically screens over 100,000 compounds and requires a robust, sensitive, and highly specific assay. An HbF reporter cell line would allow unbiased drug screens to identify potential inducers active in any of the pathways regulating HbF levels in adult red blood cells. To our knowledge, a suitable cell-based assay reporting endogenous expression of HbF is not yet available. Here, we describe the generation and validation of such a reporter cell line that is compatible with HTS. The cell line reduces time and costs per tested molecule in the search for novel inducers. It also presents an easy-to-use benchtop assay to optimize conditions for (epi)genetic activation of HbF expression.
MATERIALS AND METHODS
Human erythroid cells
The HUDEP human erythroid cell lines have been described elsewhere.19 Cultures of primary human erythroid progenitors20, 23-25 were established from anonymized buffy coats (Dutch blood bank Sanquin, project NVT0146) or ~10 mL of peripheral blood derived from SCD patients (Erasmus MC MEC-2018-1422).
Cell culture
Cells were cultured at 5% CO2, 20% O2, and 95% ± 5% humidity at 37°C. Cell density was kept between 0.3 and 1.5 × 10⁶ cells/mL refreshing the medium every second or third day. The cells were cultured in fully defined serum-free Cellquin medium developed at Sanquin Research.20, 23, 24 Cellquin medium was prepared on site from Iscove's modified Dulbecco's medium (IMDM) (Cat. #P04-20 250; PAN Biotech); the full list of ingredients is provided in Table 1. A readily prepared version of Cellquin is available (Cat. #P04-20251K; PAN Biotech). Doxycycline, used in the proliferation medium, promotes the expression of the HPV16-E6/E7 transgene that was introduced to immortalize the HUDEP cells19 and was added to the cultures every other day. In the differentiation medium, doxycycline was removed to allow the cells to exit the cell cycle, which is required for terminal differentiation. Cell density and diameter distribution of HUDEP cultures were determined with a CASY Model TTT electrical current exclusion cell counter (Omni Life Science). For storage in liquid nitrogen, HUDEP cells were frozen in fetal calf serum (FCS, Cat. #FBS-12A; Capricorn Scientific) containing 10% dimethyl sulfoxide (DMSO), typically storing 5–20 million cells in 1 mL suspension.
| Additive | Final concentration | Supplier | Cat. Number |
|---|---|---|---|
| For base medium | |||
| Poly(vinyl alcohol) (PVA) | 1 g/L | Sigma-Aldrich, Munich, DE | 363081 |
| Human holotransferrin | 300 mg/L | Sanquin, NL via Mebiopharm, Tokyo, JP | NA |
| Cholesterol | 2.5 mg/L | Sigma-Aldrich, Munich, DE | C3045 |
| l-a-phosphatydilcholine | 2.5 mg/L | Sigma-Aldrich, Munich, DE | P3556 |
| Oleic acid | 1.5 mg/L | Sigma-Aldrich, Munich, DE | O1383 |
| Insulin | 10 mg/L | Sigma-Aldrich, Munich, DE | I9278 |
| l-Glutamine | 2 mM | PAN Biotech, Aidenbach, DE | P04-80100 |
| Sodium pyruvate | 100 μM | Thermo Fisher Scientific, Waltham, MA | 11360070 |
| Penicillin/ | 50,000 U/L | Sigma-Aldrich, Munich, DE | P0781 |
| Streptomycin | 50 mg/L | ||
| For proliferation medium | |||
| Epoetin alfa | 2000 U/L | Janssen-Cilag, Breda, NL | NA |
| Human recombinant stem cell factor | 100 µg/L | ITK Diagnostics, Uithoorn, NL | K0921139 |
| Dexamethasone | 0.4 mg/L | Sigma-Aldrich, Munich, DE | D4902 |
| Doxycycline | 1 mg/L | Sigma-Aldrich, Munich, DE | D9891 |
| For differentiation medium | |||
| Epoetin alfa | 10,000 U/L | Janssen-Cilag, Breda, NL | NA |
| Human plasma | 3% (v/v) | Sanquin, Amsterdam, NL | NA |
| Heparin | 3125 U/L | STEMCELL Technologies, Vancouver, CA | 07980 |
HEK293T cells were cultured at 5% CO2, 20% O2, and 95% ± 5% humidity at 37°C in DMEM supplemented with 50,000 U/L penicillin, 50 mg/L streptomycin (Cat. #P0781; Sigma-Aldrich), and 10% FCS (Capricorn Scientific). Cell density was kept below 90% confluence.
Sanger sequencing
Polymerase chain reaction (PCR)-amplified DNA fragments (Supporting Information S1: Table S1) were subjected to Sanger sequencing and analyzed using CLC Main Workbench 8 (Qiagen). To estimate Cas9 efficiency, Sanger sequence trace deconvolution was performed with TIDE.26
Guide RNA (gRNA) design
CRISPOR27 was used to design gRNAs in the 3′-UTR of HBG1. Two HBG1-specific gRNAs were identified (Supporting Information S1: Table S1). Template DNA for homology-directed repair was derived from plasmid DNA or synthesized as a single-stranded oligonucleotide (Supporting Information S1: Table S1; IDT).
Nucleofection
HUDEP2 cells (2 × 10⁶) were nucleofected (EW-113 Program 1) on a 4D-Nucleofector system (Lonza) using pLentiCRISPR v2 (Addgene #52 961)28 plus double-stranded template DNA or Cas9-sgRNA ribonucleoprotein (RNP) complex plus single-stranded template DNA (Alt-R CRISPR-Cas9 system; IDT). To isolate clones, cells were single-cell sorted (FACSARIA III; Becton Dickinson) 2 days postnucleofection.
Aγ-HiBiT detection
The Nano-Glo HiBiT lytic assay (#N3030; Promega) was used for Aγ-HiBiT luminescence detection with a GloMax plate reader (Promega). Western blots were probed using the Nano-Glo HiBiT blotting assay (#N2410; Promega).
SNP arrays
HUDEP2 DNA was used for the Global Screening Array (GSAv3); data were analyzed with GenomeStudio (Illumina).
Next generation sequencing
RNAseq and ATACseq were performed as described.29 Reads were mapped against the GRCh38 human reference using HiSat2 (version 2.1.0).30 RNA expression values were called using htseq-count.31
Flow cytometry
CD253a (#561775; Becton Dickinson) and CD117 (#562435) were used for flow cytometry (LSR-FORTESSA; Becton Dickinson); data were analyzed with Flowjo v.10.6 (Becton Dickinson).
Quantitative PCR
Globin expression was determined by qPCR using PSMD1 as a reference (Supporting Information S1: Table S1).29, 32, 33 The method was used to calculate expression levels.34
Protein analysis
High-performance liquid chromatography (HPLC) analysis of HbF/HbA and western blots were performed as described.29 Primary antibodies recognized γ-globin (sc-21756; Santa Cruz Biotechnology), β-globin (sc-21757), and NPM1 (ab10530; Abcam). Appropriate secondary antibodies enabled detection with an Odyssey CLx Imaging System (LI-COR Biosciences).
HTS
Assay optimization for the use of Aγ-HiBiT cells in HTS applications and the pilot screen of 5632 known bioactive drugs were performed at the EMBL Chemical Biology Core facility.
Statistical tests
Statistical analyses were performed using two-tailed t-tests (GraphPad Software). *p < 0.05; **p < 0.01; ***p < 0.001.
RESULTS
Sequence analysis for HBG1-specific CRISPR-Cas9 guide RNA designs
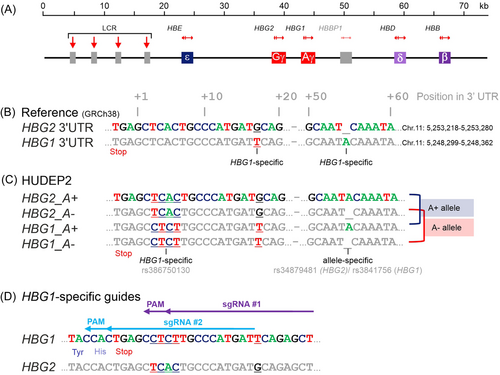
The fetal γ-globin chains are encoded by two nearly identical and closely spaced genes, HBG1 and HBG2. The high level of sequence homology between the two genes poses the risk of simultaneous Cas9-induced double-strand breaks at both genes resulting in large deletions or inversions.35 CRISPR-Cas9-mediated tagging of the endogenous fetal γ-globin chains therefore requires a gene-specific gRNA design that leaves the other β-like globin genes in the HBB locus unaffected (Figure 1A,B). A comparison of the two 3′-UTR regions in the human reference genome GRCh38 identified a unique nucleotide at position +17 (GHBG2 vs. THBG1). Also, HBG1 contains an extra A at position +55 that is not present in HBG2 (Figure 1B). In HUDEP2 cells, gene-specific PCR amplicons of HBG1 and HBG2 were sequenced, identifying four unique nucleotides in the 3′-UTR between positions +3 and +6 (TCAC>CTCT, a polymorphism known with variant ID: rs386750130) (Figure 1C). Of note, this 4-nucleotide variant was also found in the HBG1 3′-UTR of HUDEP1 and HEK293T cells. Furthermore, in HUDEP2 cells, the extra A at position +55 was allele-specific rather than gene-specific. Sanger sequencing of cloned 5 kb amplicons that contained the 3′-UTRs of HBG1 and HBG2 showed that on one chromosome, both genes contain the extra A (A+ allele), while on the other chromosome, both genes lack the +55A (A- allele) (Figure 1C). This allele-specific variant allows differentiation between sequence data from either allele when evaluating the knockin of a reporter gene. These +55A variants are listed in dbSNP as rs3841756 (HBG1) and rs34879481 (HBG2). With this sequence information, two gRNAs specifically targeting the HBG1 3′-UTR were designed. gRNA #1 maps to an HBG1-specific PAM (protospacer adjacent motif, 5′-NGG-3′) and contains 3 gene-specific nucleotides in the spacer sequence, while gRNA #2 contains 4 gene-specific nucleotides and directs Cas9 to cut at the Aγ-globin stop codon (Figure 1D).
Tagging the endogenous HBG1 gene in HUDEP cells
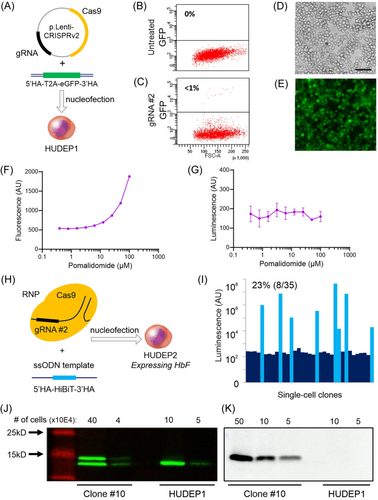
The HBG1-specific gRNAs were cloned into an expression plasmid containing Cas9 (p.LentiCRISPRv2 Addgene #5296128) and transfected into HEK293T cells to evaluate their DNA cutting efficiency. Sequence trace deconvolution with the TIDE algorithm26 suggested gRNA #2 was most efficient (1 bp insertion in 12.9% of traces vs. 5.7% for gRNA #1). HBG1 was then targeted in the fetal-like HUDEP1 cells19 to test the feasibility of CRISPR-Cas9-mediated tagging of HBG1. The Cas9_gRNA #2 plasmid was combined with a double-strand DNA template containing eGFP flanked by 800 bp homology arms (HA, Figure 2A). Although the knockin efficiency was low, indicated by less than 1% GFP+ cells in flow cytometry (Figure 2B,C), the correctly edited cells could be enriched by fluorescence-activated cell sorting (FACS) (Figure 2D,E). DNA sequence analysis of the sorted cells confirmed that the tag landed correctly in the endogenous HBG1 gene (data not shown). For a useful reporter cell that could identify novel inducers of HbF expression, HBG1 must be tagged in HUDEP2 cells that do not express HbF. Without expression of the tagged gene, FACS enrichment of the correctly edited cells would be impossible underscoring the need for a more efficient knock-in strategy. Also, GFP was not considered the optimal reporter gene. Detection of fluorescence using microscopy or flow cytometry would pose significant limitations in terms of sensitivity and sample analysis time, and drug screens would be hampered by the inherent auto-fluorescence of some of the pharmacological compounds, for example, pomalidomide (Figure 2F). In contrast, luciferase-based assays are amenable to fast, specific, and sensitive robotized analysis and are not affected by auto-fluorescence (Figure 2G). We opted for a split NanoLuciferase system36 in which an 11-amino acid tag (HiBiT, High-affinity small BiT) is fused in-frame to HBG1. Upon lysis of the cells, its counterpart Large BiT (LgBiT) is added to form catalytically active luciferase. The luminescent signal intensity provides a direct and sensitive measure for the amount of Aγ-HiBiT protein in the lysate. To optimize editing efficiency, we used a HUDEP2 population in which expression of the HBG1/2 genes had been spontaneously reactivated (TV and SP, unpublished results). First, Cas9 cutting efficiency was improved by delivering Cas9 and the gRNA as a ribonucleic protein (RNP) complex rather than on an expression plasmid (Figure 2H). Second, a single-strand oligodeoxynucleotide (ssODN) template was used to introduce the HiBiT tag in-frame at the C-terminus of Aγ-globin (Figure 2H). Combined, the knockin efficiency increased to over 20% (Figure 2I). Sequence analysis demonstrated correct knockin of the HiBiT-tag at the HBG1 gene. This was confirmed by western blot analysis of Clone #10 in which both HBG1 genes contain the HiBiT tag. Compared to the untagged Gγ-chains, the Aγ-HiBiT chains were detected as a slower migrating band by the γ-globin antibody (Figure 2J). Importantly, when the HiBiT luminescence assay was used to probe the western blots, only the slower migrating Aγ-HiBiT band was detected (Figure 2K). To generate the reporter cell line, this procedure was repeated in HUDEP2 cells that did not express HbF. Here, we report the clonal isolation, molecular characterization, and HTS validation of the HbF reporter cell line.
The Aγ-HiBiT reporter cell line resembles HUDEP2 cells in proliferation and differentiation
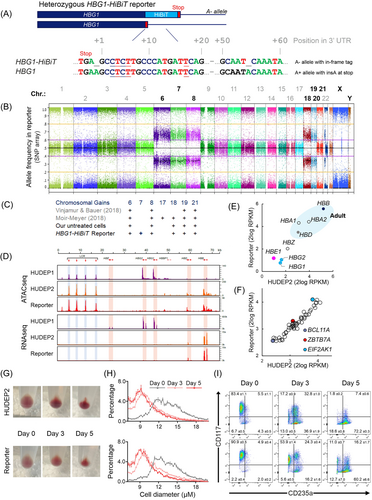
Sequence analysis confirmed that the clonal Aγ-HiBiT reporter cell line contained an in-frame knockin of the HiBiT-tag at the C-terminus of HBG1 on the A− allele. On the A+ allele, an insA was observed in the stop codon, leaving the TGA stop codon intact (Figure 3A). This insertion probably prevented further cutting by Cas9 resulting in heterozygous rather than homozygous knockin of the HiBiT-tag. Since the sequence of the HBG2 genes was unaffected (data not shown), 1 out of 4 HBG genes now carried the HiBiT-tag. After genotyping this correctly tagged cell line, its phenotype was characterized and compared to untreated HUDEP2 cells. Untreated HUDEP2 cells are known to have multiple chromosomal gains. Trisomies have been described for chromosomes 6, 8, 17, 18, 19, and 21.37, 38 In line with these reports, SNP array analysis of our untreated HUDEP2 cells revealed trisomy for chromosomes 6, 8, 18, 19, and 21. The reporter clone contained an additional copy of chromosome 7, but no chromosomes were lost (Figure 3B,C). A comparison of open chromatin in the HBB locus of HUDEP1, HUDEP2, and the reporter cells with ATACseq showed that the ATAC sites in the reporter cells matched the pattern observed in HUDEP2 cells (Figure 3D). The absence of ATACseq peaks at the HBE, HBG1, and HBG2 genes indicated that these genes remained effectively silenced. RNA sequence traces confirmed that transcriptional activity in the reporter cells is limited to the adult HBD and HBB genes (Figure 3D,E). Expression levels of 52 previously reported regulators of HbF were compared between the reporter cells and control HUDEP2 cells (Supporting Information S1: Table S2). The expression profile of these HbF-regulating factors, including the two key repressors of HbF, BCL11A39 and ZBTB7A,40 correlated closely between the two cell lines (Figure 3F). The EIF2AK1 gene, encoding a kinase and known repressor of HbF,41 is located on chromosome 7. The reporter cell line, with three copies of chromosome 7, showed ~2-fold increased expression of this gene. Two other reported HbF regulators located on chromosome 7, JAZF142, 43 and EZH2,44, 45 were not upregulated in the reporter cell line. The expression pattern of hemoglobin subunits in the reporter cell line closely resembles that observed in HUDEP2 cells. Both lines express very low levels of HbF and high levels of HbA. Hemoglobin expression depends on the differentiation state of the culture at the time of RNA isolation, which might explain the minor differences in the absolute number of transcripts picked up by RNAseq (Figure 3E). Upon induction of differentiation, HUDEP2 cell diameter decreases, while the expression of globin chains gradually increases. The parental HUDEP2 and reporter cells responded similarly after the medium was changed to differentiation conditions. Upon differentiation, the red color of the cell pellets increased indicating higher levels of globin expression, while cell diameter decreased (Figure 3G,H). Flow cytometry showed that during differentiation the reporter cells changed expression of cell surface markers similar to differentiating HUDEP2 cells, that is, loss of CD117 and gain of CD235a (Figure 3I). Together these results confirmed that the Aγ-HiBiT reporter cell line closely resembles the adult erythroid progenitor phenotype of HUDEP2 cells.
Application of the Aγ-HiBiT reporter cell line to evaluate genetic HbF-inducing strategies
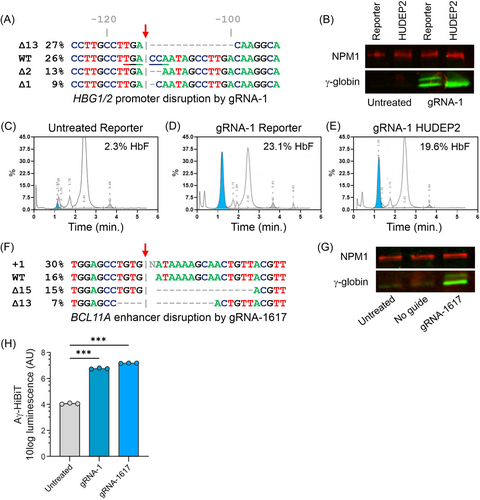
In genetic experiments, the Aγ-HiBiT reporter cell line was evaluated as a tool to quickly evaluate different genetic HbF-inducing strategies. This requires that the reporter cells survive gene editing experiments. Also, any increase in detected Aγ-HiBiT signal should correlate quantitatively with the extent of HbF induction as measured by standard methods, such as western blotting or HPLC. Using Cas9 guided to the promoters of HBG1 and HBG2 by a gRNA previously published by Traxler et al.,46 a 13 bp deletion is preferentially introduced. This deletion is a known HPFH mutation.47 In the reporter cells, the HPFH mutation was successfully introduced in ~27% (estimate based on sequence trace deconvolution) of the HBG1/2 promoters (Figure 4A). After editing the HBG1/2 promoters in HUDEP2 and the reporter cells, γ-globin protein levels increased in both cell types (Figure 4B). Western blots on lysates from the reporter cells demonstrated induction of HiBiT-tagged and untagged γ-globin chains. The lower intensity of the slower migrating Aγ-HiBiT chain fits with the notion that the HiBiT tag was introduced in one of the four HBG genes (Figures 3A and 4B). Untreated reporter cells contained 2.3% HbF, which increased to 23.1% in the population after gene editing, as was quantified by HPLC (Figure 4C,D). Similarly, in the HUDEP2 population, the CRISPR experiment increased the HbF levels to 19.6% (Figure 4E). As an alternative genetic approach, the reporter cells were subjected to editing outside the HBB locus with the disruption of an erythroid-specific enhancer of BCL11A, a key repressor of HbF.48 Also, for this orthogonal strategy, sequence disruption and HbF induction were observed (Figure 4F,G). Next, we tested if the induction of HbF was reflected by the luminescent reporter signal. The HiBiT Lytic Assay showed a sharp increase in luminescence signal from the reporter cells after gene editing of the HBG promoters (gRNA-1, Figure 4H) and the BCL11A enhancer (gRNA-1617, Figure 4H).
Pomalidomide as a positive control compound for HbF induction
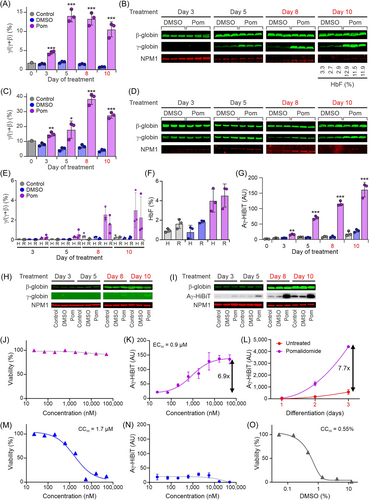
To use the reporter cell line for the discovery of γ-globin-inducing compounds, a compound that can serve as a positive control is required. We used pomalidomide, a thalidomide derivative that was previously described to have HbF-inducing properties.49-52 Primary erythroid progenitors are known to express relatively high levels of HbF when cultured.20 Indeed, we observed a baseline level of ~2% HBG1/2 as a fraction of HBG1/2+HBB messenger RNA (mRNA) in primary erythroid progenitors obtained from a healthy donor (Figure 5A). Under proliferation conditions, this increased to 12%–15% at Day 5 of treatment with 10 µM pomalidomide, and this ratio was maintained when pomalidomide treatment was continued under differentiation conditions (Figure 5A). Western blot analysis confirmed these observations on γ-globin expression upon pomalidomide treatment (Figure 5B). HPLC analysis of cells harvested at the end of the experiment (Day 10) showed that the HbF level of ~3% in untreated cells (DMSO solvent control) had increased to ~12% upon pomalidomide treatment. In primary erythroid cells obtained from an SCD patient, we observed a baseline level of ~10% HBG1/2 as a fraction of HBG1/2+HBB mRNA (Figure 5C). This increased to 15%–20% at Day 5 of treatment with 10 µM pomalidomide under proliferation conditions, further increasing to 30%–40% when pomalidomide treatment was continued under differentiation conditions (Figure 5C). Western blot analysis confirmed these observations on γ-globin expression upon pomalidomide treatment (Figure 5D). In HUDEP2 cells, baseline expression of HbF is low.19, 29 Following the schedule used for the primary cells (Figure 5A–D), we treated HUDEP2 and the reporter cells with 10 µM pomalidomide and analyzed globin expression by quantitative reverse-transcription polymerase chain reaction (RT-qPCR) (Figure 5E). Increased γ-globin expression was detectable at Day 3 and Day 5, and a further increase was observed when pomalidomide treatment was continued under differentiation conditions, reaching a maximum of 1%–5% at Day 10 (Figure 5E). HPLC analysis of cells harvested at the end of the experiment (Day 10) showed an HbF level of ~1%–2% in untreated cells and of ~3%–5% in pomalidomide-treated cells (Figure 5F). Detection of Aγ-HiBiT with the HiBiT Lytic Assay in the reporter cell line showed a significantly increased signal at Day 3 (3.5-fold, Figure 5G), which increased further until Day 10 (5.8-fold, Figure 5G). Western blot analysis of the parental HUDEP2 cells showed increased expression of β-globin during culture under differentiation conditions, while γ-globin was barely detectable even at Day 10 of pomalidomide treatment (Figure 5H). Similarly, increased expression of β-globin during culture under differentiation conditions was observed for the reporter cells (Figure 5I), while γ-globin expression could not be detected with the γ-globin antibody (data not shown). When the blot was probed with the HiBiT luminescence assay, increased expression of Aγ-HiBiT was already detectable at Day 3 of pomalidomide treatment and further increased at Days 5–10 (Figure 5I). Collectively, we conclude that HUDEP2 cells and the reporter cell line display very similar patterns of pomalidomide-mediated induction of γ-globin. These results also strongly support the specificity and sensitivity of Aγ-HiBiT detection by the lytic assay (Figure 5G) and on western blots (Figure 5I). Next, we treated reporter cells with a range of pomalidomide concentrations for 3 days in proliferation conditions. ATP quantification as a measurement of cell viability indicated no severe toxicity up to a final concentration of 50 μM pomalidomide (Figure 5J), and we observed a maximum 6.9-fold increase of Aγ-HiBiT signal with an EC50 around 0.9 µM pomalidomide (Figure 5K). To determine if pomalidomide activates HbF specifically or if it is promoting differentiation with an indirect effect on all globin expression levels, we next tested pomalidomide treatment under differentiation conditions. As expected, the Aγ-HiBiT signals increased upon induction of differentiation for 3 days. Compared to DMSO-treated cells, the addition of 50 μM pomalidomide resulted in a further 7.7-fold increase of the Aγ-HiBiT signal (Figure 5L). Thus, pomalidomide also increased γ-globin expression under differentiation conditions. Importantly, treatment with an unrelated compound that displayed high toxicity (CC50 = 1.7 µM, Figure 5M) did not increase the Aγ-HiBiT signal (Figure 5N). This indicated that cytotoxic stress did not reactivate HbF in the reporter cells, an important prerequisite for use in HTS applications. Finally, we tested the sensitivity of the reporter cells to the solvent DMSO. To our surprise, DMSO concentrations above 0.2% affected cell viability (CC50 = 0.55%, Figure 5O). For compound screening, final DMSO concentrations should therefore be kept below 0.1%.
The reporter cell line is HTS compatible
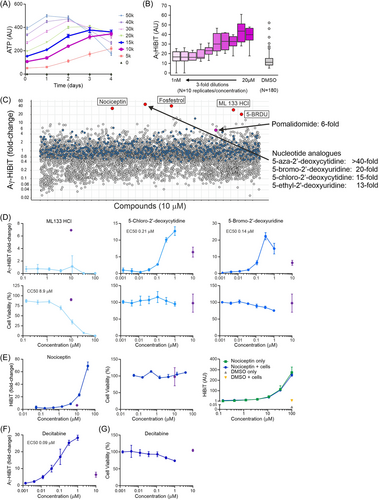
Having established that the Aγ-HiBiT reporter cells resemble the parental HUDEP2 cells and that pomalidomide can serve as a robust positive control for HbF induction, we aimed to validate the assay for high-throughput drug screening. HTS libraries include up to hundreds of thousands of compounds. To make a large screen feasible and cost-effective, these compounds are pre-plated in white opaque 384-well plates that are specially designed for robotized luminescence assays. The reporter cells would be required to survive plating by a liquid handling robot and a predefined incubation period in the individual wells. Subsequent robotic addition of the HiBiT lytic buffer, which also contains LgBiT and the luciferase substrate, followed by automated luminescence read-out would enable HTS. The pomalidomide experiments suggested that 3–4 days of incubation are required before measuring HbF induction. Longer incubation times require a medium change, which is undesirable in the HTS setting as this introduces a source of uncontrollable variability. To develop the HTS application, daily viability assays were performed after plating the reporter cells to 384-well plates in concentrations ranging from 0 to 50,000 cells in 50 µL medium per well. This showed that cultures starting with 10,000–15,000 cells per well displayed a linear expansion for up to 3 days (Figure 6A). Therefore, 12,500 cells per well in 50 µL medium were incubated for 3 days in 384-well plates pre-plated with pomalidomide dissolved in DMSO at concentrations ranging from 20 µM to 1 nM (10 concentrations, threefold serial dilutions) (Figure 6B). These initial tests in the 384-well format showed that further optimization was required. First, the maximum Aγ-HiBiT induction by pomalidomide, deduced from fully automated luminescence read-out after the addition of 50 µL lytic buffer per well, was lower than the ~6–7-fold observed in 96-well plates. Second, with 0.1% DMSO, some outlier wells occurred (6/180, Figure 6B). Third, with 100 µL total volume per well after the addition of lytic buffer, the airflow created by the automated plate reader caused the transfer of liquid between wells. In addition, high-speed injection of the lytic buffer created air bubbles. These issues were addressed by adding a reduced volume (25 µL) of lytic buffer at a lower speed and incubating the mixture for 10 min before read-out by the automated plate reader. The rapid expansion of the reporter cells is another prerequisite for HTS applications. In the fully defined serum-free proliferation culture medium, the reporter cells expand ~5-fold every 3 days. We prepared stocks of 20 million cells per vial stored in liquid nitrogen. For large experiments, we typically thaw 60 million cells and plate them at a density of 1 million cells/mL. The cells recover within 24 h after which they can be plated at 0.3 million cells/mL and expanded. Starting with 60 million cells, over 0.5 billion cells can be grown within a week, a number sufficient to perform ~40,000 assays in the 384-well format.
A pilot screen of an annotated drug library identifies a known HbF inducer
As a pilot screen, a collection of 5632 known bioactive/medicinal compounds was screened at 10 µM final concentration using the Aγ-HiBiT reporter cell line (Figure 6C). Pomalidomide was used as a positive control and to normalize for variation between the plates. Compared to the DMSO controls, the majority of the tested compounds resulted in a lower luminescence signal; this was interpreted as a sign of toxicity. The Aγ-HiBiT signal was detectable in the untreated reporter cells and a decrease in signal, therefore, indicated that the cells failed to survive the 3-day incubation period. Five compounds (0.089%) showed a >20-fold induction of the Aγ-HiBiT signal, while none of the DMSO-only wells exceeded this threshold (Figure 6C). In addition to the positive control wells, pomalidomide was also present in the screened collection, where it showed the expected sixfold induction. Furthermore, the library contained compounds targeting known HbF regulators. Three inhibitors of histone methyltransferases EHMT1/EHMT2,53-56 UNC0224, UNC0321, and A-366, displayed 4.9-, 4.7-, and 3.8-fold Aγ-HiBiT induction, respectively. The histone deacetylase (see Migliaccio et al.57 for review) inhibitor Bufexamac showed a 2.7-fold induction of the Aγ-HiBiT signal. The modest response to hydroxyurea (1.6-fold induction) is in agreement with previously reported data.58 We then tested serial dilutions of the top hits ML 113 HCl, 5-chloro-2′-deoxycytidine, 5-bromo-2′-deoxyuridine (5-BRDU), 5-aza-2′-deoxycytidine (Decitabine), and Nociceptin (Fosfestrol was not available for testing). ML 113 HCl did not induce Aγ-HiBiT expression and affected cell viability (CC50 = 8.9 µM, Figure 6D). Strong Aγ-HiBiT induction was observed upon treatment with 5-chloro-2′-deoxycytidine (EC50 = 0.21 µM) and 5-BRDU (EC50 = 0.14 µM); 5-BRDU displayed a modest impact on cell viability over the concentration range tested (Figure 6D). The addition of Nociceptin, a 17-amino acid neuropeptide, led to sharply increased signals in the HiBiT Lytic Assay at the high end of the concentration range without affecting cell viability (Figure 6E). Since we found that Nociceptin alone activates the HiBiT Lytic Assay (Figure 6E), we conclude that this is a false-positive hit. The top hit, with an Aγ-HiBiT induction over 40-fold, was decitabine (Figure 6C), a well-known HbF inducer that has been tested in clinical trials.50, 59, 60 Finding a known activator is a promising outcome of the pilot screen that contributes to the HTS validation of the reporter cell line. Much like typical HTS projects, in this pilot screen, all compounds were tested once at a fixed concentration of 10 μM. In larger screens identifying clusters of active compounds that share similarities in their chemical structures can help prioritize hits that are most likely true positives. In our pilot screen, a cluster of nucleotide analogs including decitabine all showed an induction of Aγ-HiBiT signal outperforming pomalidomide (Figure 6C,D). Finding such a cluster is promising and helps prioritize hit compounds selected for validation experiments. Treatment of the Aγ-HiBiT reporter cells with serially diluted decitabine in a 96-well format confirmed decitabine as a strong HbF-inducing agent (EC50 = 0.09 µM, Figure 6F). Decitabine displayed a modest impact on cell viability over the concentration range tested (Figure 6G). We conclude that the reporter cell line is capable of identifying clusters of HbF-inducing compounds. Most importantly, the pilot screen validates the Aγ-HiBiT reporter cell line as a robust tool for the unbiased identification of novel HbF-inducing compounds using the HTS approach.
DISCUSSION
Here, we report the development, characterization, and validation of an HbF reporter system in the erythroid progenitor cell line HUDEP2 to speed up the discovery of new treatments for patients with β-globinopathies. Careful sequence analysis of the human HBG genes allowed the design of an HBG1-specific gRNA and CRISPR-mediated tagging of the HBG1 gene. In contrast to available HbF reporter cell lines that rely on exogenous DNA constructs, this new reporter cell line contains a short tag at the HBG1 gene to evaluate endogenous HbF expression. The bioluminescent tagging of Aγ-globin provides a quantitative and specific readout that is not affected by the auto-fluorescence of either the cells or the tested compounds. The identification of the known HbF inducer decitabine, out of >5000 compounds tested in the pilot screen, provides confidence in its suitability for high-throughput drug screening. We provide details of a serum-free fully defined cell culture medium and recommended cell density and incubation times. The 3-day incubation period requires compound stability in aqueous solution, possibly explaining why pomalidomide49, 51, 52 (sixfold induction) was active while thalidomide61-64 (1.1-fold induction) was negative in the pilot screen. Our approach is in line with incubation times of 3–4 days in previously reported ELISA-based screens in HUDEP2 cells in 384-well plates.22, 65 In addition to screening small molecules, the Aγ-HiBiT reporter cell line provides a bench-top assay to evaluate genetic HbF-inducing therapies. Other applications in the pursuit of HbF-inducing therapies can be tested, for example, for the evaluation of HbF induction by short hairpin RNAs66 or microRNAs.67, 68 The current version of the Aγ-HiBiT reporter cell line does have several limitations. First, the luciferase assay evaluates the expression of HBG1 at the population level. For single-cell analysis (e.g., to determine if HbF induction occurs equally in all cells), we are currently developing a second reporter line that contains a fluorescent tag, making it compatible with flow cytometry analysis. The reported sequence of the 3′-UTR (that differs from the human reference genome GRCh38) provides a strategy to tag HBG1/HBG2 with any tag of choice. Second, the cells proved to be sensitive to DMSO concentrations above 0.1%, which limits the range of concentrations in which DMSO-dissolved compounds can be tested. The pilot screen provided proof of concept for HTS testing of compounds at an initial concentration of 10 µM without exceeding the DMSO toxicity limit. For HTS applications, we suggest including a column of 10 μM pomalidomide samples as positive controls on every plate to evaluate plate-to-plate variation and to normalize the data of test compounds against the median of the DMSO solvent controls. Lastly, we recommend performing initial screening under proliferation conditions. As shown, starting at the correct cell density allows the expansion of the reporter cells throughout the incubation interval of a compound screen. Screening in proliferating reporter cells is advantageous because fewer cells are required at the plating phase while screening in differentiation conditions would introduce noise arising from variability in differentiation states within and between experiments. Potential limitations of screening in the proliferation state include false-negative results for HbF inducers that simultaneously block the cell cycle; an increase in the Aγ-HiBiT signal per cell might be missed if the well contains fewer cells than control wells. Since the HUDEP2-based Aγ-HiBiT reporter cells express very low levels of HbF, weak inducers are most at risk of being missed. In addition to false negatives, screening in the proliferation state might also give false positive results if differentiation is induced by the compound tested since during differentiation expression of globins including HbF increases. In rare instances, the compound itself may activate the HiBiT assay. We found that this is the case with Nociceptin, a 17 amino acid peptide. As part of the hit triage strategy, such false positive hits would be quickly identified in validation experiments.
To speed up the discovery of novel HbF-inducing therapies, laboratories around the world should be working on this pursuit in parallel. The Aγ-HiBiT reporter cell line is therefore available to the research community through the RIKEN BioResource Research Center Cell Bank, Tsukuba, Ibaraki, JP.
AUTHOR CONTRIBUTIONS
Thijs C. J. Verheul, Nynke Gillemans, Kerstin Putzker, Rezin Majied, Tingyue Li, Memnia Vasiliou, Bert Eussen, Annelies de Klein, Wilfred F. J. van IJcken, and Ulrike Uhrig performed experiments. Thijs C. J. Verheul, Bert Eussen, Annelies de Klein, Wilfred F. J. van IJcken, and Sjaak Philipsen analyzed data. Emile van den Akker, Marieke von Lindern, and Yukio Nakamura provided essential materials and expertise. Ulrike Uhrig, Joe Lewis, Thamar van Dijk, and Sjaak Philipsen supervised the experiments. Thijs C. J. Verheul, Joe Lewis, and Sjaak Philipsen designed the experiments. Thijs C. J. Verheul and Sjaak Philipsen wrote the paper. All authors critically reviewed and agreed with the paper.
CONFLICT OF INTEREST STATEMENT
The authors declare no conflict of interest.
FUNDING
Work in our laboratories was supported by the Landsteiner Foundation for Blood Transfusion Research (1627), Sophia Childrens' Hospital Foundation (WAR20-21), Erasmus MC Human Disease Models award (108842), TKI Health Holland (EMCLSH20025), ZonMW PSIDER consortium TRACER (10250022110001), and NWO Applied and Engineering Sciences Open Technology Programme (18947).
Open Research
DATA AVAILABILITY STATEMENT
The data that support the findings of this study are openly available in the European Nucleotide Archive at https://www.ebi.ac.uk/ena/browser/search, reference number PRJEB67342 and PRJEB31728.


