Prospective evaluation of oral premalignant lesions using a multimodal imaging system: a pilot study
Funding information: Cancer Prevention and Research Institute of Texas, Grant/Award Number: RP100932; National Institutes of Health, Grant/Award Numbers: F30CA213922, RO1CA103830, RO1CA185207, RO1DE024392
Abstract
Background
Multimodal optical imaging, incorporating reflectance and fluorescence modalities, is a promising tool to detect oral premalignant lesions in real-time.
Methods
Images were acquired from 171 sites in 66 patient visits for clinical evaluation of oral lesions. An automated algorithm was used to classify lesions as high- or low-risk for neoplasia. Biopsies were acquired at clinically indicated sites and those classified as high-risk by imaging, at the surgeon's discretion.
Results
Twenty sites were biopsied based on clinical examination or imaging. Of these, 12 were indicated clinically and by imaging; 58% were moderate dysplasia or worse. Four biopsies were indicated by imaging evaluation only; 75% were moderate dysplasia or worse. Finally, four biopsies were indicated by clinical evaluation only; 75% were moderate dysplasia or worse.
Conclusion
Multimodal imaging identified more cases of high-grade dysplasia than clinical evaluation, and can improve detection of high grade precancer in patients with oral lesions.
1 INTRODUCTION
There are over 300 000 new cases of oral cancer each year,1 and the stage at diagnosis is the best predictor of survival. In the United States, the 5-year mortality for localized oral cancer is 83%, compared to only 39% after distant metastasis.2 Unfortunately, most patients are diagnosed at a late stage, leading to an overall mortality rate of approximately 50%.
Oral premalignant lesions (OPLs), most commonly leukoplakia and erythroplakia, are oral mucosal lesions with the potential to undergo malignant transformation to oral cancer, making them a promising target to reduce oral cancer mortality. OPLs exhibit widespread variability in their malignant transformation rates.3 Clinicians acquire tissue biopsies to identify OPLs with high-grade dysplasia, which are at greatest risk for progression and may be managed with surgical excision or aggressive surveillance.4 However, it is challenging to optimally select which OPLs to biopsy and to select a biopsy location, particularly for patients with large, multifocal, or heterogeneous lesions.5, 6 Several diagnostic adjuncts have been investigated to aid in OPL evaluation, including vital stains such as toluidine blue,7, 8 brush biopsies,9, 10 salivary tests,11, 12 light-based adjuncts such as macroscopic autofluorescence imaging (AF),13-15 and in recent years, in-vivo microscopy techniques.16-19 Unfortunately, no adjunct has been shown to have sufficient diagnostic accuracy for high-grade dysplasia and cancer to warrant routine use.16, 20, 21
Recently, we developed a multimodal imaging system (MMIS) which integrates traditional white-light (WL) evaluation with AF and high-resolution microendoscopy.22 AF measures the native tissue autofluorescence of the patient's mucosa using blue excitation light. Dysplastic changes are associated with altered stromal collagen structure, increased epithelial scattering, and angiogenesis that lead to a large loss of blue-green autofluorescence with occasional gains in red autofluorescence.23, 24 AF can be used to quickly assess large fields of mucosa with high sensitivity for high-grade dysplasia and cancer.25 Unfortunately, inflammation leads to a similar loss of AF, reducing specificity.24, 26 To improve specificity, we developed the high resolution microendoscope (HRME) to image changes in nuclear morphology.27, 28 The HRME is a fiber optic fluorescence microscope which images epithelial nuclear morphology following topical application of the fluorescent dye proflavine. Because altered nuclear morphology is a key hallmark of dysplasia, the HRME can be used to detect high-grade dysplasia and cancer with high sensitivity and specificity.26, 29, 30
The MMIS acquires and processes WL and AF images to identify the most suspicious regions within a lesion with high sensitivity. HRME images from the suspicious regions are then acquired and processed to improve specificity. An integrated user interface controls image acquisition and display, and performs automated image analysis in real-time to classify sites as high risk or low risk for neoplasia. The algorithms were developed in previous studies, in which features from separate AF and HRME imaging systems were retrospectively calculated and combined with linear thresholds to accurately distinguish high-grade dysplasia and cancer from benign tissue.26, 29, 30
In this pilot study, we used the integrated MMIS to prospectively evaluate OPL patients under surveillance for malignant transformation at M.D. Anderson Cancer Center in Houston, Texas. Patients were first clinically evaluated per standard of care by an experienced head and neck surgeon, then were evaluated with the MMIS. Biopsies were performed if clinically indicated or based on the MMIS evaluation, at the surgeon's discretion. We compare the results of clinical evaluation, MMIS evaluation, and histopathology (where available) at imaged sites.
2 PATIENTS AND METHODS
2.1 Human subjects
The clinical study was performed at MD Anderson Cancer Center (MDACC) in Houston, TX, in accord with recognized ethical guidelines using protocols approved by the Institutional Review Boards at both MDACC and Rice University (Houston, TX). Patients 18 years or older presenting with at least one oral lesion, either as new patients or as part of regularly scheduled surveillance visits, were recruited. Written informed consent was obtained from all subjects prior to imaging.
2.2 Study procedure
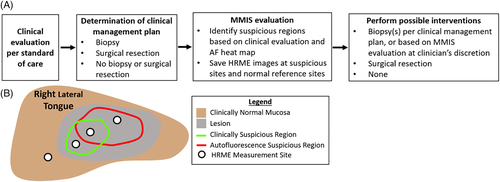
The study procedure is summarized in Figure 1A.
2.2.1 Clinical evaluation per standard of care
A head and neck surgeon with expertise in oral lesions (A.G.) performed a standard of care clinical evaluation, including visual examination and palpation of the oral cavity to identify and assess oral lesions.
2.2.2 Determination of clinical management plan
Following clinical evaluation, the surgeon decided on the clinical management plan. Management was categorized into three groups: (a) biopsy; (b) surgical resection; or (c) no biopsy or surgical resection. If a biopsy was indicated, the biopsy site was also determined. Patients whose management was “surgical resection” had lesions that were so suspicious that a negative biopsy would be interpreted as selection bias due to nonoptimal site selection.
2.2.3 Multimodal imaging system evaluation
Next, patients were evaluated with the MMIS, which acquires, displays, and performs automated real-time analysis of macroscopic white-light reflectance (WL), macroscopic autofluorescence (AF) images, and high-resolution microendoscope (HRME) images. The imaging hardware is connected by USB to a touchscreen laptop, which runs the MMIS software. The MMIS has been previously described in detail22; selected details are also provided in the “MMIS Hardware and Automated Analysis” section.
Figure 1B schematizes the MMIS evaluation procedure, which typically required <10 minutes. The first step was to acquire macroscopic WL and AF image pairs of the oral lesion(s), and to use the results to identify the most suspicious region(s) within the lesion(s). Multiple image pairs could be acquired for patients with multiple lesions. For each image pair, the WL image was displayed on the MMIS laptop, then the surgeon outlined the most suspicious region(s) based on clinical evaluation using the touchscreen (Figure 1B, green outline). Next, the MMIS processed the AF image to generate an interactive risk heat map, based on a feature called the normalized Red:Green (RG) ratio, that was overlaid on the WL image. Generating the heat map overlay required the surgeon to outline the mucosal area of the WL image while the software used an automated image registration algorithm to align the WL and AF images with a geometric translation. In some cases, user error in outlining the mucosa or failure of the registration algorithm resulted in an incorrect heat map; these images were excluded from the subsequent analysis. The surgeon used the heat map overlay to outline suspicious region(s) based on AF (Figure 1B, red outline). AF signal from the dorsal tongue was not used in outlining regions because the normal dorsal tongue frequently emits bright red autofluorescence.
The surgeon explored the outlined suspicious regions (based on clinical evaluation and the heat map) with the HRME, saving representative images (Figure 1B, white dots) at HRME measurement sites. An HRME image was always saved at any biopsy sites that were part of the clinical management plan. For reference, in some cases the surgeon also saved HRME images at clinically normal sites adjacent to the lesion. After each HRME image was saved, the Number of Abnormal Nuclei/mm2, an HRME feature elevated in high-grade dysplasia and cancer, was automatically calculated and displayed. During the calculation, the surgeon provided a clinical impression of the HRME site in one of three categories: 1) normal mucosa, 2) abnormal mucosa, low risk, or 3) abnormal mucosa, high risk. At some sites, the HRME was unable to visualize nuclei due to the presence of a superficial keratin layer or granulation tissue; if saved, these images were excluded from subsequent analysis.
After HRME image acquisition, the surgeon located the HRME sites on the WL image using the touchscreen. The MMIS used a linear classifier combining the normalized RG ratio and Number of Abnormal Nuclei/mm2 to classify each site as “high risk” or “low risk”. If more than one HRME image was acquired at the same site, the worst classification amongst the images was used to evaluate the site.
2.2.4 Perform possible interventions
Sites with a clinical management plan of “biopsy” received 4 mm diameter punch biopsies immediately following MMIS evaluation. The surgeon also had the option to acquire punch biopsies at sites with a clinical management plan of “no biopsy or surgery” but an MMIS classification of “high risk”. Biopsies were processed and interpreted by MDACC pathologists per standard procedure. Patients whose clinical management was “surgical resection” were scheduled for surgery at a later date.
2.3 Multimodal imaging system hardware and automated analysis
2.3.1 Hardware
Macroscopic WL and AF images were acquired as shown in Figure 2A, with room lights off. The user initiated image acquisition by pressing a button on the instrument. AF images were acquired using blue 405 nm LED excitation light; fluorescence emission traveled through a 435 nm longpass filter and was focused onto a color CCD camera. WL images were acquired using a white light LED for illumination. The focal length was set to achieve a 4.5 cm diameter field of view with 100 μm lateral resolution.
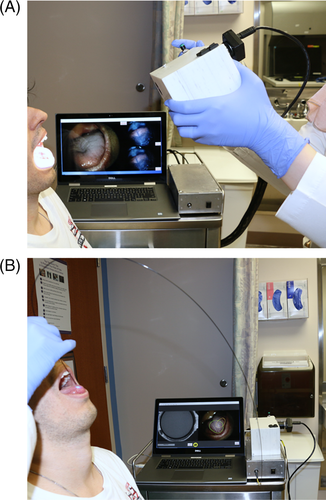
HRME images were acquired as shown in Figure 2B. The user topically applied proflavine (0.01% w/v in PBS), a fluorescent dye that stains cell nuclei, to the mucosa with a cotton-tipped applicator. Then, the tip of a multimodal optical fiber bundle with 790 μm diameter and 4.4 μm core-to-core spacing was gently placed in contact with the oral mucosa. Excitation light from a 460 nm LED was focused onto the proximal end of the fiber. The fiber coupled the excitation light through the fiber to the oral mucosa, and the resulting fluorescence emission from the mucosa back through the fiber, where it was filtered and focused onto a monochrome CCD. A foot pedal paused and un-paused the live HRME image feed.
2.3.2 Heat map
The MMIS generated a heat map to identify suspicious regions based on AF22. The normalized RG ratio, defined as the ratio between the red and green intensity within the mucosa of interest divided by the same quantity within a normal region of mucosa, was calculated at each pixel and blurred with a Gaussian filter. Pixels with a normalized RG ratio ≥1.40 were assigned to a color from a colormap that transitioned from black to red to yellow to white. All pixels with a normalized RG ratio greater than 2.20 were assigned white. Pixels with a normalized RG ratio <1.40 were not assigned a color, and therefore not highlighted by the heat map.
2.3.3 Number of abnormal nuclei/mm2 algorithm
The number of abnormal nuclei/mm2 algorithm identified individual nuclei within the image and was used to classify each nucleus as normal or abnormal based on its area and eccentricity.22 Nuclei with an area > 200 μm2, or with an area > 170.8 μm2 and eccentricity >0.705, were considered abnormal. The Number of Abnormal Nuclei/mm2 was defined as the density of abnormal nuclei.
2.3.4 Risk classification
The MMIS classified sites for which 47*(normalized RG ratio) + (Number of Abnormal Nuclei/mm2) > 273 as “high risk”.22 Sites that did not meet this criteria were “low risk”.
3 RESULTS
3.1 Patient population
Table 1 summarizes the study population. A total of 38 patients, of which 28 were male, were evaluated at 66 individual clinic visits. Patient age ranged from 35 to 80 with a median of 59. A total of 21 patients had a history of tobacco use, 20 had a history of oral cancer, and 8 had a history of radiation treatment.
| Patient characteristics | Number of patients |
|---|---|
| Number of patients | 38 |
| Total visits | 66 |
| Median age (years) | 59 (Range: 35-80) |
| Sex | |
| Male | 28 |
| Female | 10 |
| Smoking or tobacco history | |
| Yes | 21 |
| No | 17 |
| History of oral cancer | |
| Yes | 20 |
| No | 18 |
| History of radiation treatment | |
| Yes | 8 |
| No | 30 |
3.2 Images acquired
A total of 90 macroscopic WL and AF image pairs were acquired at 65 visits, with 1 to 3 image pairs acquired per visit. (Macroscopic images were not acquired at one visit due to a hardware issue.) For two image pairs, proflavine was mistakenly applied to the mucosa before image acquisition, interfering with the autofluorescence signal. Eight image pairs did not have an accurate real-time heat map overlay, due to user error in outlining the mucosa (2) and failure of the image registration algorithm (6). These image pairs were excluded, leaving 80 image pairs from 61 visits.
188 HRME measurement sites were acquired from sites within these 80 image pairs. At three sites, the AF signal was invalid due to location on the dorsal tongue (1) and visualization of the site using a mirror (2). Seven HRME images did not contain nuclei, because they were of keratin (6) or granulation tissue (1). These sites were excluded, leaving 178 HRME measurement sites associated with 80 macroscopic image pairs from 61 visits.
Three visits, in which four macroscopic image pairs and seven HRME measurement sites were acquired, had a clinical management plan of “surgical resection”. These images were also excluded because the surgical resection boundaries were not determined until the surgery, so it was not possible to determine the clinical management plan at individual HRME measurement sites. Therefore, the final analysis included 171 sites from 76 macroscopic image pairs from 58 visits.
3.3 Patient visit example
Figure 3 is an example of a visit in which the MMIS evaluation led to a biopsy that would not have been acquired under the standard of care. The patient was seen with a right ventral tongue lesion, and the clinical management was “no biopsy or surgical resection”. The MMIS acquired macroscopic WL and AF images of the lesion (Figure 3A,B). The surgeon outlined two suspicious regions based on clinical evaluation (posterior and anterior green outlines). The heat map was overlaid on the images (Figure 3C,D), based on which three suspicious regions (posterior, middle, and anterior red outlines) were outlined. The posterior heat map region overlapped with the posterior clinical region, and the middle heat map region partially overlapped with the anterior clinical region. The anterior heat map region did not overlap with any of the clinical regions.
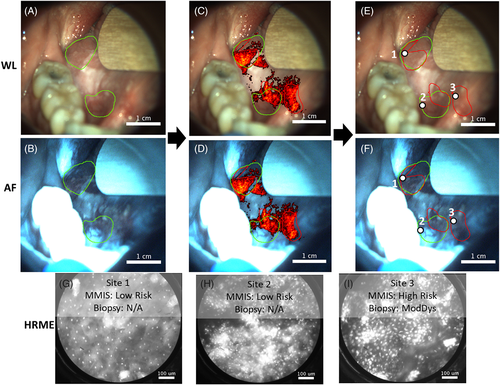
The regions were explored with the HRME, and HRME images (Figures 3G-I) were saved at three sites (Figures 3E,F, white circles), all of which had a clinical impression of “abnormal mucosa, high risk”. Sites 1 and 2 were classified as “low risk” by the MMIS (normalized RG ratio and number of abnormal nuclei/mm2 of 1.53/16 and 1.38/147, respectively). Site 3, which was located within the anterior heat map region but neither of the clinical regions, was classified as “high risk” (normalized RG ratio and number of abnormal nuclei/mm2 of 1.61/265). Based on the MMIS classification, the surgeon biopsied site 3, which was diagnosed histopathologically as moderate dysplasia.
3.4 Results of clinical evaluation, multimodal imaging system evaluation, and histopathology
The clinical impressions, clinical management plans, MMIS classifications, and available histopathological diagnoses for the 171 sites included in the analysis are summarized in Table 2.
| Clinical impression | Clinical management plan | MMIS classification | # of Biopsied sites | Biopsy yielda |
|---|---|---|---|---|
Normal mucosa (49 sites) |
No biopsy or surgery (49 sites) |
Low risk (49 sites) |
0 sites | N/A |
Abnormal mucosa, low risk (73 sites) |
No biopsy or surgery (72 sites) |
Low risk (56 sites) |
0 sites | N/A |
High risk (16 sites) |
2 sites | 50% (1/2) |
||
Biopsy (1 site) |
Low risk (1 site) |
1 site | 100% (1/1) |
|
Abnormal mucosa, high risk (49 sites) |
No biopsy or surgery (34 sites) |
Low risk (18 sites) |
0 sites | N/A |
High risk (16 sites) |
2 sites | 100% (2/2) |
||
Biopsy (15 sites) |
Low risk (3 sites) |
3 sites | 67% (2/3) |
|
High risk (12 sites) |
12 sites | 58% (7/12) |
- a To calculate the biopsy yield, moderate dysplasia or worse was considered positive.
The clinical impression was “normal mucosa” at 49 sites. At all these sites, the clinical management plan and MMIS classification were “no biopsy or surgery” and “low risk”, respectively. No biopsies were acquired.
The clinical impression was “abnormal mucosa, low risk” at 73 sites. A total of 72 of the 73 had a clinical management plan of “no biopsy or surgery”, and the MMIS classified 56 of the 72 as “low risk”. None of these sites were biopsied. The other 16 sites were classified by the MMIS as “high risk”, and the surgeon chose to biopsy two of these sites based on the MMIS results. One site was moderate to focal severe dysplasia, and the other was mild dysplasia. There was one site with a clinical impression of “abnormal mucosa, low risk” but a clinical management plan of “biopsy”. The MMIS classified this site as “low risk”, but the biopsy revealed severe dysplasia.
The clinical impression was “abnormal mucosa, high risk” at 49 sites. At 34 of these sites, the clinical management plan was “no biopsy or surgery”. The MMIS classified 18 of the 34 as “low risk”; these sites were not biopsied. The MMIS classified the remaining 16 sites as “high risk”. The surgeon chose to biopsy two of these sites, both of which were diagnosed histopathologically as moderate dysplasia. Fifteen sites had a clinical impression of “abnormal mucosa, high risk”, and a clinical management plan of “biopsy”. The MMIS classified three of these sites as “low risk”, but the biopsies revealed squamous cell carcinoma, moderate dysplasia, and mild dysplasia. The MMIS classified the remaining 12 sites as “high risk”, and the biopsies revealed squamous cell carcinoma at one site, severe dysplasia or carcinoma-in-situ at five sites, moderate dysplasia at one site, mild dysplasia at four sites, and benign tissue at one site.
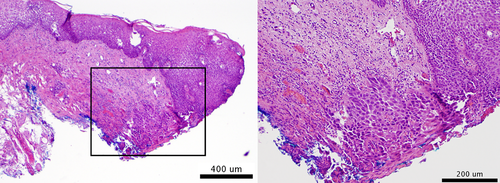
Overall, 20 biopsies were acquired. Twelve were acquired from sites with a clinical management plan of “biopsy” and an MMIS classification of “high risk”, of which seven were moderate dysplasia or worse. Four biopsies were acquired from sites with a clinical management plan of “no biopsy or surgery” but an MMIS classification of “high risk”. Three were moderate dysplasia or worse, indicating that the MMIS identified high-grade dysplasia that would not have been identified by the standard of care alone. Four biopsies were acquired from sites with a clinical management plan of “biopsy” but an MMIS classification of “low risk”. Three were moderate dysplasia or worse, representing false negatives by the MMIS. Further examination of the severe dysplasia false negative revealed a tissue section with 3 mm of normal mucosa and only 1 mm of severe dysplasia at the edge (Figure 4).
4 DISCUSSION
In this pilot study of the MMIS, a head and neck surgeon evaluated patients with OPLs per standard of care, and determined a clinical management plan. Patients were then evaluated by the MMIS, which classified imaged sites as “high risk” or “low risk”, and biopsies were acquired per the clinical management plan. Additional biopsies at sites classified as “high risk” by the MMIS were also acquired, at the surgeon's discretion.
For most of the imaged sites, the clinical evaluation and MMIS evaluation were in accord. All 49 sites with a clinical impression of “normal mucosa” were classified by the MMIS as “low risk”. A total of 57 of the 73 sites with a clinical impression of “abnormal mucosa, low risk” were classified by the MMIS as “low risk”. A total of 28 of the 49 sites with a clinical impression of “abnormal mucosa, high risk” were classified by the MMIS as “high risk”, including 12 of the 15 “abnormal mucosa, high risk” sites that the surgeon biopsied as part of the standard of care.
However, at sites where there was disagreement, the clinical management plan and MMIS evaluation each identified cases of high-grade dysplasia or cancer that the other did not. For example, the MMIS classified 32 sites with a clinical management plan of “no biopsy or surgery” as “high risk”. The surgeon chose to biopsy four of these sites, and three were moderate dysplasia or worse. An example was shown in Figure 2, where the MMIS identified abnormal nuclei within a region highlighted by the heat map, which led to a moderate dysplasia diagnosis. The pathology at the other 28 sites (ie, those classified by the MMIS as “high risk” but not biopsied) is unknown. The reasons the surgeon did not biopsy these sites varied. Some patients were biopsied at another site, and the surgeon did not want to acquire multiple biopsies in a single visit. Some patients' lesions were not easily amenable to surgical resection, so knowledge of high-grade dysplasia would not alter management. Other factors included patient preference and time since a patient's last biopsy.
The opposite scenario, in which the clinical management plan called for a biopsy but the MMIS classification was “low risk”, occurred at four sites. Three were moderate dysplasia or worse, representing false negatives by the MMIS. The biopsy at one of these false negatives, a severe dysplasia site, had 3 mm of normal tissue and 1 mm of severe dysplasia. The diameter of the HRME probe is <1 mm, so the false negative may have occurred because the probe was placed on the normal part of the biopsy site. The other two false negatives may have occurred due to the difficulty of accurately correlating imaging sites with biopsy sites.
Overall, these results demonstrate that the MMIS can improve the clinical evaluation of OPLs by identifying high-grade dysplasia that would not have been identified by the standard of care. However, they also indicate that a negative MMIS result in a high-risk population may not be sufficient justification to avoid a clinically indicated biopsy.
This study highlights the promise of the MMIS, but also reflects its status as an emerging technology that requires additional fine-tuning, further elucidation of its role in patient care, and randomized studies with larger sample sizes. The classification algorithm could also be improved as additional data are acquired. More broadly, the optimal role of the MMIS has yet to be determined. The false negatives in this study, which may have been the result of the HRME's small field of view, suggest that a greater emphasis on mapping the lesion may be beneficial. Towards this goal, we have developed a “roller-ball” HRME which uses a ball lens to smoothly mosaic across the mucosa, increasing the field of view.31 Additionally, we recently demonstrated that AF has the potential to help clinicians surveil lesions over time32; with the additional microscopic information provided by the HRME, the MMIS could be even better suited for such an application.
ACKNOWLEDGMENTS
This work was supported by National Institutes of Health grants RO1CA103830 (to R. Richards-Kortum), RO1CA185207 (to R. Richards-Kortum), RO1DE024392 (to N. Vigneswaran), F30CA213922 (to E. Yang); and by the Cancer Prevention and Research Institute of Texeas (CPRIT) grant RP100932 (to R. Richards-Kortum).


