Frequency-specific age-related decreased brain network diversity in cognitively healthy elderly: A whole-brain data-driven analysis
Abstract
Age-related changes in functional brain network have been well documented. However, recent studies have suggested the nonstationary properties of the functional connectivity of the brain, and little is known about the changes of functional connectivity dynamics during aging. In this study, a two-step singular value decomposition was introduced to capture the dynamic patterns of the time-varying functional connectivity in different frequency intervals, and the whole-brain and regional brain diversity were quantified by using Shannon entropy. The relationships between age and functional connectivity dynamics were investigated in a relatively large sample cohort of cognitively healthy elderly (N = 188, ages 65–80). The results showed an age-related decreased diversity in the whole brain as well as in the right inferior frontal gyrus, right amygdala, right hippocampus, left parahippocampal, and left inferior parietal gyrus in the frequency interval of 0.06–0.12 Hz. In addition, the whole-brain diversity during resting state could also reflect the general mental flexibility. This study provided the first evidence of frequency-specific age effects on the functional connectivity dynamics in cognitively healthy elderly, and may shed new light on the dynamic functional connectivity analysis of aging and neurodegenerative diseases.
1 INTRODUCTION
With the rapidly increasing of the aging population all over the world, more and more studies focused on the investigations of the age-related changes on the brain (Geerligs, Renken, Saliasi, Maurits, & Lorist, 2015; Grady, 2012; Lindenberger, 2014). Normal aging is considered to be related with evidences of structural and functional changes of brain, which would further lead to reductions in cognition and information processing and result in a lower life quality in later life (Gutchess, 2014; Li et al., 2015). Understanding the mechanism of brain aging may shed light on the manipulations and interventions of brain for age-related preservation, and improve our understanding of the mechanism of neurodegenerative diseases (Ferreira & Busatto, 2013).
The advent of functional magnetic resonance image (fMRI) provides a noninvasive tool to explore the functional changes of the brain due to diseases, aging, as well as development. Emerging evidences suggested that age-related alterations of brain activity in the default mode network (DMN), the fronto-parietal control network (FPCN), as well as their inter-networks connections (Geerligs, Maurits, Renken, & Lorist, 2014; Grady et al., 2010; Li et al., 2015). Recent studies have consistently reported the age-related decreased brain segregation in both cognitively healthy elderly and across healthy adult life-span (Chan, Park, Savalia, Petersen, & Wig, 2014; Ng, Lo, Lim, Chee, & Zhou, 2016).
Although these functional connectivity studies have demonstrated reliable age-related changes in elderly, one thing should be noted is that the functional connectivity analysis has assumed the functional connections among distinct brain regions are stationary throughout time. Emerging evidences in recent studies have suggested that the functional connectivity is not static but exhibits highly temporal dynamic patterns through time (Calhoun, Miller, Pearlson, & Adali, 2014; Hutchison et al., 2013). The dynamics of functional connectivity was thought to be shaped by the structure connections and reflect a responsive state of the brain during resting state (Shen, Hutchison, Bezgin, Everling, & McIntosh, 2015; Zalesky, Fornito, Cocchi, Gollo, & Breakspear, 2014).
More and more studies have reported the alterations of dynamic functional connectivity during resting state were associated with conscious as well as pathological states (Chen et al., 2016; Kucyi & Davis, 2014; Zhang et al., 2016). Recently, the age-related changes of dynamic functional connectivity were also reported. Hutchison and Morton (2015) investigated functional connectivity dynamic over development with subjects aged from 9.4 to 32.4 years older, and observed the age-related increased internetworks connectivity variability during resting-state and age-related decreased internetworks variability during a cognitive control task. Qin et al. (2015) reported the age-dependent changes of functional connectivity during development within and between specific networks and demonstrated the dynamic functional connectivity could be used to predict brain maturity. Yin et al. (2016) investigated the age-related changes of functional flexibility of the brain across lifespan and found opposite changes of flexibility in frontal and parietal during brain maturation and aging. However, these methods mainly focused on the variance of functional connectivity between given pairs of regions of interest (ROI), the changes of whole-brain network patterns were not well considered. In addition, previous studies about age-related dynamic functional connectivity changes mainly focused on the development stage or across lifespan with very small elderly samples, little is known about the changes of functional connectivity dynamics during aging.
To characterize the dynamic of the whole-brain connectivity, Allen et al. (2014) used k-means clustering to identify the dynamic functional connectivity states during rest, and this method provide a potential powerful approach to investigate the changes of reoccurring short-term connectivity states in resting fMRI. However, this approach assumed the brain should present a separate connectivity pattern at each time point. Recent study has pointed out that the task-related functional connectivity was well described as alternating distinct connectivity states while the resting state connectivity state could be better described by a combination of multiple overlapping states (Leonardi, Shirer, Greicius, & Van De Ville, 2014). The principal component analysis/singular value decomposition (SVD) approaches could treat the dynamic functional connectivity as the building blocks of dynamic patterns (Leonardi et al., 2013; Leonardi et al., 2014), and may be a better way to describe the dynamic functional connectivity during resting-state.
In this study, we introduced a whole-brain data-driven approach to quantify the diversity of the brain in a relatively large sample cohort of cognitively healthy elderly. First, wavelet-decomposition was used to decompose the fMRI signals into specific frequency bands, and time-varying functional connectivity was estimated in frequency-specific time scale. Then, by using k-means clustering and two-step SVD, the time-varying functional connectivity was represented as a linear combination of the stationary component and dynamic components, and Shannon's entropy was used to quantify the brain diversity on both whole-brain network level and regional level. Finally, the alterations of brain diversity during aging were explored from the perspective of whole brain network dynamics.
2 MATERIALS AND METHODS
2.1 Participants
The participants in this study is part of a larger community sample from the Risk Index for Subclinical brain lesions in Hong Kong study, which is used to investigate the risk index for screening subclinical brain lesions (Wong et al., 2015). The participants were recruited from the local community centers, and screened by a battery of neuropsychological tests, including the Hong Kong version Montreal Cognitive Assessment (HK-MoCA) (Wong et al., 2009) for the global cognitive function evaluation, and the Barthel Index (BI) (Mahoney & Barthel, 1965) and Lawton's Instrumental Activity of Daily Living (IADL) (Lawton & Brody, 1969) scales for the functional independence test. The inclusion criteria were: (a) aged 65–80 years; (b) right-handed; (c) intact daily life activities, BI = 20 and IADL <2; (d) cognitively healthy defined by the age and education corrected HK-MoCA (Wong et al., 2015). Participants with any history of clinical stroke/transient ischemic attack/large cerebral infarcts, history of psychiatric and/or neurological disorders, or evidence of brain tumors were excluded. Supine blood pressure was also assessed at study enrollment. Approval was given by the Joint Chinese University of Hong Kong-New Territories East Cluster Clinical Research Ethics Committee (CUHK-NTEC CREC), and written informed consent was obtained from all the participants.
A total of 219 cognitively healthy elderly were included in this study. Twenty-eight subjects were excluded due to excessive head motion, and one subject was excluded due to bad image quality. Two subjects missing blood pressure information were also excluded. Thus, 188 subjects were retained in the further analysis. The demographic and neuropsychological characteristics of the retained elderly are shown in Table 1.
| Characteristics | Study cohort (N = 188) |
|---|---|
| Demographic characteristics | |
| Age (years) | 70.86 ± 3.94 |
| Gender (male/female) | 70/118 |
| Education years | 8.36 ± 4.63 |
| Neuropsychological measures | |
| HK-MoCA scores | 24.46 ± 2.85 |
| Animal fluency scores | 16.77 ± 4.13 |
| SDMT scores | 32.71 ± 10.92 |
- Data are presented as mean ± standard deviations. HK-MoCA = Montreal Cognitive Assessment Hong Kong version; SDMT = symbol digit modalities test.
2.2 Data acquisition
All participants were scanned using a 3 T Philips MRI scanner (Achieva TX, Philips Medical System, Best, the Netherlands) with an eight-channel SENSE head coil. The high-resolution T1-wieghted anatomical image up to 305 sagittal slices were first obtained with the following parameters: repetition time (TR) = 7.5 ms, echo time (TE) = 3.5 ms, flip angle = 8°, field of view (FOV) = 250 × 250 mm2, and voxel size = 1.04 × 1.04 × 0.6 mm3. Functional MRI images were acquired as a series of 210 continuous resting state volumes using a T2-weighted gradient echo-planar imaging sequence: TR = 2,050 ms, TE = 25 ms, flip angle = 90°, FOV = 205 × 205 mm2, voxel size = 3.2 × 3.2 × 3.2 mm3, slices = 47. All participants were instructed to keep their eyes open at a cross on the screen.
2.3 Data preprocessing
Conventional data preprocessing procedures were performed using Statistical Parametric Mapping software (SPM12, http://www.fil.ion.ucl.ac.uk/spm/). The preprocessing procedures included the following steps: discarding the first 10 volumes, slice-timing, realignment for head motion correction, coregistering the anatomical scan to the mean realigned functional image. The coregistered T1 and T2-FLAIR images were combined to segment into various tissue classes including gray matter, white matter, and cerebrospinal fluid, then a study-specific anatomic template was created using the Diffeomorphic Anatomical Registration Exponentiated Lie algebra toolbox (Ashburner, 2007), and the corrected functional images were nonlinearly spatial normalized to the standard Montreal Neurological Institute (MNI) space. The normalized functional images were resampled to 3 × 3 × 3 mm3 and spatially smoothed using a Gaussian kernel of full-width half maximum = 8 mm.
The pre-processed functional images were further detrended, and high-pass filtered (0.008 Hz, 128 s cutoff period) to remove the possible effect of low-frequency drifts. The nuisance signals, which included the six head-motion parameters, averaged signals of the ventricle, white matter, and the whole brain, along with their first derivatives, were also regressed out from the time series of each voxel by using a general linear model (GML), and a first-order autoregressive AR (1) model was applied to account for the autocorrelation in fMRI time series. The whole brain signal regression was performed in this study to better reduce the physiological noise of aging as used in previous studies (Geerligs et al., 2015; Ng et al., 2016). Moreover, previous simultaneous fMRI-electrophysiology study has reported that the global signal would be a confounding factor rather than neural-related activity for the sliding window functional connectivity analysis (Thompson et al., 2013). The residual series were yielded for further dynamic functional connectivity analysis.
To further minimize spurious changes in dynamic functional connectivity estimation due to motion, the volumes with frame-wise displacement (FD) larger than 0.5 mm, as well as one preceding and two succeeding of those volumes were flagged (Leonardi et al., 2013; Power et al., 2014). During the dynamic functional connectivity estimation, a sliding-window approach was used, and the windows with more than 30% of flagged volumes would also be flagged. Subjects with more than 30% flagged windows were considered as extensive head motion and would be excluded from the further analysis. This led to exclusion of 28 subjects. One subject with bad image quality and two subjects without blood pressure information were also excluded, and leaving a total of 188 subjects retained in the analyses.
2.4 Dynamic functional brain network construction
In this study, a commonly used automated anatomical labeling atlas was used (Tzourio-Mazoyer et al., 2002), and the brain was divided into 90 ROIs. The averaged time series over voxels within each ROI were estimated and resulting 90 sets of time-series for each subject. Then, the maximum-overlap discrete wavelet decomposition (MODWT) was used to decompose the fMRI time series to different frequency intervals (Percival & Walden, 2000). The wavelet decomposition has been demonstrated to be an effective way to detect small changes in nonstationary time series and was widely used in investigating dynamic functional connectivity and denoising (Bassett et al., 2011; Bassett, Yang, Wymbs, & Grafton, 2015; Patel et al., 2014). The number of wavelet scale J was selected based on the largest integer which satisfying , where L is the length of time-series and
lw is the length of wavelet filter. In this study, L = 200, and the Daubechies least asymmetric wavelet filter, that is, “la8” (
lw = 8), was used, thus the number of wavelet scales was set to 4. For the time-series of each ROI
X
t, the wavelet coefficients of the four scales
W
X, s, t were estimated using MODWT, where s indicates the wavelet scale, and t represents time point. The wavelet coefficients of the s scale would provide information of the frequency interval
  Hz. With the TR of 2.05 s (
f
s = 1/2.05 Hz), the wavelet coefficients of the four scales would provide information of different frequency intervals (wavelet Scale 1: 0.12–0.24 Hz, Scale 2: 0.06–0.12 Hz, Scale 3: 0.03–0.06 Hz, and Scale 4: 0.015–0.03 Hz).
 (1)
(1) (2)
(2) is the average distance value of i-th row,
  is the average distance value of j-th column, and
  is the grand mean of the distance matrix for signal X. Similar double-centering matrix
B
i, j is obtained for signal Y.
 (3)
(3) (4)
(4) (5)
(5)In this study, the squared distance correlation was used to evaluate the dynamic functional connectivity since it was thought to provide a well definition for dissimilarities (Szekely & Rizzo, 2014). The distance correlation ranges between 0 and 1. It will equal 0 if and only if X and Y are independent, and equal 1 when Y = a + b X C for existing vector a, nonzero real number b and orthogonal matrix C.
For each participant and each window, a whole-brain network correlation matrix was generated in different frequency interval separately. The correlation matrixes were then transformed to a normal distribution using Fisher's z transformation. To make sure capture the low-frequency band components of the signal, at least one period of the low frequency band should be used for the time-varying correlation estimations (Leonardi & Van De Ville, 2015). In this study, two times of the low frequency period were served as window length with one time point shift step was used for each frequency band (i.e., Scale 1: 8 time points [16 s], Scale 2: 16 time points [33 s], Scale 3: 32 time points [66 s], Scale 4: 64 time points [131 s]). To eliminate the selection of window length, we also estimate the dynamic functional connectivity with 2.5 times of low frequency period. The results showed similar results as shown in Supporting Information. To minimize spurious changes in dynamic functional connectivity due to motion, the flagged windows (with more than 30% of flagged volumes in that window) would be excluded in further analysis.
2.5 Singular value decomposition
In this study a data-driven approach based on k-means clustering and two-step SVD is proposed to capture the time-varying dynamics of the whole-brain (as shown in Figure 1). The upper triangular part of each functional connectivity matrix would be unfolded and concatenated across all the windows for each subject in each scale. Thus, for each subject, a M × T
s dynamic functional connectivity matrix X is obtained in each scale s, where  , N = 90 is the number of ROIs, and
T
s is the window number in the scale s. The dynamic functional connectivity matrix was then normalized by using the mean value of each window.
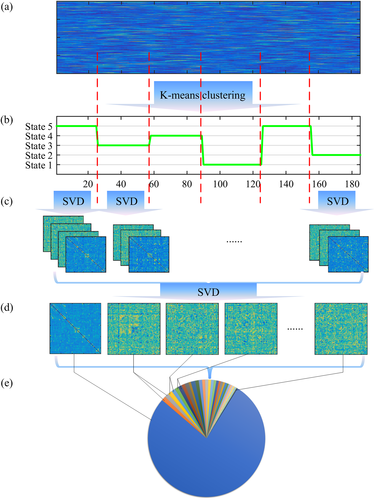
 , the k-means clustering approach was first applied to separate the dynamic functional connectivity into distinct state patterns [X1, X2, ⋯, X
k]. The number of clusters k was determined by using the elbow criterion (Allen et al., 2014). Due to the dynamic connectivity patterns of resting-state were considered to be better described by multiple overlapped patterns (Leonardi et al., 2014), the SVD was then applied in each state separately. For each state-pattern
X
k with
  windows, it could be factorized as
 (6)
(6) ) =
) =  in this study),
  is a set of orthonormal vectors (
M × 1) corresponding to the spatial singular vectors of
X
k,
  is a set of orthonormal vectors (
 ) corresponding to the temporal singular vectors of
X
k,
 is diagonal with positive real entries,
  is the singular values of
X
k. Thus,
  is the spatial component that captures most of the energy of the state pattern k, and
  similarly captures the second largest part of energy of that sate pattern (Mahyari, Zoltowski, Bernat, & Aviyente, 2017).
In order to remove the components determined by noise, a permutation test was used to assess whether the effect of a given spatial singular vector is strong enough to be different from noise. The permutation was accomplished using randomize the sate-pattern of each connectivity matrix. SVD was recalculated for each new sate-pattern, and the number of times the new singular values larger than the raw singular values was estimated and expressed as a probability. The permutation was repeated 500 times, and only the spatial singular vectors corresponding to a probability <0.05 were retained. This permutation approach is similar to the method used to determine the number of retained latent variables in partial least squares (McIntosh, Chau, & Protzner, 2004). In this case, only the first R k spatial components determined by the permutation approach were retained, and each state could be represented by low-rank spatial components separately.
 and
and  . We could transform these sate-specific spatial components to a common spatial space as
 (7)
(7)The spatial singular vectors  represent the common spatial space across the state patterns. Similarly, the first subspace
U1 captures the largest amount of energy across all states, and the second subspace
U2 captures the second largest amount of energy across all states, and so forth.
 (8)
(8) could be represented as a linear combination of
N
R common orthonormal spatial components U
l with time-varying weights
w
tl. The first common spatial component captures the most part of the power (around more than 70% in this study) across the collection of the dynamic functional connectivity matrix and would correspond to the stationary connectivity as estimated in static connectivity(Alter, Brown, & Botstein, 2000; Mahyari et al., 2017). Similar as the eigenconnectivities used in (Leonardi et al., 2013), these common spatial components would correspond to the basic building blocks of dynamic connectivity. Thus, the time-varying functional connectivity matrix could be represented as a linear combination of the stationary component and the dynamic component with time-varying weights. The positive weight of the dynamic component indicates a positive effect of that component relative to the stationary component, while a negative weight shows a negative effect (i.e., relative to the positive weight) of that component relative to the stationary component.
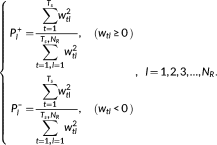 (9)
(9)Since the sign of the time-varying weights for dynamic components represent different effects of that component to the stationary component, they are considered as different dynamic states, and the relative power of positive and negative time-varying weights would be estimated, respectively.
2.6 Relationship between stationary component and static connectivity
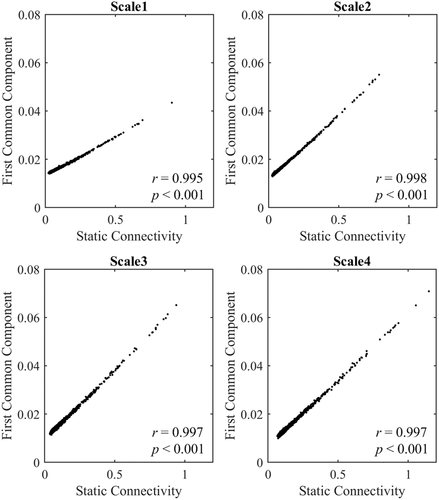
By using two-step SVD, the time-varying functional connectivity matrix is represented as a linear combination of the stationary component and the dynamic components with time-varying weights. In order to evaluate relationship between the stationary component extracted from the dynamic functional connectivity and static connectivity derived from the overall time series, the static distance correlations in each frequency interval were also estimated by using the time series extracted from the un-flagged volumes. Then, the relationship between stationary component and the static connectivity in each frequency interval would be evaluated by using Pearson correlation.
2.7 Whole-brain network diversity
 (10)
(10)The entropy values between 0 and log(N R), the larger of entropy value, the more diversity of brain states would be. The entropy equals 0 indicates only one common spatial component is found across the dynamic functional connectivity ( P1 = 1). The entropy equals log(N R) corresponds to a flexibility connectivity pattern where the power of all the N R spatial components were uniform distributed. In fact, similar measure has been proposed and used to capture the dynamic of gene expression (Alter et al., 2000).
2.8 Regional brain diversity
We also try to explore the diversity of each brain region under the framework of whole brain dynamic functional connectivity. For a given node, the sub-spatial-components (the edges connected with that node in each spatial component) of that node are first extracted from state-specific spatial components derived from the first-step whole brain network SVD. Then, the second-step SVD is applied to the sub-spatial-components to project the state-specific node-level connectivity to a common node-level spatial space. The power distribution of the common sub-spatial-components of each node will be estimated, and the regional brain diversity would be estimated as the entropy of the power distributions.
2.9 Age-related changes of brain diversity in elderly
 (11)
(11)In this model, H s is the diversity value in the frequency interval of s-scale, age is the explanatory variable, gender, education years (edu), total intracranial volume (ICV), and mean arterial blood pressure (MABP) are used as covariates. The threshold of statistically significant was set to p < .05 for the whole brain network diversity, and p < .05/90 for the regional brain diversity (Bonferroni corrected for multiple comparisons).
2.10 Relationships between brain diversity and general mental flexibility
Symbol Digit Modalities Test (SDMT) (Smith, 1982) and animal fluency test were used to assess the mental flexibility of each subject. SDMT is a variant of the digit-symbol coding task. Subjects are presented a series of abstract symbols and are asked to fill in as many the corresponding digits as possible in 90 s. The number of correctly filled digits is calculated. This test requires subjects to switch between rules for each abstract symbol and thus is related to mental flexibility and information processing speed (O'Sullivan, Morris, & Markus, 2005). The animal fluency test requires subjects to produce as many animal names as possible in 60 s, and the number of correctly generated animal names measures speed and activation as well as executive processes (Wong et al., 2013). The scores of each test were standardized to T scores with mean = 50 and SD = 10. The sum of these T scores for each subject were used as general mental flexibility score (Ng et al., 2016). For the brain diversity regressed out the effects of head motion, window number and blood pressure, Spearman correlation was used to evaluate the relationships between the brain diversity and general mental flexibility score.
3 RESULTS
3.1 Extracting stationary connectivity from dynamic functional connectivity
After the two-step SVD analysis, the common spatial components in each scale were obtained for each subject. As determined by the permutation approach, an average of 27.9 ± 3.4 (range: 13–35) components in Scale 1, 12.0 ± 1.5 (range: 8–16) components in Scale 2, 5.8 ± 0.7 (range: 4–7) components in Scale 3, and four components in Scale 4 were retained. The common spatial components of a typical subject were shown in Supporting Information.
The relationships between the first common component, that is, stationary component, derived from SVD analysis and the static functional connectivity across group are shown in Figure 2. The results showed significant correlations between the group-averaged stationary component and static functional connectivity in all frequency intervals. The results indicate the static connectivity patterns could be effectively extracted from the dynamic functional connectivity by using SVD analysis. The SVD analysis showed an excellent performance to factorize the dynamic functional connectivity as a combination of the stationary component and dynamic components.
3.2 Frequency-specific age-related decreased brain diversity
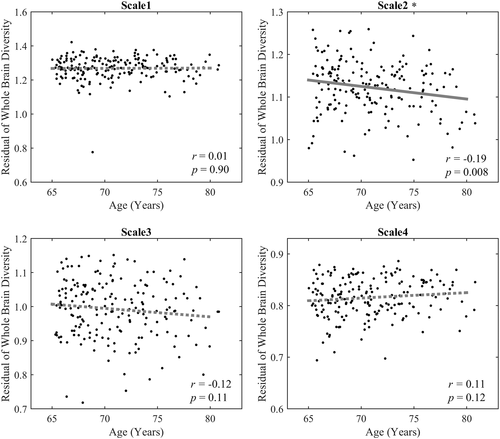
We estimated the age effect of the whole-brain network diversity in each frequency interval separately, and a significantly negative effect (r = −.19, p = .008) was only found in the Scale 2 frequency interval (0.06–0.12 Hz) (Figure 3).
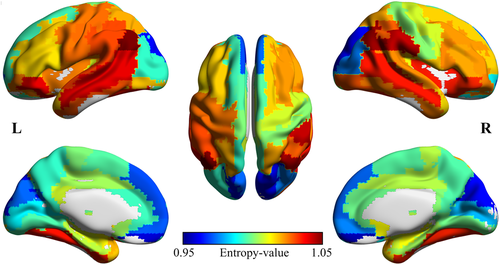
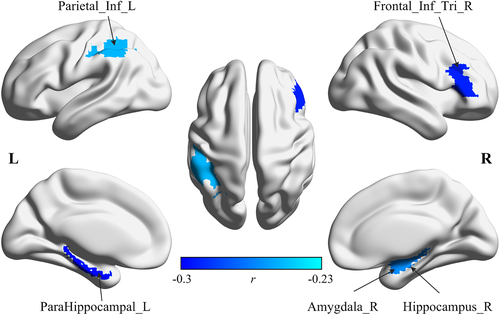
In addition, we also evaluated the age effects of regional brain diversity in each scale. The significant age effects were also only found in the Scale 2 interval. The group averaged regional brain diversity of Scale 2 is illustrated in Figure 4. As shown in Figure 4, the high regional brain diversity values are mainly distributed in the frontal and temporal lobes, while the occipital and parietal regions exhibit a more stable pattern with low diversity values. The results of the age effects on regional brain diversity are shown in Figure 5. Only significantly negative correlations were found between age and regional brain diversity in the right inferior frontal gyrus (r = −.29, p < .0001), left inferior parietal gyrus (r = −.25, p = .0005), right amygdala (r = −.26, p = .0003), right hippocampus (r = −.26, p = .0003), and left parahippocampal cortex (r = −.3, p < .0001). These identified regions with age-related decreased diversity mainly distribute in the DMN and FPCN.
3.3 Whole-brain diversity reflects the general mental flexibility
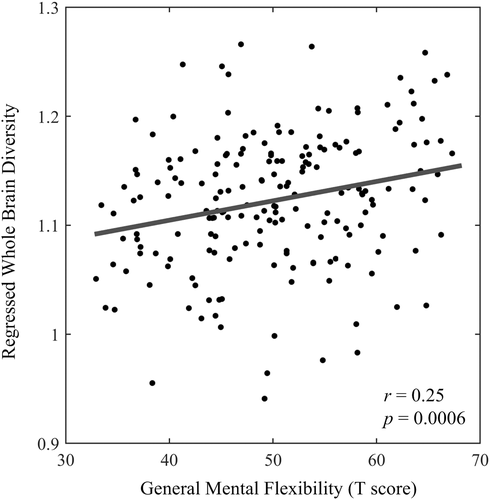
We also explored whether the brain diversity could reflect the general mental flexibility measured by animal fluency and SDMT. The whole-brain diversity shows a significantly positive correlation with general mental flexibility score (r = .25, p = .0006) in Scale 2 (Figure 6). We also conducted a partial correlation between the brain diversity and general mental flexibility with age, gender, education, and ICV as covariates, the positive correlation is still preserved (r = .15, p = .047). No significant correlation between general mental flexibility and regional brain diversity was found in any scale interval.
4 DISCUSSION
In this study, based on k-means clustering and SVD, a data-driven approach was proposed to characterize the dynamic functional connectivity components of the whole brain in a large sample cohort of cognitively healthy elderly aged from 65 to 80 years. The Shannon entropy was used to describe the diversity of whole brain as well as different brain regions. The results showed that with the increase of age, a frequency-specific decreased brain network diversity was found both on the whole-brain network level and regional level. The approach we proposed may shed new light on characterizing the dynamic functional connectivity from the perspective of the whole-brain network.
In this study, the wavelet decomposition was introduced to construct the dynamic functional connectivity matrix, it makes us better to explore the time-varying connectivity in different frequency intervals/time scale simultaneously (Leonardi & Van De Ville, 2015). In fact, recent economics studies have reported that the wavelet-decomposition based approach could better describe the economic dynamics than the dynamic conditional correlation approach (Dajcman, Festic, & Kavkler, 2012), a method which has also been proposed to evaluate the time-varying functional connectivity recently (Lindquist, Xu, Nebel, & Caffo, 2014), since it could provide a time-frequency perspective to describe the dynamics.
In addition, we proposed a new method to evaluate the regional brain diversity under the framework of the whole-brain network. In previous studies, the regional variability of the brain network was mainly characterized by using the edges directly connected with a given region. By using the functional connectivity in each node, Zhang et al. (2016) proposed a temporal variability measurement to capture the regional dynamic connectivity of the brain, and characteristic changes of regional variability were reported in different mental disorders. Yin et al. (2016) captured the regional flexibility of the brain by using the probability distribution of the first k strongest connections for a given brain region, and reported the age-related changes of flexibility across lifespan. These methods showed potential to capture the dynamic of a given brain region, but all the nodes were treated equally and ignore the effect of the whole brain network. In our method, the regional diversity was estimated based on the state-specific components derived from the whole-brain network. It could capture the diversity of a given region under the framework of whole-brain network dynamics.
The brain diversity related with both age and general mental flexibility was only found in the Scale 2 (0.06–0.12 Hz) interval showed a frequency-specific changes of brain diversity. This is consistent with previous studies since this frequency interval was considered to be particularly sensitive to dynamic changes of brain network (Bassett et al., 2011; Bassett et al., 2015). Braun et al. (2015) also reported a negative relationship (r = −.18) between the dynamic frontal flexibility during an n-back task with the cognitive flexibility measured by trial-making test B (the larger score, the worse task switching ability) in a similar frequency band (0.08–0.15 Hz). Our study demonstrated that the brain diversity during resting state could also reflect the cognitive flexibility of the brain in aging. In addition, recent studies have also demonstrated the importance of static functional connectivity on maintaining cognitive performance in older adults. Using resting-state static functional connectivity, Muller, Merillat, and Jancke (2016) pointed out the importance of fronto-parietal long-range connections and DMN on successful verbal fluency performance in older adults. Tsvetanov et al. (2016) reported that the cognitive performance in elderly relied strongly on the effective connectivity between and within large scale networks, and suggested the increased reliance of neural dynamics to maintain cognitive function in aging. The positive correlation between whole-brain network diversity and general mental flexibility found in current study would extend previous findings to dynamic functional connectivity, and imply the whole-brain diversity may provide a putative neurophysiological mechanism of mental flexibility.
The regional brain diversity showed higher diversity in the frontal and temporal lobes, while lower diversity in the occipital and parietal regions. These findings indicated the frontal and temporal lobes illustrated a more dynamic pattern while the parietal and occipital lobes revealed a more stable pattern. The results are in line with previous studies. Zalesky et al. (2014) reported that the most dynamic connections of the brain were mainly localized in the DMN and FPCN, while the occipital and parietal lobes contained less dynamic connections. Wang, Li, Childress, and Detre (2014) evaluated the temporal fluctuations of fMRI time series of the whole brain using sample entropy, and identified that the signals in the visual and parietal cortex showed lower fluctuations while temporal cortex showed higher fluctuations.
The age showed a significantly negative effect on the whole brain diversity, further regional diversity analysis revealed the significantly negative age effect distributed in the right inferior frontal gyrus, right amygdala, right hippocampus, left parahippocampal cortex, and left inferior parietal gyrus. These brain regions were considered as substantial regions related with cognitive flexibility. The amygdala–hippocampus circuit has been reported to be related with response switching (Cohen, Elger, & Weber, 2008). The inferior frontal gyrus was reported to be the key region related with earlier preparatory stages of set-shifting (Perianez et al., 2004). The inferior parietal gyrus was thought to show a remarkable flexibility in task demands (Wisniewski, Reverberi, Momennejad, Kahnt, & Haynes, 2015). Thus the decreased brain diversity in these regions might response to the declines of cognitive flexibility in elderly (Wecker, Kramer, Hallam, & Delis, 2005).
In addition, most of these brain regions identified as age-related decreased diversity are distributed in the FPCN and DMN. The DMN is thought to be activated during task-free state and related with broad and spontaneous external information monitoring (Hahn, Ross, & Stein, 2007; Qin et al., 2015). FPCN serves as a flexible hub and plays a vital role in adaptive control and implementation of different task demands during task state (Cole et al., 2013). The activities of DMN and FPCN were thought to be critical to the control of global brain dynamics (Hellyer et al., 2014). The findings of decreased functional connectivity diversity in the DMN and FPCN in elderly are in line with previous studies. A recent meta-analysis has pointed out that the age-related changes in activation commonly present in FPCN and DMN (Li et al., 2015). Decreased functional connectivity in the DMN and FPCN were also consistently reported in elderly compared to young adults (Geerligs et al., 2015; Tomasi & Volkow, 2012). The findings in this study first revealed that the age-related changes of brain diversity in healthy elderly would also mainly distribute in the DMN and FPCN. Our results of age-related decreased diversity also echo a recent study that demonstrated elderly failed to modulate the activity of default mode and control networks (Turner & Spreng, 2015). We believe that our finding of age-related reduced functional connectivity diversity in DMN and FPCN might reflect the deficit capacity of networks modulation in elderly.
There are several limitations still should be noted. First, although we try to reduce the effects of non-neuronal physiological dynamics carefully, it is still difficult to disentangle the neuronal origin and non-neuronal origin, such as vascular health effects (Geerligs et al., 2017; Tsvetanov et al., 2015), dynamics in the common spatial components. The spectral dynamic causal modeling (spDCM) provides a potential approach to specify the neuronal interactions and hemodynamic signals (Friston, Kahan, Biswal, & Razi, 2014), and has been shown to be a useful approach to investigate the static neuronal connectivity in aging (Tsvetanov et al., 2016). Further brain-wide dynamic effective connectivity estimation based on spDCM (Park, Friston, Pae, Park, & Razi, 2018; Razi et al., 2017) or simultaneous EEG-fMRI will be crucial in disentangling the relationship between neuronal and non-neuronal origin dynamics in aging. Second, the mental flexibility of the elderly in this study was evaluated by using two simple neuropsychological measures, a more comprehensive and systemic neuropsychological assessment would be better to reveal the relationships between brain diversity and cognitive flexibility. Finally, only the cognitive healthy elderly was involved in this study, evaluating the changes of brain diversity across lifespan in future study would improve our understanding the changes of brain diversity in aging.
5 CONCLUSIONS
In conclusion, a novel whole-brain data-driven approach was proposed to quantify the diversity of the brain on both whole-brain and regional levels. The frequency-specific age-related decreased diversity was found on both the whole-brain and regional levels. The decreased diversity around the DMN and the FPCN might reflect the age-related neurobiological changes in the brain. This study provided the first evidence of frequency-specific age-related decreased brain diversity in cognitively healthy elderly. The approach we proposed may provide a new perspective to investigate functional brain network of healthy as well as patients with mental illnesses and shed new light on dynamic functional connectivity investigation.
ACKNOWLEDGMENTS
This project was partially supported by grants from the Research Grants Council of the Hong Kong Special Administrative Region, China (Project Nos. CUHK 14113214, CUHK471911, and CUHK14204117) and grants from the Innovation and Technology Commission (Project Nos. GHP-025-17SZ and GHP-028-14SZ).


