Exploring 3-hinge gyral folding patterns among HCP Q3 868 human subjects
Funding information: National Natural Science Foundation of China, Grant/Award Numbers: 31671005, 31500798; National Institutes of Health, Grant/Award Numbers: DA033393, AG042599; National Science Foundation, Grant/Award Numbers: IIS-1149260, CBET-1302089, BCS-1439051, DBI-1564736
Abstract
Comparison and integration of neuroimaging data from different brains and populations are fundamental in neuroscience. Over the past decades, the neuroimaging field has largely depended on image registration to compare and integrate neuroimaging data from individuals in a common reference space, with a basic assumption that the brains are similar. However, the intrinsic neuroanatomical complexity and huge interindividual cortical folding variation remain underexplored. Here we focus on a specific cortical convolution pattern, termed 3-hinge gyral folding, which is the conjunction of gyri from multiple orientations and has unique and consistent anatomically, structurally, and functionally connective patterns across subjects. By developing a novel shape descriptor and a two-stage clustering pipeline, we devise an automatic method to identify 3-hinges in the Human Connectome Project Q3 868 human brains, and further parameterize the complexity of such a pattern and quantify its regularity and variation in terms of 3-hinge number, position, and morphology. Our results not only exhibit the huge interindividual variations, but also reveal regular relationship between gyral hinges and other factors, such as their locations and cortical morphologies. It is found that “line-shape” cortices have relatively more consistent 3-hinge shape pattern distributions, and certain types of 3-hinge patterns favor particular cortical morphologies. In addition, more 3-hinges are found on “line-shape” cortices while their numbers vary more across subjects than those on “non-line-shape” cortices. This study adds new insights into a better understanding of the regularity and variability of human brain anatomy, and their functional aspects.
1 INTRODUCTION
Brain anatomy studies have been attracting interests from the basic and clinical neuroscience fields for centuries (Fischl et al., 2008) and have been significantly advanced by modern neuroimaging techniques, such as magnetic resonance imaging (MRI). Among many neuroanatomical features, cortical convolutions gain special attention because they exhibit a direct appearance of a brain, and provide a basic foundation for a variety of studies, such as brain development and degeneration (Dubois et al., 2008; Giedd, & Rapoport, 2010; Giedd et al., 1999; Li et al., 2014; Pereira et al., 2012; Rosas et al., 2002), relationship between cortical folding and underlying cytoarchitecture (Fischl et al., 2008; Heimann, & Meinzer, 2009), structural wiring diagram (Nie et al., 2012; Van Essen, 1997; Xu et al., 2010), functional activity (Lohmann et al., 2008; Schoenemann, 2006), and abnormal brain development (Friede, 1989; Nordahl et al., 2007; Schaer et al., 2008).
In the past two decades, identifying cortical folding pattern regularity and correspondence among different brains (Fischl et al., 2008; Rademacher et al., 1993; Talairach and Tournoux, 1988) has been advanced significantly with the help from a number of successful image registration or alignment approaches, such as FSL FLIRT (Jenkinson et al., 2002; Jenkinson, & Smith, 2001), ANTS (Avants et al., 2009), HAMMER (Shen & Davatzikos, 2002), FreeSurfer (Fischl et al., 1999), and Spherical Demons (Yeo et al., 2010). However, huge inter-individual variation co-exists with the global regularity due to the complexity of cortical convolution, making it challenging to identify a fine-grained correspondence across different subjects via these conventional image registration or parcellation methodologies, especially on human brains (Liu, 2011; Zhang et al., 2016a; Zhu et al., 2013).
Significant efforts have been made recently to explore the reasons for the abovementioned cortical fold pattern regularity and variation (Liu et al. 2010a; Nie et al., 2012). Notably, a widely recognized concept (Budday et al., 2015a; Budday et al., 2015b; Sun & Hevner, 2014) is that convolution may arise at different stages: primary and secondary/tertiary convolutions, the development of which sequentially lasts several months. Generally, the primary convolutions are those shallow grooves and valleys that emerge in the early stage of brain development and become progressively more deeply folded. On this substrate, side branches develop and are defined as secondary sulci and gyri, and those branches on the secondary ones are referred as tertiary sulci and gyri (Budday et al., 2017; Garel et al., 2001; Gilles et al., 2013; Naidich et al., 1994; Van der Knaap et al., 1996). Compared with the later secondary and tertiary folding patterns, primary folding is particularly better preserved among individuals (Armstrong et al., 1995; Chi et al., 1977; Toro, & Burnod, 2005; Lohmann et al., 2008, Garel et al., 2001; Gilles et al., 2013). Many hypotheses have been proposed to explore the mechanisms of primary folding, such as cranial constraint (Chen et al., 2010; Clark, 1945; Nie et al., 2010), axon maturation (Holland et al., 2015; Van Essen, 1997; Zhang et al., 2016b, 2017), and differential growth at the cellular level (Bayly et al., 2013; Razavi et al., 2015; Richman et al., 1975; Ronan et al., 2014; Tallinen et al., 2014; Tallinen et al., 2016). However, the mechanisms of secondary and tertiary folding remain largely unknown, which stimulates researchers from different disciplines to decipher the mechanisms of such complex morphogenesis. As far as we know, current explanations for interindividual variation and complexity are implicitly attributed to a few factors. For example, it is believed that differential cortical growth is a possible mechanism for secondary and tertiary folding (Richman et al., 1975; Tallinen et al., 2016). Studies show that small variations in geometry, loading and boundary conditions can all contribute to secondary instabilities (Budday et al., 2015b), which is another possible angle to explain the increasingly complex and different cortical morphology with aging (Naidich et al., 2012). Nevertheless, in these studies, explicit factors accounting for these anatomical variations and the explanation from structural connectivity, functional, and developmental aspects still remain unclear (Hilgetag, & Barbas, 2006; Honey et al., 2010; Liu 2011; Nie et al., 2012; Van Essen 1997; Walhovd et al., 2012; Xu et al., 2010). In another school of studies (Mota, & Herculano-Houzel, 2015 for example), a universal mechanism was proposed where the global degree of folding only depends on the average cortical thickness and total surface area. In this model, there is no distinction between primary, secondary, or tertiary folding, which could possibly be governed by the same proposed mechanism, irrespective of their timing of emergence. However, this model only provided a global mechanism by taking the surface as a system. It still did not provide clues from a local perspective to why primary folding is relatively more consistent and reproducible across individuals with regard to their locations and morphologies than secondary/tertiary ones. Therefore, in addition to the global mechanism, some other factors, such as axonogenesis, could exist to regulate the patterns and locations of local folding and account for the local inter-individual regularity and variability.
In this work, we are interested in quantifying such regularity and variability, and aiming at providing useful clues to the underlying mechanism for such regularity and variability. To systematically study cortical folding, developing a quantitative representation of cortical fold complexity, regularity, and variability is of great importance. To this end, we focus on a particular convolution pattern, called 3-hinge gyral folding pattern (“3-hinge” for short in the following sections), which was introduced in our previous studies (Li et al., 2010b). Specifically, a 3-hinge is a conjunction of gyri coming from multiple directions. Exemplar 3-hinge gyri are represented by colored bubbles and curves on subject 1 in Figure 1. Because the primary gyri, such as precentral gyrus and postcentral gyrus, are relatively more consistent across different subjects, we use the exemplar 3-hinges on these gyri to illustrate their regularity and variability among individual brains.
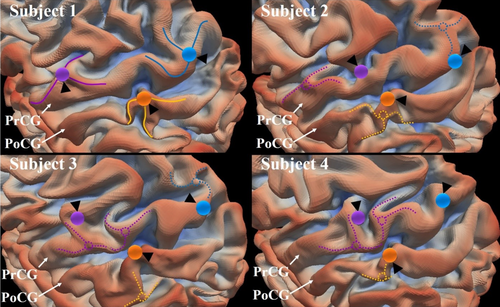
Variation of 3-hinges on precentral gyrus (PrCG) and postcentral gyrus (PoCG) on four randomly selected subjects. The cortical surfaces on the four subjects have been aligned to the gray-ordinate standard system by HCP preprocessing pipeline (corresponding vertices are of the same ID). We manually identified three 3-hinges on subject #1. The centers are represented by color bubbles. The spokes are represented by solid curves. Locations of the corresponding vertices on other three subjects (#2–#4) are highlighted by the corresponding color bubbles and black arrows. We also manually identified some 3-hinges on other subjects (#2–#4), which potentially have anatomical correspondences with those on subject #1. The centers and spokes of them are represented by dashed circles and curves, and color-coded by the potential correspondences [Color figure can be viewed at wileyonlinelibrary.com]
In fact, 3-hinges are of unique structural and functional importance in terms of structural and functional features, brain development, and brain evolution, and has the potential to determine intersubject correspondence (Chen et al., 2014; Ge et al., 2017; Jiang et al., 2015, 2016a, 2016b; Li, et al., 2010; 2015, 2017; Liu et al., 2017; Nie et al., 2012; Yu et al., 2013; Zhang et al., 2014). In our previous works (Supporting Information, Figure S7 and Table S3), it has been demonstrated that 3-hinges have thicker cortices (Li et al., 2015), higher fiber density and diversities (Chen et al., 2014; Ge et al., 2017; Li et al., 2010; 2017; Yu et al., 2013), and are more strongly functionally connected (Jiang et al., 2015, 2016a, 2016b; Liu et al., 2017) compared to other gyral regions. From the perspective of brain development, we found in our previous works that the 3-hinges with complicated morphology tend to have more diverse connected fibers' end orientations. In other words, the orientation of fiber terminations closely follows the curvedness of 3-hinge gyral crest (Chen et al., 2014; Yu et al., 2013). These conclusions are in line with our previous works and add new knowledge to our previous dMRI-based findings that axonal fiber terminations concentrate on gyri (Nie et al., 2012; Zhang et al., 2014). All these findings suggest a close relationship between gyrification and axonogensis. In addition, we found that fiber's connective patterns from the corresponding 3-hinges are consistent across individuals and species (Chen et al., 2014; Li et al., 2017 ). Examples in Supporting Information, Figure S6 also demonstrate that dMRI derived axonal streamlines from the corresponding 3-hinges are of the similar wiring patterns across subjects. These results suggest that 3-hinge convolutions could be an emergent phenomenon necessitated by some underlying function or structure, and show the promise of using 3-hinges for data integration and finding correspondence between subjects and even species.
Although the abovementioned importance and uniqueness endow 3-hinges with scientific values, identification and analyses of them are difficult jobs due to the huge interindividual morphological variations. The analyses and visualization in most of our previous works (Chen et al., 2014; Li et al., 2010b, 2016; Yu et al., 2013) entailed much manual work and are thus not scalable to large-scale cortical folding data modeling and interpretation. In Figure 1, the color bubbles on subjects #1 highlight the locations of three manually identified 3-hinges, and the color bubbles on subjects #2–#4 highlight the locations of the corresponding vertices to those on subject #1. The correspondences are provided by the grayordinate system via the HCP pipeline where cortical surface registration plays a critical role (Van Essen et al., 2013). It is observed that many of those corresponding bubbles on subjects #2–#4 are not located on gyral hinges, while their potential counterparts' locations are highlighted by dashed circles and curves, clearly demonstrating the variation across subjects. Therefore, an automated computational framework that is capable of exploring and discovering the regularity and variability of 3-hinge gyral patterns in numerous individual brains, such as the recent Q3 release of Human Connectome Project (HCP) data, is much needed.
In response, we recently developed an automatic data processing and analysis pipeline that is capable of handling big datasets to extract 3-hinges gyri based on a “gyral net” system (Chen et al., 2017). With the availability of hundreds of thousands of automatically extracted 3-hinges in many different brains, the objective of this work is to devise novel morphological features to depict and parameterize those 3-hinges' morphologies, and design a pipeline to group them to clusters. After this clustering procedure, statistical analysis and representation of these 3-hinge clusters and their specific samples can thus be performed to reveal the regularity and variation of 3-hinges, in terms of their locations, numbers, and morphologies at different parcellation scales and across different brains. In general, our quantitative results reveal the huge interindividual variations and meanwhile elucidate the relationship between gyral hinges and other factors, such as their locations and cortical morphologies. Our study offers new insights into a better understanding of the regularity and variability of human cortical folding patterns, as well as their association with brain function in the future.
2 MATERIALS AND METHODS
2.1 Experimental materials and preprocessing pipelines
We used the Q3 release of Human Connectome Project (http://www.humanconnectome.org/) data in this study. It includes MR scans of 868 healthy subjects with the version 3 preprocessing pipelines performed. All HCP subjects were scanned on a customized Siemens 3T “Connectome Skyra.” Important structural session imaging parameters are listed in Table 1. Details on structural protocols are referred to WU-Minn HCP 900 Subjects Data Release: Reference Manual.1
| Type | Description | TR (ms) | TE (ms) | Flip angle | FOV (mm) | Voxel size | Acquisition time (min:s) |
|---|---|---|---|---|---|---|---|
| T1w | 3D MPRAGE | 2,400 | 2.14 | 8° | 224 × 224 | 0.7 mm isotropic | 7:40 |
| T2w | 3D T2-SPACE | 3,200 | 565 | Variable | 224 × 224 | 0.7 mm isotropic | 8:24 |
As our goal is to quantify cortical convolution patterns, our analysis was conducted on the white matter surface meshes. The surface reconstruction had been performed via HCP Version 3 preprocessing pipelines and available in this dataset. It is worth noting that MSMAll registration, a multi-modal registration framework, had been used on the Q3 release to warp all surfaces to the same space by simultaneously incorporating information from brain structure (myelin) and function (resting-state network and visuotopic maps). It has been demonstrated in Robinson et al. (2014) that registration using these multi-modal maps can improve cross-subject alignment. Related details can be found in WU-Minn HCP 900 Subjects Data Release: Reference Manual.1
2.2 Extracting 3-hinges
The locations and the morphological skeletons of 3-hinges were extracted based on our recently developed automatic pipeline (Chen et al., 2017), which is illustrated in Figure 2. To make the manuscript self-contained, we present a summarized version of this pipeline. More details can be found in the Supporting Information. Generally, the pipeline includes two major steps: (a) gyral crest segmentation (Figure 2f,g) and (b) gyral crest skeleton extraction (Figure 2h).
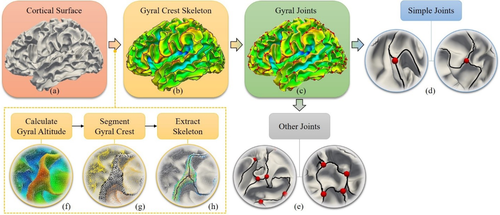
Pipelines of the extraction of gyral skeleton and 3-hinge. (a) Cortical surface of the white matter/gray matter boundaries. (b) Black curves are the extracted skeleton of gyral crest. The cortical surface is color-coded by gyral altitude. Red regions have high gyral altitude values while blue regions have low values. (c) Red bubbles highlight the locations of 3-hinges where more than two gyri meet. (d) Enlarged views of two example simple 3-hinges. (e) Enlarged views of some 3-hinges that are close to each other. (f–h) Steps of extracting gyral crest skeleton. Gyral altitude is computed first in (f), based on which cortical surface is segmented into gyral crest (black dots in (g)) and sulci. Finally, the gyral crest is skeletonized [Color figure can be viewed at wileyonlinelibrary.com]
- Gyral crest segmentation: This step is to segment gyral crest from cortical surfaces (Figure 2f,g). For each surface vertex, we computed its gyral altitude defined as the movement in the surface normal direction from its original location to the “mid-surface,” a smoothed and inflated mid-line that separates gyri from sulci (Fischl et al., 1999). Vertices above the “mid-surface” have positive altitude values and otherwise they are assigned negative values (Figure 2f). Based on gyral altitude, the watershed algorithm (Bertrand, 2005) is adopted to progressively segment the gyral crest (regions over an altitude level) from sulcal basins (regions below the altitude level). More details and results of watershed algorithm can be found in Supporting Information, Figures S2 and S3.
- Gyral skeleton extraction: This step is to extract gyral crest lines. Based on these lines, the junctions where multiple lines meet were identified as the centers of 3-hinges (Figure 2b–e). Generally, gyral skeletons are the crest curves located in the central parts of gyri, which are the furthest locations on gyral regions from the borders between gyral crests and sulcal basins. The method detailed in Chen et al. (2017) are an enhanced version of the one in Li et al. (2010a). First, distance transform was conducted on the segmented gyral area to highlight the center of gyral crest. Then, the first tree marching started from the local centers of gyral crest and successively connected the vertices to form multiple tree-shape graphs. After connecting the trees, the redundant branches were pruned and only the major branches were left and taken as the skeleton of gyral crest (black curves in Figure 2b).
This skeleton forms a gyral network. We defined vertices on this network with degrees more than 2 as gyral joints. Gyral joints with degrees equal to 3 (see examples in Figure 2d) were defined as 3-hinges and are of major interest in this work. As the shape of 3-hinge was quantified based on the 3 spokes radiant from its center in our analysis, the 3-hinges that are crowded within a small region were excluded (see examples in Figure 2e) because their branches are not long enough to extract sufficient shape information of 3 spokes. In practice, the average Euclidean distance between two neighboring 3-hinges is 15.43 ± 0.62 mm for the left hemisphere and 15.29 ± 0.66 mm for the right one. We thus used r = 15 mm as a threshold to extract the arms of a 3-hinge. If no other 3-hinge centers were found within this spherical range of current 3-hinge center, the 3-hinge was defined as a “simple joint” and was included in this study. Finally, the gyral crest lines emanating from a “simple joint” center within a spherical range with r = 15 mm were extracted as the branches (see the red dots and the three black crest lines in Figure 2c). Without loss of generality, we will use 3-hinge in the following sections of this article to refer to “simple joints.”
2.3 Clustering 3-hinges according to their morphologies
2.3.1 Preprocessing steps: Smooth, resample, and align 3-hinges
Before we fed the extracted 3-hinges into our proposed clustering approach, a few extra preprocessing steps are required (Figure 3a). We extracted the hinge center vertex and vertices on the 3 branches from a 3-hinge. The branch curves were smoothed by replacing the coordinates of the current vertex with the ones averaged over the vertices within its first-order neighborhood. On each smoothed branch, 30 vertices were uniformly resampled. Finally, the 3-hinge branches were rotated to a standard coordinate system (Figure 3b). The center vertex of 3-hinge was defined as the origin of the coordinate system. The surface normal on the hinge center was defined as the z-axis. Then, we computed the primary direction associated to the largest component obtained by applying principal component analysis (PCA) to the coordinates of all vertices such that the projections of them on this major direction mostly preserves the 3-hinge' spatial pattern. Because the major direction of PCA is not necessarily perpendicular to the z-axis, it was projected to the plane perpendicular to the z-axis and the projected direction was defined as the x-axis. By far, all 3-hinges are comparable in the standard coordinate system.
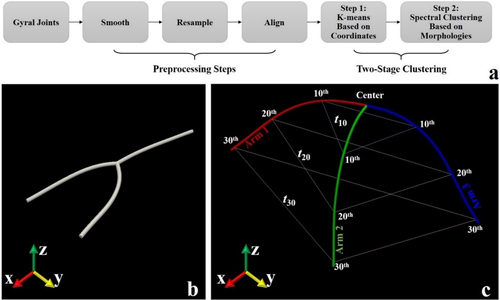
(a) Flowchart of the 3-hinge clustering pipeline, consisting of two major sections: preprocessing steps and a two-stage clustering approach. Details are referred to the main texts. (b) A 3-hinge joint is rotated to the standard space. (c) Rigid transform invariant shape descriptors of a 3-hinge joint [Color figure can be viewed at wileyonlinelibrary.com]
2.3.2 A two-stage clustering approach
A two-stage clustering approach (Figure 3a) was used to cluster 3 hinges with similar patterns into the same group and identify cluster pattern representatives. The first key difference between the two stages is the feature used to represent 3-hinges. In the first stage, 3-hinges were classified simply according to the spatial distribution of their coordinates. In the second stage, clustering was performed on cluster centers obtained in the first stage, and a new feature was devised to describe the shapes of the cluster centers. The second key difference is the methods used in the two stages. The K-means clustering was used in the first stage. The resulting cluster centers were fed to the second stage in which spectral clustering method was adopted (Von Luxburg, 2007). Because of the large number of original 3-hinges, directly feeding them to spectral clustering method could lead to an extensive computation load, and thus the K-mean clustering method was adopted first to classify them into groups at a coarse-grained level. Spectral clustering was used in the second stage because (a) it can automatically decide the number of clusters by selecting graph cut threshold and (b) as the clustering is generated with bi-partitioning procedure, hierarchical information between clusters will be obtained as well. And thus, the IDs of the clusters with similar patterns will be close to each other, which benefit the following visual inspection and analysis.
K-means clustering based on distance measurements
A feature was defined based on the coordinates of 3 branches of a 3-hinge. Three vertices (the 10th, 20th, and 30th vertices) for each branch were selected. Next, the 3D coordinates of all the 9 vertices were expanded to a 1 × 27 vector, defined as the feature vector.
 denotes the set consisting of feature vectors of all 3-hinges. Because all 3-hinges had been transposed to the standard space, Euclidean distances between the feature vectors were directly used and fed to the K-means clustering method.
 (1)
(1) of all within-class distance represents the performance of clustering. Next, we produced a pseudo-feature set
 of the same size of
 . For each dimension of
 , the values were uniformly and randomly sampled ranging from the minimum to the maximum of feature values of the same dimension of
 . Likewise,
 was fed to the K-means methods using the same Euclidean distance measurement and the same predefined cluster number K, and then the corresponding
 was computed. As the values in
 is uniformly distributed in the feature space, the clustering performance represented by
 was taken as the baseline, to which
 was compared. If
 is smaller than
 , its performance will be considered better than that obtained on a uniform feature space. The larger the discrepancy, the more outstanding the performance will be. Therefore, the clustering performance evaluation was defined as follows:
 (2)
(2)A large positive value indicates desired performance.
Group clusters with similar shape patterns
As our decision in the first stage was made based on the spatial distance between 3-hinges, the 3-hinges that have the same morphological pattern but different spatial distributions (e.g., mirror flip by x–z plane) could be assigned to different clusters. Thus, in the second stage, a novel rigid transform invariant shape feature, denoted by
 , was adopted to describe 3-hinge morphology. It consists of six triplets
 , where the triplet
 consists of the three edge length values of the kth vertices on the three branches while
 consists of the projections of them on the x–y plane (Figure 3c). Note that the three edge length values in
 and
and
 were arranged in an ascending order. As the triplet edge length is rotation, shifting, and flip invariant, this feature vector is invariant to rigid transform. It is obvious that by this definition, two 3-hinges with the same morphological pattern will have the same feature vector.
 is usually larger than
 . Thus, when comparing the feature vector between 3-hinges i and j, the similarity was first computed for each set of triplets separately and then joined later:
 (3)
(3) (4)
(4) and
and
 is the scaling term. Different scale coefficients were defined for different sets of triplets. Specifically, we empirically defined
 as
as
 .
.We computed the similarity between the cluster centers (averaged 3-hinge) of initial clusters. If the similarity between a 3-hinge and all other 3-hinges is smaller than 0.3, it is directly taken as the final clusters. Otherwise, spectral clustering (Von Luxburg & 2007) was performed based on the similarity matrix to generate the final clusters. In practice, the spectral clustering algorithm that we applied will recursively bipartition the graph and stop only when the normalized cut value is larger than a threshold selected (0.9). Those final clusters were taken as the 3-hinge joint shape representatives.
2.3.3 Statistical analyses
To better present the clustering results, we used the Ward's method (Ward, 1963) to compute and visualize the hierarchical structure of the final cluster centers in terms of the shape pattern similarity. To single out the most representative clusters, we cut the hierarchical tree to branches using Silhouette coefficients, such that consistency within branches and dissimilarity across branches are maximized.
The numbers and shape patterns of 3-hinges are correlated to the morphologies of cortical parcels where they are located. In this work, Desikan–Killiany parcellation scheme (Desikan et al., 2006) is used. Thirty two cortical sites in Desikan–Killiany parcellation scheme are of our interest and their indices are in Table 2. Two types of cortical parcel morphologies are of our special interest: “line-shape” cortices and “non-line-shape” ones. Four “line-shape” brain sites and four “non-line-shape” ones are selected from the Desikan–Killiany parcellation scheme, which are relatively less varied across subjects. The four “line-shape” cortical brain sites are precentral, postcentral, superior-temporal, and middle-temporal gyri. The four “non-line-shape” sites are superior-parietal gyrus, inferior-parietal gyrus, supra-marginal cortex, and lateral-occipital cortex (the morphology of these cortices is shown in Figure 5c). Considering that larger brain sites such as lateral occipital cortex could have a higher chance to generate 3-hinges than small sites such as temporal pole cortex, we performed the correction when computing 3-hinge number for each brain site by dividing the original values by the areas of brain sites to remove the effects of brain site size.
| 1 | Caudalanteriorcingulate | 9 | Lateral-Occipital | 17 | Parsorbitalis | 25 | Rostral-middlefrontal |
| 2 | Caudalmiddlefrontal | 10 | Lateral-orbitofrontal | 18 | Parstriangularis | 26 | Superior-frontal |
| 3 | Cuneus | 11 | Lingual | 19 | Pericalcarine | 27 | Superior-parietal |
| 4 | Entorhinal | 12 | Medial-orbitofrontal | 20 | Postcentral | 28 | Superior-temporal |
| 5 | Fusiform | 13 | Middle-temporal | 21 | Posterior-cingulate | 29 | Supramarginal |
| 6 | Inferior-parietal | 14 | Parahippocampal | 22 | Pre-central | 30 | Frontal pole |
| 7 | Inferior-temporal | 15 | Paracentral | 23 | Pre-cuneus | 31 | Temporal pole |
| 8 | Isthmuscingulate | 16 | Parsopercularis | 24 | Rostralanterior-cingulate | 32 | Transverse temporal |
3 RESULTS
3.1 Presentation of 3-hinge shape pattern clustering results
Based on our proposed methods, 68,594 3-hinges are automatically extracted from 868 subjects. Two hundred clusters are obtained in the first clustering stage and then finalized into 41 clusters in the second stage. The number of clusters is automatically determined based on the criteria we introduced in Section 2. The 41 clusters are shown in Figure 4. The 200 cluster centers in the first stage and their relation with the 41 final cluster centers are shown in Supporting Information, Table S1. Hierarchical structure of the 41 cluster centers is present in Figure 5a. The dashed line in Figure 5a represents the decision with the highest Silhouette coefficient that divides the tree into six representative branches (see the color bars). We name the six branches as “Clover,” “Tetrahedron,” “Hook,” “Y,” “Fork,” and “Trident” according to their morphology and pick the most dominant clusters in terms of the percentages (see black frames in Figure 4) within each branch and present them in Figure 5b. 3D dynamic views can be found in Supporting Information (Movies).
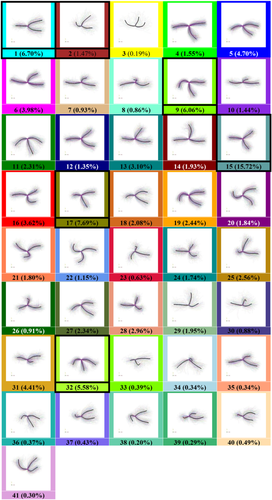
The final 41 clusters in terms of 3-hinge morphologies. For each cluster, we show all samples within it (represented by curves) and highlight the sample determined by the algorithm as the cluster center by black color. We assign each cluster a unique color label, which is used throughout the rest part of the manuscript. Along with the cluster IDs, the percentage of the total that they each make up is listed [Color figure can be viewed at wileyonlinelibrary.com]
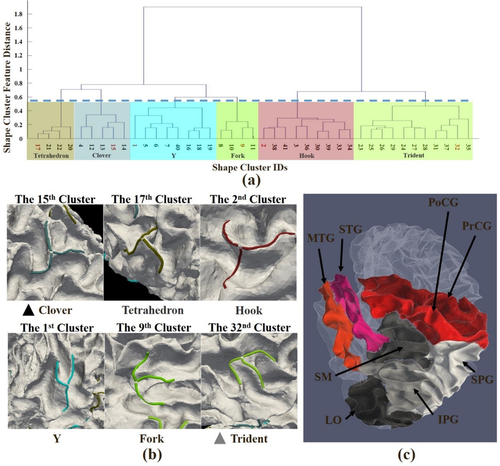
(a) Hierarchical structure of the 41 final shape clusters in terms of ward distance of shape features. The dashed line represents the decision made based on the highest Silhouette coefficient that cuts the tree into six representative branches (different color bars). (b) 3D examples of the six clusters highlighted by red IDs in (a). The three branches of the “Clover”' type are basically in the same plane and the angles between the neighboring branches are the same. The “Tetrahedron” type is similar to the “Clover” type, but its three branches are not within the same plane. Two branches of the “Hook” type are within a plane while the third one resembles a hook. The “Y” type resembles the letter “Y.” The “Fork” and “Trident” types are similar to each other. Their branches are basically in the same plane. The arms of “Fork” spread over more than those of “Trident.” Black and gray arrow heads are used to highlight “Clover” and “Trident” types and they are also used in Figure 6. (c) Illustration of “line-shape” cortices and “non-line-shape” cortices. Line-shape cortices include precentral gyrus (PrCG), postcentral gyrus (PoCG), superior-temporal gyrus (STG), and middle-temporal gyrus (MTG). Non-line-shape cortices include superior-parietal gyrus (SPG), inferior-parietal gyrus (IPG), supra-marginal cortex (SM), and lateral-occipital cortex (LO) [Color figure can be viewed at wileyonlinelibrary.com]
3.2 Spatial distributions of 3-hinges shape patterns
In this section, we report how 3-hinge shape patterns distribute on different cortical sites and infer the relationship between them.
Figure 6 elaborates the spatial distributions of the 41 3-hinge shape patterns on the cortical sites of the Desikan–Killiany parcellation scheme. Each matrix in a subfigure corresponds to the distribution of all 41 shape patterns over all subjects on one brain site. Each row of such a matrix corresponds to the distribution of all shape patterns on one subject. The dissimilarities among rows/subjects are easily observed. We use Pearson correlation coefficients between a pair of rows to measure their dissimilarity. Table 3 lists the correlation coefficients on each brain site averaged over all row pairs. In general, the Pearson correlation coefficients averaged over subjects and brain sites are as low as 0.09 ± 0.26 for both hemispheres. To visualize such variations, we show 8 randomly selected subjects as examples in Figure 7 to illustrate the spatial distributions of 3-hinge patterns on four “line-shape” gyri. All 3-hinges are color-coded according to the color scheme in Figure 4. Huge variations of 3-hinge shape patterns across subjects are easily observed even on these gyri that are relatively consistent across individuals.
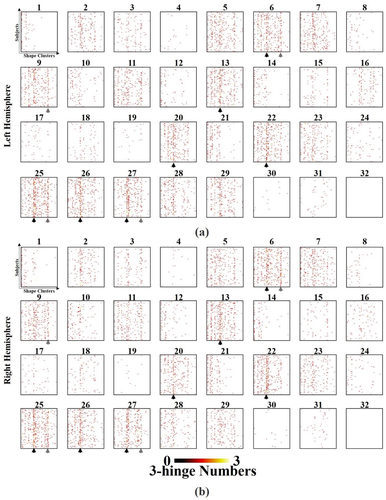
Frequency distributions of the 41 three-hinge shape clusters on each brain site across individuals on the left (a) and right (b) hemispheres, respectively. Each subfigure is the result of 3-hinge shape patterns (horizontal axes) vs. individuals (vertical axes) on one brain site. The 32 brain sites are from the Desikan–Killiany parcellation scheme and their indices can be found in Section 2.3.3. The columns corresponding to the 15th cluster (the “Clover” pattern) and the 32nd cluster (the “Trident” pattern) are highlighted by black and gray arrows, respectively [Color figure can be viewed at wileyonlinelibrary.com]
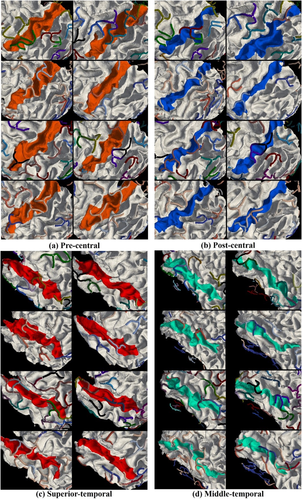
Spatial distributions of the classified 3-hinge patterns. 3-hinges joints are represented by tubes. The 3-hinges classified to the same cluster are indicated by the same color, and the color scheme is the same as that in Figure 4. Four gyri on 8 randomly selected subjects are used for this illustration [Color figure can be viewed at wileyonlinelibrary.com]
| Left hemisphere | |||||||
|---|---|---|---|---|---|---|---|
| 1 | 2 | 3 | 4 | 5 | 6 | 7 | 8 |
| 0.26 ± 0.45 | 0.07 ± 0.26 | 0.05 ± 0.24 | 0.04 ± 0.24 | 0.06 ± 0.22 | 0.07 ± 0.23 | 0.07 ± 0.23 | 0.08 ± 0.31 |
| 9 | 10 | 11 | 12 | 13 | 14 | 15 | 16 |
| 0.09 ± 0.24 | 0.05 ± 0.25 | 0.05 ± 0.23 | 0.10 ± 0.32 | 0.09 ± 0.25 | 0.16 ± 0.36 | 0.07 ± 0.28 | 0.04 ± 0.24 |
| 17 | 18 | 19 | 20 | 21 | 22 | 23 | 24 |
| 0.05 ± 0.25 | 0.05 ± 0.26 | 0.03 ± 0.22 | 0.11 ± 0.26 | 0.16 ± 0.36 | 0.12 ± 0.26 | 0.04 ± 0.22 | 0.05 ± 0.25 |
| 25 | 26 | 27 | 28 | 29 | 30 | 31 | 32 |
| 0.10 ± 0.23 | 0.14 ± 0.29 | 0.09 ± 0.25 | 0.06 ± 0.23 | 0.07 ± 0.24 | 0.04 ± 0.25 | 0.07 ± 0.29 | NaN |
| Right hemisphere | |||||||
|---|---|---|---|---|---|---|---|
| 1 | 2 | 3 | 4 | 5 | 6 | 7 | 8 |
| 0.24 ± 0.43 | 0.06 ± 0.26 | 0.05 ± 0.25 | 0.09 ± 0.32 | 0.06 ± 0.22 | 0.08 ± 0.22 | 0.07 ± 0.23 | 0.09 ± 0.31 |
| 9 | 10 | 11 | 12 | 13 | 14 | 15 | 16 |
| 0.07 ± 0.23 | 0.05 ± 0.25 | 0.05 ± 0.22 | 0.12 ± 0.33 | 0.11 ± 0.25 | 0.19 ± 0.40 | 0.06 ± 0.27 | 0.04 ± 0.23 |
| 17 | 18 | 19 | 20 | 21 | 22 | 23 | 24 |
| 0.06 ± 0.27 | 0.07 ± 0.27 | 0.02 ± 0.21 | 0.08 ± 0.25 | 0.13 ± 0.34 | 0.12 ± 0.26 | 0.04 ± 0.22 | 0.05 ± 0.26 |
| 25 | 26 | 27 | 28 | 29 | 30 | 31 | 32 |
| 0.11 ± 0.23 | 0.12 ± 0.26 | 0.10 ± 0.25 | 0.06 ± 0.26 | 0.05 ± 0.23 | 0.03 ± 0.23 | 0.07 ± 0.29 | NaN |
Despite the huge variations across subjects, it is interesting to see the regularity. For example, the “Clover” pattern (the columns highlighted by black arrow heads in Figure 6) favors “line-shape” gyri, such as middle-temporal (brain site #13), postcentral (brain site #20), precentral (brain site #22), and superior-frontal (brain site #26), though it is regularly found across subjects and its portion in all shape patterns is as high as 15.72%. Another example is the “Trident” pattern (highlighted by gray arrow heads), the portion of which is 5.58%. It is consistent across subjects on some “non-line-shape” brain sites, such as superior-parietal (brain site #27), inferior-parietal (brain site #6), and lateral-occipital (brain site #9).
Finally, “line-shape” cortical site (highlighted by dark shade in Table 3) have relatively more consistent 3-hinge pattern distributions than the “non-line-shape” ones (highlighted by shallow shade in Table 3). On average, the Pearson correlation coefficient (among subjects in terms of shape pattern distributions, i.e., the rows of matrices in Figure 6) is 0.11 ± 0.26 for the “line-shape” cortices and 0.08 ± 0.24 for the “non-line-shape” ones on the left hemispheres, while they are 0.10 ± 0.26 and 0.07 ± 0.24 on the right hemisphere. Right tailed t-test was performed on the correlation coefficients from the two groups (null hypothesis is “line-shape” > “non-line-shape,” significant level = 0.05) under the assumption of unequal population variances. The p values are far <.05 for both left and right hemispheres, suggesting the significance of this discrepancy.
In summary, in this section, we studied the relationship between 3-hinge shape patterns and cortical sites. Despite the large variations in distributions across subjects, we could also find that (a) “line-shape” cortices have relatively more consistent 3-hinge shape pattern distributions and (b) “Clover” shape pattern favors “line-shape” cortices while “Trident” shape pattern favors “non-line-shape” cortices.
3.3 Spatial distribution of 3-hinge numbers
In this section, we report 3-hinge numbers on different cortical sites and infer the relationship between them. We show the original 3-hinge numbers as well as the ones after area correction (Section 2.3.3) on brain sites of Desikan–Killiany parcellation in Figure 8a. These numbers and the standard deviations are averaged over all subjects. For the ease of observation, the average 3-hinge numbers after area correction (cyan curves) are also mapped to the parcellation scheme on the white matter surface of one example subject (Figure 8b). Because the distributions of 3-hinge numbers on brain sites are similar between two hemispheres (see curves in Figure 8a), only the left hemisphere is used to visualize the results in Figure 8b. By default, the following 3-hinge number related analyses are all based on values after area correction (cyan curves in Figure 8).
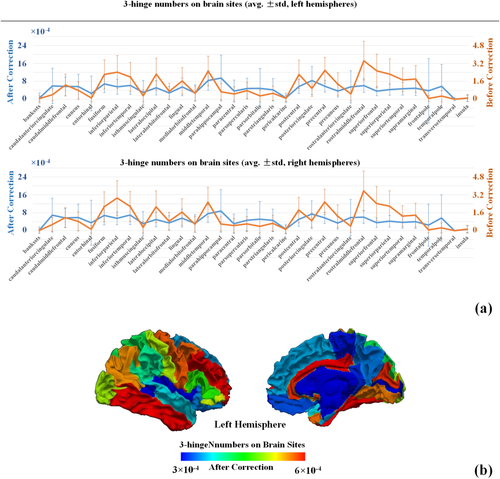
Distributions of 3-hinge numbers on brain sites under the Desikan–Killiany parcellation scheme. (a) 3-hinge numbers on each brain site are averaged over subjects. Orange curves are the original 3-hinge numbers on brain sites with no correction by the areas of these brain sites. The cyan curves are the 3-hinge numbers divided by the areas of brain sites. The bars are the standard deviations of 3-hinge numbers on each brain site over all subjects. (b) A left white matter surface with Desikan–Killiany parcellation scheme applied. Each brain site is color-coded by the averaged 3-hinge number after area correction [cyan curve in (a)] [Color figure can be viewed at wileyonlinelibrary.com]
At the resolution of Desikan–Killiany parcellation scheme, 3-hinges are not evenly distributed across the cerebral cortex in that p values of one-way ANOVA tests performed on 3-hinge numbers of all the brain sites are far smaller than 0.05 for both the hemispheres.
Regarding the cortical morphology, “line-shape” cortices have more 3-hinges than “non-line-shape” ones. On average, the 3-hinge numbers for these two types of cortices are 6.14 ± 3.25 versus 4.98 ± 3.08 (×10−4) on left hemisphere, and 5.51 ± 3.03 versus 4.69 ± 2.95 (×10−4) on right hemisphere. The p values of t tests are close to 0, suggestive of the significance. Cortical morphology also has an impact on the inter-individual consistency. We applied two-sample F test for equal variances with the null hypothesis that 3-hinge numbers on “line-shape” cortices and “non-line-shape” cortices come from normal distributions with the same variance. The variances of the two groups and p values of the two-sample F test are reported in Table 4. In brief, the variances of 3-hinge numbers on “line-shape” cortices are greater than those on “non-line-shape” ones. More importantly, the p values are far smaller than 0.05, indicating that the assumption of equal variance is not met.
| Left hemisphere | Right hemisphere | |||
|---|---|---|---|---|
| Variance | Line shape | Non-line shape | Line shape | Non-line shape |
| 6.40 × 10⁻⁷ | 3.99 × 10⁻⁷ | 5.93 × 10⁻⁷ | 3.25 × 10⁻⁷ | |
| p values of two-sample F test | 9.03 × 10⁻¹¹ | 3.72 × 10⁻¹⁵ | ||
In summary, “line-shape” cortices have more 3-hinges. This result is further supported by a similar study on brain lobes (Supporting Information, Figure S5 and Table S2), as the temporal lobes, consisting of “line-shape” cortices, have more 3-hinges than others. Meanwhile, 3-hinge numbers on “line-shape” cortices are relatively more variable across subjects than those on “non-line-shape” cortices.
4 DISCUSSIONS AND CONCLUSIONS
Generally, the 3-hinge clusters, including both the initial 200 clusters based on coordinates of 3-hinge spokes and the final 41 clusters based on the shape features of 3-hinges, are obtained via a data-driven pipeline on a big database. The data-driven pipeline is a cascade of K-means and spectral clustering methods, which are in a coarse-to-fine manner. Because of the heuristic clustering framework and results, no pre-knowledge of number of 3-hinge clusters and the shape patterns of these clusters were available. As so, at the current stage, it is difficult to manually label the 41 clusters on a sample dataset and use them as benchmarks to evaluate clustering accuracy of the data-driven results, because the lack of experience of experts could result in a low interrater consistency for the labeling. But the similarity within clusters and discrepancy between clusters are maximized due to the criterion in Equation 2 introduced in Section 2.3.2.
Before area correction, the 3-hinge number on a gyrus is positively correlated with the area of the gyrus. On average, the Pearson correlation coefficients between 3-hinge numbers and gyrus areas are 0.68 ± 0.09 and 0.67 ± 0.09 for the two hemispheres, respectively. It is intuitive to postulate that larger cortex produces more 3-hinges and that 3-hinges could be produced with equal chances in different regions. However, it is demonstrated in Section 3.3 that the distribution of 3-hinges is not uniform across the whole cortex after the area correction.
With regard to the variance of 3-hinge numbers, “line-shape” cortices have more 3-hinges than “non-line-shape” ones at the resolution of Desikan–Killiany parcellation scheme. Specially, temporal lobe has significantly more 3-hinges than the other lobes, and the difference between the other lobes are not significant enough (Supporting Information, Figure S5 and Table S2). A possible explanation is that the temporal lobe basically consists of long “line-shape” gyri (i.e., superior temporal gyrus, middle temporal gyrus, inferior temporal gyrus, and fusiform gyrus). Their orientations are along the long-axis of cortical sphere (the anterior–posterior axis). Slight perturbation of convolution process coming from another direction could more easily produce interruptive short gyri between those “line-shape” gyri, and gives rise to 3-hinges. These observations and postulates are partially supported by our previous simulation studies on a single gyrus, in which a thin and long gyrus could be more easily disturbed and gives rise to tangential bends (Zhang et al., 2017). These interpretations could also explain why “line-shape” gyri are significantly more variable than “non-line-shape” ones with regard to the variance of 3-hinge numbers.
For 3-hinge morphology, however, “line-shape” cortices have more consistent shape pattern distributions than “non-line-shape” ones. A possible explanation is that most of these “line-shape” gyri are of the primary convolutions at the first stage of brain development, to release the compression stress on the locations where curvatures are small on the initially smooth cortical surface (Budday et al., 2015c; Tallinen et al., 2016). Although these primary “line-shape” gyri are more vulnerable to instability and interindividual variation, reproducible 3-hinge shape patterns, such as the “Clover” pattern (the 15th cluster) could be produced by secondary and tertiary cortical folding coming from multiple other orientations on these primary gyri which serve as a substrate. In contrast, for “non-line-shape” cortical sites which are mainly located in parietal and occipital lobes, gyri orientated from multiple directions emerge within the same time window, eliciting a variety of unreproducible 3-hinge shape patterns. Besides the morphologies of lobes and gyro-sulcal patterns, other factors could have a close relationship with 3-hinge numbers and shape patterns. For example, in one of our recent studies (Ge et al., 2017), denser dMRI derived fiber connections were found in 3-hinges than other gyral regions. Such a relationship leads to a hypothesis that axonal growth might play a role in 3-hinge formation.
From the perspective of brain structure–function relation, it was suggested that the complexity of brain anatomy could be related to that of structural connectivity and function (Fischl et al., 2008; Honey et al., 2010; Mueller et al., 2013). In line with this speculation, we found in our previous works (Jiang et al., 2015, 2016a, 2016b) that 3-hinges were simultaneously involved in more functional subnetworks than other folding patterns, suggesting that 3-hinges might be possible predictors of high-level brain functions. We thus used the absolute numbers of 3-hinges (orange curves in Supporting Information, Figure S5 and Figure 8) to discuss this relation, as they could reflect the complexity of brain function.
The cortex exhibits a putative cortical hierarchy regarding the absolute 3-hinge numbers and inter-individual variability: frontal lobe > parietal lobe > temporal lobe > occipital lobe (Supporting Information, Figure S5 and Figure 8). This hierarchy is grossly in line with the cortical functional hierarchy. That is, primary and secondary areas have fewer 3-hinges than higher order cognitive ones.
In addition, the hierarchy of the inter-individual variability of 3-hinge numbers inversely coincides with the cortical development order: occipital lobe, temporal lobe, parietal lobe and frontal lobe (they are ordered according to their appearance timing. Please see the gyrogenesis and axonogenesis time course in Figure S8 from Razavi et al., 2017 for more details). This coincidence suggests that ontogenetic order could play a role in cortical folding and be related to interindividual variability. Primary areas, such as those in occipital lobe usually develops earlier than higher ones (Supporting Information, Figure S8), providing basic and less variable brain functions, and their anatomical and structural substrates could be less variable. The larger variability of higher order areas, such as those on parietal and frontal lobes (the development of which could extend to juvenile age), could be related to the variability in higher order brain functions, which were reflected by less consistent personalized characters and behaviors. In general, the variability is huge in later developed higher areas (Fischl et al., 2008; Mueller et al., 2013) and could be attributed to propagation of errors during brain development (Fischl et al., 2008) and exposure to the different postnatal environment (Mueller et al., 2013).
In general, 3-hinges, as a typical brain anatomical pattern, considerably vary across subjects in their numbers, locations and morphologies. Conventional image registration methods based on anatomical morphology could hardly align such diverse cortical patterns at a fine-grained resolution (refer to the misalignment between the gray-ordinate HCP surfaces in Figure 1). Despite the variations, some common themes are also found, such as the relationship between cortical site morphology and 3-hinge pattern distribution discussed in this work. In fact, six 3-hinges are consistently identified on macaque brains. These 3-hinges or similar counterparts are also found in chimpanzee and human brains in our previous work (Li et al., 2016). Our preliminary manual labeling results on precentral gyrus also show consistent wiring patterns of diffusion MRI streamline fibers derived from the corresponding 3-hinges across subjects (Supporting Information, Figure S6). Moreover, 3-hinge cortices exhibit a functional pattern that is significantly different from other gyral and sulcal regions (Jiang et al., 2015, 2016a, 2016b), suggestive of their uniqueness and importance in exploration of the relationship between brain structure and function. Therefore, 3-hinges could potentially be used as landmarks to improve cortical registration performance. Quantification of 3-hinge morphologies based on macro-scale imaging dataset is the major objective in this work. It will be a very interesting future topic to investigate whether an improved criterion or strategy for clustering can better decipher the morphological patterns of this folding pattern. We are also making efforts to search for clues to the mechanism of formation of such gyral folding patterns and the reasons for anatomical regularity and variation, as are still in their infancy. As a consequence of convolution where gyri from multiple orientations meet, 3-hinge essentially provides a unique angle to simultaneously explore the regular mechanism for development of primary anatomical architecture and reason for inter-individual variations. We foresee that all the aforementioned anatomical, structural and functional topics could be integrated into one framework, in which 3-hinge plays a central role, in the future.
ACKNOWLEDGMENTS
TZ was supported by National Natural Science Foundation of China (31671005 and 31500798). T Liu was partially supported by National Institutes of Health (DA033393, AG042599) and National Science Foundation (IIS-1149260, CBET-1302089, BCS-1439051, and DBI-1564736). They would like to thank the Human Connectome Project for sharing the datasets used in this work.


