Advanced time-series analysis of MEG data as a method to explore olfactory function in healthy controls and Parkinson's disease patients
Abstract
Objectives:
To determine whether time-series analysis of magnetoencephalography (MEG) data is a suitable method to study brain activity related to olfactory information processing, and to detect differences in odor-induced brain activity between patients with Parkinson's disease (PD) and controls.
Methods:
Whole head 151-channel MEG recordings were obtained in 21 controls and 20 patients with PD during a 10-min olfactory stimulus paradigm, consisting of 10 alternating rest-stimulus cycles (30 s each), using phenylethyl alcohol administered by means of a Burghart olfactometer. Relative spectral power and synchronization likelihood (SL; an unbiased measure of functional connectivity) were calculated for delta, theta, alpha1, alpha2, beta, and gamma frequency bands.
Results:
In controls, olfactory stimulation produced an increase in theta power and a decrease in beta power. In patients with PD, there was a decrease in alpha1 power. No significant interaction between group and condition was found for spectral power. SL analysis revealed a significantly different response to olfactory stimulation in patients with PD compared to controls. In controls, the odor stimulus induced a decrease in local beta band SL. The response in patients with PD involved a decrease in intrahemispheric alpha2 band SL.
Conclusion:
This is the first study to show that time-series analysis of MEG data, including spectral power and SL, can be used to detect odor-induced changes in brain activity. In addition, differences in odor-induced brain activity were found between patients with PD and controls using analysis of SL, but not of spectral power. Hum Brain Mapp 2009. © 2009 Wiley-Liss, Inc.
INTRODUCTION
Olfactory dysfunction is a frequent symptom in Parkinson's disease (PD) [Ansari and Johnson, 1975; Doty et al., 1988], that may even precede the development of overt motor symptoms [Berendse et al., 2001; Haehner et al., 2007; Ponsen et al., 2004; Ross et al., 2008]. Pathological studies support these observations by demonstrating that the olfactory bulb and tract may be among the induction sites of PD pathology and show an abundance of Lewy bodies and Lewy neurites in later pathological stages [Braak et al., 2003; Del Tredici et al., 2002]. The pathophysiology underlying the olfactory deficits in PD is far from being elucidated. In pathological studies, neuronal loss has been observed in the olfactory bulb and tracts of patients with PD [Pearce et al., 1995], whereas others have reported a doubling of the number of dopaminergic neurons in the olfactory bulb [Huisman et al., 2004]. Structural imaging studies have revealed disruption of the olfactory tract [Scherfler et al., 2006], but no abnormalities of olfactory bulb volume [Mueller et al., 2005]. A recent functional MRI study pointed to yet other brain areas that may be involved in PD-related olfactory dysfunction: after olfactory stimulation, neuronal activity in the amygdala and hippocampus was lower in patients with PD when compared to control subjects [Westermann et al., 2008].
Another way to study olfactory information processing is by using electrophysiological techniques. When the brain processes a stimulus, two types of changes may occur in the electroencephalogram (EEG) or magnetoencephalogram (MEG): evoked activities, which are exactly time-locked to the stimulus, and induced activities, which are changes in the EEG that are not phase-locked to the stimulus. The most basic approach to study the effects of olfactory stimulation was taken by Moncrieff [ 1962]. He presented healthy subjects with different odors while recording their EEG, and found that several odors reduced alpha activity. Subsequent studies using EEG have found both increases and decreases of spectral power in all frequency bands upon olfactory stimulation [Brauchli et al., 1995; Diego et al., 1998; Ishimaru et al., 2002; Klemm et al., 1992; Lorig and Schwartz, 1988; Martin, 1998; Masago et al., 2000; Van Toller et al., 1993]. Clearly, these previous EEG studies do not provide consistent data on which frequency bands are involved in olfactory information processing in healthy subjects. Much of the variation in these studies can probably be attributed to differences in EEG recording techniques and conditions, or in the type and quality of odors presented.
EEG recordings require a reference electrode and the signal can be (severely) distorted by passage through the skull, whereas MEG is reference-free and measures absolute magnetic flux that is hardly distorted by the skull. As a consequence of the resulting superior spatial resolution and signal-to-noise ratio of MEG compared to EEG, MEG may detect changes of oscillatory brain activity not evident in the EEG signal. So far, however, MEG has mainly been used to study olfactory evoked fields rather than induced activities. Olfactory evoked magnetic fields have been found bilaterally in the anterior-central parts of the insula, the parainsular cortex, the superior temporal sulcus [Kettenmann et al., 1996, 1997], and near the orbitofrontal sulcus [Tonoike et al., 1998]. A recent MEG study using frequency analysis combined with a beamforming technique reported olfactory event-related desynchronization in the beta and gamma band, in the right precentral gyrus, frontal gyri, and the superior parietal lobe gyrus [Miyanari et al., 2006].
In patients with PD, electrophysiological studies have shown that olfactory event-related potentials have prolonged latencies when compared to controls, whereas amplitudes are of a similar magnitude [Barz et al., 1997; Hawkes et al., 1997]. MEG studies of olfactory information processing have so far not been performed in patients with PD.
Recently, advanced time-series analysis techniques of resting-state MEG data have been used in patients with PD to show profound changes in both frequency distribution and functional connectivity between brain areas [Bosboom et al., 2006; Stoffers et al., 2007, 2008a]. These same analysis techniques have proven their use in studying resting-state EEG and MEG data in a number of other neurological conditions [Bosma et al., 2008; Cover et al., 2006; Pijnenburg et al., 2004; Stam et al., 2006], and can also be applied to task-related data [Gootjes et al., 2006; Pijnenburg et al., 2004]. Because the neurophysiological response in EEG or MEG to a stimulus also depends on the level of ongoing activity, changes in resting-state brain activity may negatively influence olfactory information processing in patients with PD.
The aim of this study was to determine whether time-series analysis of MEG data, including spectral power (as a measure of local synchronization) and synchronization likelihood (as a measure of functional connectivity), can be used to determine the frequency bands involved in olfactory information processing in healthy subjects, and also to detect differences in task-related brain activity during olfactory stimulation between patients with PD and healthy controls.
MATERIALS AND METHODS
Subjects
Twenty-three healthy control subjects and 21 patients with PD participated in this study. Because of considerable dental artifacts in the MEG recordings of two subjects, and technical problems during the MEG recording of one subject, the final study population consisted of 21 control subjects (9 male, 12 female; mean age 56.3 years, range 49– 73 years) and 20 patients with PD (12 male, 8 female; mean age 61.5 years, range 50–73 years; Hoehn & Yahr stage I–III). All patients with PD were recruited from the outpatient clinic of the department of Neurology of the VU University Medical Center (VUMC) or via advertisements on PD-related websites on the internet. PD was diagnosed according to the United Kingdom Parkinson's Disease Society Brain Bank criteria [Gibb and Lees, 1988]. Three patients were drug-naive. Of the remaining patients with PD, two patients were treated with levodopa monotherapy, three patients were on dopamine-agonist monotherapy, five patients were treated with a combination of both levodopa and a dopamine agonist, and seven patients used levodopa, a dopamine agonist as well as other medication, including monoamine oxidase B (MAO-B) inhibitors, catechol-O-methyltransferase (COMT) inhibitors, anticholinergics, and/or β-blockers. Medicated patients were tested “ON” medication, and all patients were rated for disease stage by means of the modified Hoehn and Yahr scale [Jankovic et al., 1990]. Control subjects were volunteers recruited among hospital employees and partners of patients, and reported normal subjective olfactory function and no history of major olfactory or neurological disorders. All subjects underwent olfactory testing by means of the “Sniffin' Sticks” test battery [Hummel et al., 1997]. Odor detection threshold was assessed using a single-staircase, three-alternative forced-choice procedure, with a 1:2 dilution series of 16 stages. Subjects were blindfolded and had to identify the odor-containing pen when presented with three pens, two containing the solvent and one the odorant (score 0–16). In the odor discrimination task, subjects were blindfolded and presented with 16 odor-triplets, with an interval of 30 s between each triplet. Each triplet consisted of two identical and one aberrant odorant. Subjects were asked to select the odd odor out of the three odorants presented, without the need to recognize or name the odors (score 0–16). Odor identification was measured by presenting 16 odorants in suprathreshold intensity in a four-alternative forced-choice format with verbal descriptors (score 0–16). Each stick was held approximately 2 cm in front of the nostrils for 2–3 s, with an interval of 20–30 s between each stick. Higher test scores indicate better olfactory function.
The study was approved by the Medical Ethics Committee of the VUMC, and all subjects gave written informed consent.
MEG data acquisition
MEG data were acquired using a 151-channel whole-head axial gradiometer MEG system (CTF Systems Inc., Port Coquitlam, BC, Canada). Average distance between sensors in this system is 3.1 cm. Patients were seated in a magnetically shielded room (Vacuum-schmelze GmbH, Hanau, Germany). The recording pass-band was 0–200 Hz with a sample rate of 625 Hz. A third-order software gradient was applied. At the beginning and at the end of the measurement, head position relative to the coordinate system of the helmet was recorded by leading small alternating currents through three position coils situated at the left and right pre-auricular points and the nasion on the subject's head.
MEG recordings were made during a 10-min olfactory stimulus paradigm, consisting of 10 alternating rest-stimulus cycles (30 s each). Phenylethyl alcohol (PEA) was presented in a suprathreshold concentration (40% v/v) unilaterally into the right nostril using an air-dilution olfactometer (OM6b, Burghart, Wedel, Germany) asynchronous to breathing, for 1 s every 4 s during the 30 s “stimulus” period; during the 30 s “rest” period, subjects received odorless air (see Fig. 1). Mechanical stimulation was avoided by embedding the olfactory stimuli in a constant flow of odorless, humidified air of controlled temperature (8 l/min, 36°C, 80% relative humidity). All subjects were asked to breathe through their mouth to avoid respiratory airflow in the nasal cavity, to keep their eyes open, and to avoid eye blinking or other ocular movement as much as possible. In addition, they received white noise (approximately 50 dBA) through headphones to mask switching clicks of the olfactory stimulation device.

A schematic representation of the olfactory stimulus protocol. Phenylethyl alcohol (PEA, 40% v/v) was delivered for 1 s every 4s during a 30 s period in the “stimulus” condition. During the 30 s “rest” period, subjects received odorless air. A total of 10 alternating rest-stimulus cycles were presented. Four seconds of odorless air preceded the first stimulus condition; MEG recordings acquired during these four seconds were not used in the analyses.
MEG data analysis
For each cycle, a rest and a stimulus epoch of approximately 6.56 s (sample rate 625 Hz; 4096 samples per epoch) free of significant artifacts as detected by visual inspection, were selected. For further off-line processing and data analysis, epochs were converted to ASCII-files and imported into the DIGEEGXP 2.0 software package (CJ Stam, Amsterdam, the Netherlands). Subsequently, the MEG data were digitally filtered off-line with a band-pass of 1–48 Hz.
Relative spectral power was calculated in the following frequency bands: 1–4 Hz (delta), 4–8 Hz (theta), 8–10 Hz (alpha1), 10–13 Hz (alpha2), 13–30 Hz (beta), and 30–48 Hz (gamma). The MEG channels were grouped into regions of interest (ROIs), roughly corresponding to the major cortical areas (frontal, central, temporal, parietal, and occipital) on the left and right side of the brain. The nine midline channels were left out of this clustering, leaving a total of 141 channels divided over 10 ROIs (Fig. 2A,B). Furthermore, seven channels (one above the left frontal, the left occipital, the right central, the right frontal and the right parietal region, and two above the right temporal region) were excluded in all patients because of technical problems during the recordings in some of the patients. Power values for these channels were left out of the averaging, ensuring that the mean relative power in a ROI containing bad channels was not distorted. Fast Fourier transformation was separately applied for every subject on all epochs in the previously mentioned frequency bands. Mean relative power averaged over all included channels was used in the primary statistical analysis (“overall spectral power”).

Sensor clustering and selection of relative spectral power and synchronization likelihood (SL) measures. (A) Clustering of MEG sensors above major cortical areas; midline sensors were excluded from spectral power and (SL) analysis. (B) Schematic representation of regions of interest (ROIs) used to calculate spectral power and short-distance local SL. (C) Long-distance interhemispheric connections used to calculate SL. (D) Long-distance intrahemispheric connections used to calculate SL. Arrows indicate SL connections used. L, left; R, right; F, frontal; C, central; P, parietal; O, occipital; T, temporal.
Functional connectivity between all pair-wise combinations of MEG channels was computed with synchronization likelihood (SL) [Stam and van Dijk, 2002]. SL is a general measure of the correlation or synchronization between two time series that is sensitive to linear as well as nonlinear interdependencies. In case of total synchrony the value of synchronization likelihood is 1, whereas for completely independent systems it equals 0. Parameter settings used for SL computation were explicitly based on the frequency content of the data (for lags and embedding dimensions used, see [Montez et al., 2006]).
SL was computed for the same epochs as aforementioned, in the same frequency bands. Digital, zero-phase lag filtering was done off-line. MEG channels were grouped into (left and right) central, frontal, occipital, parietal, and temporal regions, ROIs (Fig. 2A). Midline sensors and the aforementioned channels containing artifacts were excluded from averaging. Ten local SL measures were computed per epoch by averaging the SL values of all possible sensor pairs within each ROI (Fig. 2B). Five interhemispheric SL measures were computed per epoch by averaging the SL values of all possible sensor combinations between two homologous ROIs involved in the specific measure (Fig. 2C). Eight intrahemispheric SL measures were computed per epoch by averaging the SL values of all possible sensor combinations between the two ROIs involved in the specific measure (Fig. 2D). Within ROI (local) SL, between ROI intrahemispheric SL and between ROI interhemispheric SL represent overall weighted averages (based on the number of possible sensor combinations) of the aforementioned specific SL measures.
Statistical analysis
For each frequency band separately, we used a multilevel general linear model with a compound symmetric covariance structure, with “epoch” as level-1 units, and “subjects” as level-2 units to determine changes in overall relative power and overall SL measures (local, inter and intrahemispheric SL) in response to the olfactory stimulus in both groups (patients with PD and control subjects). “Condition” (rest vs. stimulus) was used as fixed factor. Parameters were estimated by the method of restricted maximum likelihood.
To determine whether patients with PD responded differently to an olfactory stimulus compared to control subjects, we performed similar analyses, with “condition,” “group” (patients with PD and control subjects) and the interaction “condition × group” as fixed factors.
When overall relative power, local, interhemispheric, or intrahemispheric SL showed statistically significant effects within a frequency band for “condition” or the interaction “condition × group,” we performed an exploratory post-hoc analysis for each ROI or short- or long-distance connection (Fig. 2B–D) within the frequency band of interest to obtain an indication of the regional distribution of the effect.
To determine if there were differences in olfactory test scores between patients with PD and control subjects, we used the univariate general linear model UNIANOVA, with “group” (patients with PD and control subjects) as factor, and corrected for age (covariate) and sex (factor).
We studied the relationship between spectral power, SL, and olfactory function by first subtracting overall relative power, local, interhemispheric, and intrahemispheric SL in the rest condition from the same measures in the stimulus condition for all epochs and, subsequently, averaging these values for each subject. Pearson correlation coefficients were then computed to determine the correlation between the changes in relative spectral power or SL measures and odor detection threshold scores or composite TDI (Threshold, Discrimination, Identification) scores, for each group separately.
Data were analyzed using SPSS 15.0 for Windows (Chicago, IL).
RESULTS
Relative spectral power
Control subjects and patients with PD showed a similar pattern of changes in overall spectral power for the stimulus compared to the rest condition (see Fig. 3): a power increase in the lower frequency bands (delta and theta), a power decrease in alpha1 and alpha2 bands, and a power increase in the gamma band. In the beta band, control subjects showed a power decrease, whereas patients with PD showed an increase. The overall similarity in the patterns of changes in spectral power is reflected in the absence of a significant interaction effect for overall spectral power between group (PD and control subjects) and condition (rest and stimulus) in any of the frequency bands (see Fig. 3).

Percentage of change and standard errors of the mean in relative spectral power (stimulus compared to rest condition), for each frequency band. Gray bars represent control subjects, white bars represent patients with PD. * indicates P-value <0.05, when comparing all rest and stimulus epochs in a multilevel statistical model.
Statistical analysis revealed a significant increase in overall spectral power for the stimulus compared to the rest condition for control subjects in the theta frequency band (F [1,383] = 5.93, P = 0.015). Post-hoc analyses indicated that this increase in power was mainly over bilateral central and temporal regions (Table I). Also in the control subjects, a significant decrease in overall spectral power for the stimulus compared to the rest condition was found in the beta frequency band (F [1,383] = 5.98, P = 0.015). Post-hoc analyses indicated that this decrease in power mainly involved bilateral central regions, and the right temporal region (Table I).
| Relative power | Rest | Odor | P-value |
|---|---|---|---|
| Theta (4–8 Hz) | Control subjects | ||
| Overall | 0.1689 | 0.1735 | 0.015 |
| LC | 0.1505 | 0.1556 | 0.045 |
| LF | 0.1982 | 0.2017 | 0.233 |
| LO | 0.1535 | 0.1557 | 0.390 |
| LP | 0.1394 | 0.1437 | 0.160 |
| LT | 0.1781 | 0.1836 | 0.045 |
| RC | 0.1461 | 0.1534 | 0.006 |
| RF | 0.2010 | 0.2060 | 0.104 |
| RO | 0.1559 | 0.1571 | 0.684 |
| RP | 0.1371 | 0.1418 | 0.120 |
| RT | 0.1809 | 0.1860 | 0.045 |
| Beta (13–30 Hz) | Control subjects | ||
| Overall | 0.3193 | 0.3119 | 0.015 |
| LC | 0.3817 | 0.3701 | 0.006 |
| LF | 0.2983 | 0.2911 | 0.092 |
| LO | 0.2999 | 0.2978 | 0.560 |
| LP | 0.3717 | 0.3664 | 0.287 |
| LT | 0.2664 | 0.2609 | 0.148 |
| RC | 0.3967 | 0.3859 | 0.015 |
| RF | 0.2978 | 0.2902 | 0.058 |
| RO | 0.3009 | 0.2948 | 0.075 |
| RP | 0.3832 | 0.3754 | 0.104 |
| RT | 0.2733 | 0.2662 | 0.043 |
| Alpha1 (8–10 Hz) | Patients with PD | ||
| Overall | 0.1174 | 0.1107 | 0.019 |
| LC | 0.1012 | 0.0941 | 0.019 |
| LF | 0.0903 | 0.0874 | 0.399 |
| LO | 0.1698 | 0.1600 | 0.051 |
| LP | 0.1353 | 0.1229 | 0.002 |
| LT | 0.1404 | 0.1312 | 0.022 |
| RC | 0.0851 | 0.0799 | 0.034 |
| RF | 0.0751 | 0.0732 | 0.403 |
| RO | 0.1610 | 0.1532 | 0.134 |
| RP | 0.1257 | 0.1143 | 0.011 |
| RT | 0.1262 | 0.1217 | 0.241 |
- All P-values are determined by a multilevel model, comparing all rest and stimulus epochs of control subjects or patients with PD. Analysis of regional changes was performed to explore the distribution of the odor-induced changes within a frequency band. After Holm-Bonferroni correction for multiple comparisons, only the LP regional P-value in the alpha1 band remained significant.
- L, left; R, right; C, central; F, frontal; O, occipital; P, parietal; T, temporal.
In patients with PD, a significant decrease in overall spectral power for the stimulus compared to the rest condition was found in the alpha1 frequency band (F [1,366] = 5.59, P = 0.019). Post-hoc analyses indicated that this decrease in power mainly involved bilateral central and parietal regions and the left temporal region (Table I).
Synchronization likelihood
Local SL
Control subjects and patients with PD showed a similar pattern in local SL for the stimulus compared to the rest condition (Fig. 4A): an increase in the delta band, and a decrease in the alpha1, alpha2, beta, and gamma bands in functional connectivity were found for both control subjects and patients with PD. In the theta band, control subjects showed an increase in local SL, whereas patients with PD showed a decrease.

Percentage of change and standard errors of the mean in synchronization likelihood (stimulus compared to rest condition), for each frequency band. (A) Local synchronization likelihood. (B) Interhemispheric synchronization likelihood. (C) Intrahemispheric synchronization likelihood. Gray bars represent control subjects, white bars represent patients with PD. * indicates P-value <0.05, when comparing all rest and stimulus epochs in a multilevel statistical model. # indicates P-value <0.05 for the group × condition interaction in a multilevel statistical model.
Statistical analysis revealed only a significant decrease in local SL for the stimulus compared to the rest condition for control subjects in the beta frequency band (F [1,411] = 4.59, P = 0.033). Post-hoc analyses indicated that this decrease in functional connectivity mainly involved connections within the left central and frontal regions (Table II).
| SL local beta (13–30 Hz) | Control subjects | ||
|---|---|---|---|
| Rest | Odor | P-value | |
| Local | 0.1149 | 0.1142 | 0.033 |
| LC | 0.1188 | 0.1172 | 0.009 |
| LF | 0.1125 | 0.1110 | 0.032 |
| LO | 0.1252 | 0.1253 | 0.879 |
| LP | 0.2017 | 0.1997 | 0.103 |
| LT | 0.0887 | 0.0886 | 0.777 |
| RC | 0.1073 | 0.1071 | 0.753 |
| RF | 0.1076 | 0.1071 | 0.397 |
| RO | 0.1403 | 0.1394 | 0.091 |
| RP | 0.1583 | 0.1575 | 0.376 |
| RT | 0.0765 | 0.0764 | 0.669 |
- All P-values are determined by a multilevel model, comparing all rest and stimulus epochs of control subjects. Analysis of regional changes was performed to explore the distribution of the odor-induced changes within a frequency band. After Holm-Bonferroni correction for multiple comparisons, regional P-values lost significance.
- L, left; R, right; C, central; F, frontal; O, occipital; P, parietal; T, temporal.
In patients with PD, there were no significant differences in local SL for the stimulus compared to the rest condition in any of the frequency bands (Fig. 4A).
There was no significant interaction effect for local SL between group (PD and control subjects) and condition (rest and stimulus) in any of the frequency bands (Fig. 4A).
Interhemispheric SL
Control subjects and patients with PD showed a similar pattern in interhemispheric SL for the stimulus compared to the rest condition (Fig. 4B): an increase in the lower frequency bands (delta and theta), and decreases in the alpha1, alpha2, beta, and gamma bands were found in both control subjects and patients with PD.
Statistical analysis revealed only a significant increase in interhemispheric SL for the stimulus compared to the rest condition for control subjects in the delta frequency band (F [1,383] = 4.84, P = 0.028). Post-hoc analyses indicated that this decrease in functional connectivity mainly involved connections between the temporal regions of both hemispheres (Table III).
| SL inter delta (1–4 Hz) | Control subjects | ||
|---|---|---|---|
| Rest | Odor | P-value | |
| Inter | 0.0785 | 0.0822 | 0.028 |
| Inter C | 0.0662 | 0.0655 | 0.710 |
| Inter F | 0.0773 | 0.0804 | 0.266 |
| Inter O | 0.0715 | 0.0737 | 0.336 |
| Inter P | 0.0618 | 0.0633 | 0.583 |
| Inter T | 0.0987 | 0.1078 | 0.012 |
- All P-values are determined by a multilevel model, comparing all rest and stimulus epochs of control subjects. Analysis of regional changes was performed to explore the distribution of the odor-induced changes within a frequency band. After Holm-Bonferroni correction for multiple comparisons, regional P-values lost significance.
- C, central; F, frontal; O, occipital; P, parietal; T, temporal.
In patients with PD, there were no significant differences in interhemispheric SL for the stimulus compared to the rest condition in any of the frequency bands (Fig. 4B).
There was no significant interaction effect for interhemispheric SL between group (PD and control subjects) and condition (rest and stimulus) in any of the frequency bands (Fig. 4B).
Intrahemispheric SL
Control subjects showed an increase in alpha2 intrahemispheric SL and a decrease in the beta band, whereas patients with PD showed the opposite pattern. Both control subjects and patients with PD showed an increase in intrahemispheric SL in the delta band, and a decrease in the alpha1 band. There were hardly any changes in theta or gamma band intrahemispheric SL (Fig. 4C).
Statistical analysis revealed no significant differences in intrahemispheric SL for control subjects in any of the frequency bands. In patients with PD, only the decrease in intrahemispheric alpha2 SL for the stimulus compared to the rest condition was statistically significant (F [1,375] = 9.64, P = 0.002). Post-hoc analyses indicated that this decrease in functional connectivity mainly involved frontoparietal and frontotemporal connections in the right hemisphere (Table IV).
| SL intra alpha2 (10–13 Hz) | Patients with PD | Control subjects | Group × condition interaction | |||
|---|---|---|---|---|---|---|
| Rest | Odor | P-value | Rest | Odor | P-value | |
| Intra | 0.0252 | 0.0245 | 0.002 | 0.0247 | 0.0249 | 0.009 |
| Left FT | 0.0269 | 0.0261 | 0.091 | 0.0270 | 0.0268 | 0.397 |
| Left FP | 0.0208 | 0.0203 | 0.272 | 0.0204 | 0.0213 | 0.054 |
| Left PO | 0.0318 | 0.0305 | 0.059 | 0.0296 | 0.0292 | 0.297 |
| Left TO | 0.0254 | 0.0253 | 0.831 | 0.0253 | 0.0261 | 0.126 |
| Right FT | 0.0261 | 0.0251 | 0.012 | 0.0255 | 0.0255 | 0.107 |
| Right FP | 0.0188 | 0.0179 | 0.016 | 0.0184 | 0.0186 | 0.038 |
| Right PO | 0.0312 | 0.0308 | 0.617 | 0.0276 | 0.0274 | 0.833 |
| Right TO | 0.0227 | 0.0222 | 0.176 | 0.0229 | 0.0232 | 0.138 |
- All P-values for patients with PD are determined by a multilevel model, comparing all rest and stimulus epochs of patients with PD. All P-values for group × condition interactions are determined by a multilevel statistical model, comparing the difference between all rest and stimulus epochs of control subjects with the difference between all rest and stimulus epochs of patients with PD. Analysis of regional changes was performed to explore the distribution of the odor-induced changes within a frequency band. After Holm-Bonferroni correction for multiple comparisons, regional P-values lost significance.
- FT, frontotemporal; FP, frontoparietal; PO, parietal-occipital; TO, temporal-occipital.
Furthermore, in the alpha2 band, a significant interaction effect for intrahemispheric SL between group (PD and control subjects) and condition (rest and stimulus) was found (F [1,749] = 4.25, P = 0.039; Fig. 4C). Post-hoc analyses indicated that this interaction effect mainly involved frontoparietal connections in the right hemisphere (Table IV).
Correlations with olfactory function
Patients with PD had lower mean olfactory test scores (based on odor detection threshold scores and composite TDI scores on the “Sniffin' Sticks” test battery) compared to control subjects, when corrected for age and sex (mean detection score control subjects = 8.0, patients with PD = 2.3, F [1,37] = 44.7, P < 0.001; mean TDI score control subjects = 31.0, patients with PD = 17.9, F [1,37] = 70.5, P < 0.001).
In control subjects, correlations were found between overall relative power and local SL in the alpha1 band and TDI scores (r = 0.50, P = 0.020, and r = 0.44, P = 0.049 respectively), and between intrahemispheric SL in the alpha1 band and odor detection threshold scores (r = 0.47, P = 0.031). In patients with PD, no correlations were found between olfactory test scores and overall relative power or local, interhemispheric, or intrahemispheric SL.
DISCUSSION
This is the first report using time-series analysis of MEG data to study odor-induced changes in spectral power and functional connectivity in controls and patients with PD. The pattern of these changes in controls and patients with PD showed many similarities, but was significantly different for functional connectivity in the alpha2 band.
This study showed a significant increase in overall theta band power and a decrease in overall beta band power for control subjects. Although different conclusions have been generated as to which frequency bands are involved in olfactory information processing due to variations in data analysis methods and stimulation paradigms for odor responses, our present data confirm previous findings in the theta and beta band in healthy subjects [Kemp et al., 2001; Klemm et al., 1992; Miyanari et al., 2006]. A study by Klemm et al. [ 1992] showed widespread increases in the theta band in response to a variety of odors, especially over the left anterior group of EEG electrodes and the right hemisphere. Increases in evoked theta have been reported in response to various other sensory stimuli, such as visual and auditory stimulation [Basar et al., 2001; Mazaheri and Picton, 2005]. Increases in theta rhythm have also been associated with (both pleasant and unpleasant) emotional responses [Aftanas et al., 2001; Salminen and Ravaja, 2008; Sammler et al., 2007; Schacter, 1977]. Because the olfactory system is part of the limbic system, which is implicated in emotional processing, our findings of increased theta activity in response to a (pleasant) rose-odor can also be interpreted as an emotional response. Alternatively, the odor-induced changes in theta rhythm may reflect nonspecific sensory processing. Future studies using olfactory stimulation and MEG recording could focus on localizing the observed odor-induced changes in spectral power and functional connectivity by means of a beamforming technique, to determine whether the effects are confined to anatomical olfactory areas or, instead, have a distribution that is compatible with nonspecific task-induced changes.
Our findings for spectral power in the beta band are concurrent with a recent MEG study using intravenous application of odorous stimuli, reporting event-related desynchronization in the beta (and gamma) band, mainly in the right precentral gyrus, and superior and middle frontal gyri [Miyanari et al., 2006]. In addition, a study by Kemp et al. [ 2001] partly supports our findings, stating that elderly subjects with intact olfactory function displayed a decrease in beta band power in the odor condition, which was not specific to particular brain regions but rather an overall effect.
A decrease in relative spectral power in the alpha1 band was seen in both controls and patients with PD, although this reached significance only in the patients with PD. All subjects were told beforehand that odorous stimuli would be delivered; however, patients with PD may not have been able to perceive any odor during the whole of the experiment, because of their olfactory dysfunction. This might have resulted in an increased state of vigilance or attention (“searching the odor”), compared to control subjects, and therefore in a significant decrease in (centro-parietal) spectral power in the alpha1 band [Gevins et al., 1997; Stipacek et al., 2003]. Another explanation for the findings in the alpha1 band might be derived from a series of studies by Lorig et al. [ 1991], who demonstrated a decrease in central alpha band power after low-concentration odorous stimulation in healthy subjects [Lorig, 1994]. Possibly, suprathreshold odor exposure in patients with PD who suffer from olfactory deficits is similar to low-level odor exposure in healthy subjects and thus might induce a decrease in alpha power.
The absence of a significant difference in odorant-induced changes in spectral power between patients with PD and control subjects in this study corresponds to the results of a previous study by Gori et al. [ 1995] that failed to find any alterations in the EEG of patients with PD after olfactory stimuli compared to control subjects. Spectral power analysis apparently is not a suitable method to study differences in olfactory information processing between patients with PD and controls.
Synchronization likelihood is a measure of the integration of neuronal activity between brain regions (“functional connectivity”), which is essential to normal brain function in a resting-state condition, but also plays a key role in cognitive functioning. A number of recent studies have shown changes in functional connectivity between brain areas in the resting-state condition in various neurological disorders compared to healthy controls [Bosma et al., 2008; Cover et al., 2006; Pijnenburg et al., 2004; Stam et al., 2006]. Moreover, analysis of functional connectivity has also proven a useful tool to study task-related brain activity, for instance in a working memory paradigm [Pijnenburg et al., 2004; Sarnthein et al., 1998]. The present study showed that the analysis of functional connectivity is also a suitable method to study olfactory information processing, and moreover, to detect odor-induced differences in ongoing brain activity between healthy control subjects and patients with PD. Olfactory stimulation induced a decrease in local SL in the beta frequency band in the control subjects and an increase in interhemispheric SL in the delta frequency band compared to the rest condition. Considering the decrease in the beta band in both overall relative power and local SL in the controls, consistent with a previous MEG study [Miyanari et al., 2006], this frequency band might be particularly sensitive to olfactory stimuli.
Furthermore, an increase in functional connectivity between both hemispheres in the delta band was found in control subjects. A previous EEG study on odor-induced changes in functional connectivity revealed a decrease in coherence in the delta band in the frontal region [Harada et al., 1998]. However, findings on functional connectivity in the delta frequency band should be interpreted with caution, as slow-wave artifacts as a result of breathing or ocular movement might have passed the visual inspection unnoticed.
The most interesting observation was an odor-induced decrease in intrahemispheric SL in the alpha2 band in patients with PD, which was significantly different from the response to olfactory stimulation in control subjects. Apparently, in addition to the changes in functional connectivity in the resting state [Stoffers et al., 2008a], patients with PD also have a defective functional coupling within hemispheres in a stimulus condition. Future olfactory imaging studies in otherwise healthy subjects with olfactory deficits unrelated to PD could reveal whether the observed changes in functional connectivity in patients with PD are related specifically to olfactory dysfunction in PD or, instead, associated with olfactory dysfunction in general.
Previously, it has been shown that resting-state functional connectivity, but not spectral power values, are modulated by dopaminergic medication in patients with PD [Stoffers et al., 2007, 2008b]. In this study, however, only three patients were unmedicated; consequently, we have insufficient data to draw any conclusions with respect to the possibility of medication effects on odor-induced brain activity patterns.
Summarizing the overall pattern of odor-induced changes in brain activity, control subjects showed an increase in relative spectral power and SL in the lower frequency bands (delta and theta), and decreases in the alpha1, alpha2, and beta band for the olfactory stimulus compared to the rest condition (see Table V). This response pattern of an increase in theta, and a decrease in alpha, is associated with attention and working memory or cognitive tasks [Buzsaki, 2005; Gevins and Smith, 2000; Klimesch, 1999; Sarnthein et al., 1998]. Patients with PD show a mostly similar pattern, although an opposite direction of changes can be seen in specific frequency bands (for relative spectral power in the beta band, local SL in the theta band, and intrahemispheric SL in the theta, alpha2, and beta band), indicating that patients with PD do not just respond less strongly to the stimuli, but may process (olfactory) information in a different way than control subjects.
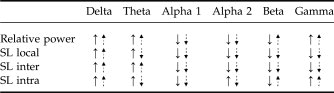 |
- ↑ indicates increase in power or synchronization, ↓ indicates decrease in power or desynchronization for the olfactory stimulus compared to the rest condition. Straight arrows represent control subjects, dotted arrows represent patients with PD.
Correlations between psychophysical olfactory test scores and changes in spectral power or functional connectivity were found in the alpha1 band, but only for control subjects. In a previous study, Murphy et al. [ 1994] found odor thresholds to correlate with the amplitude magnitude of OERPs. Although the odor-induced changes in the alpha1 band in control subjects in this study show a consistent direction, they are not significant. Therefore, the correlations with olfactory function must be interpreted cautiously. Yet, these correlations suggest that our findings are specifically related to olfactory function and not to attention or cognitive tasks in general. The lack of a relationship between the scores on a psychophysical test and measures of local synchrony or functional connectivity in patients with PD may be due to the differences in odor delivery between the psychophysical tests and the olfactory stimulation paradigm during the MEG registrations. The olfactory stimulus-paradigm used during MEG recordings is a “passive” method of odor delivery, whereas psychophysical testing demands a more “active” approach to perceive the odor. Because patients with PD are reported to have difficulty sniffing [Sobel et al., 2001], a reduced sniff vigor in patients with PD might partly explain the lack of a correlation in this study between the neurophysiological parameters, as measured by MEG, and the psychophysical test scores.
In conclusion, the results of this study show that time-series analysis of MEG data is a suitable method to detect odor-induced changes in brain activity. Furthermore, we demonstrated that there is a difference in odor-induced functional connectivity, but not spectral power, between patients with PD and control subjects, which may reflect abnormal olfactory information processing in patients with PD.