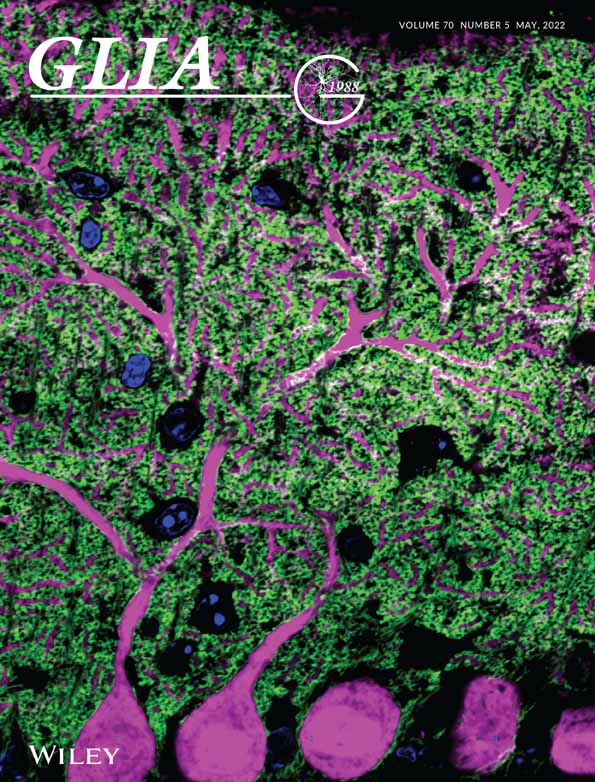
MAC2 is a long-lasting marker of peripheral cell infiltrates into the mouse CNS after bone marrow transplantation and coronavirus infection
Funding information: Alzheimer's Association, Grant/Award Number: AARF-16-442762; National Institutes of Health, Grant/Award Number: NS082174; National Institutes of Health/National Institute of Aging, Grant/Award Numbers: RF1AG056768, RF1AG065329, U54AG054349; National Institutes of Health/National Institute of Neurological Disorders and Stroke, Grant/Award Numbers: R01NS041249, R01NS083801, R35NS116835; National Multiple Sclerosis Society, Grant/Award Number: CA-1607-25040; The Ray and Tye Noorda Foundation
Abstract
Microglia are the primary resident myeloid cells of the brain responsible for maintaining homeostasis and protecting the central nervous system (CNS) from damage and infection. Monocytes and monocyte-derived macrophages arising from the periphery have also been implicated in CNS pathologies, however, distinguishing between different myeloid cell populations in the CNS has been difficult. Here, we set out to develop a reliable histological marker that can assess distinct myeloid cell heterogeneity and functional contributions, particularly in the context of disease and/or neuroinflammation. scRNAseq from brains of mice infected with the neurotropic JHM strain of the mouse hepatitis virus (JHMV), a mouse coronavirus, revealed that Lgals3 is highly upregulated in monocyte and macrophage populations, but not in microglia. Subsequent immunostaining for galectin-3 (encoded by Lgals3), also referred to as MAC2, highlighted the high expression levels of MAC2 protein in infiltrating myeloid cells in JHMV-infected and bone marrow (BM) chimeric mice, in stark contrast to microglia, which expressed little to no staining in these models. Expression of MAC2 was found even 6–10 months following BM-derived cell infiltration into the CNS. We also demonstrate that MAC2 is not a specific label for plaque-associated microglia in the 5xFAD mouse model, but only appears in a distinct subset of these cells in the presence of JHMV infection or during aging. Our data suggest that MAC2 can serve as a reliable and long-lasting histological marker for monocyte/macrophages in the brain, identifying an accessible approach to distinguishing resident microglia from infiltrating cells in the CNS under certain conditions.
1 INTRODUCTION
Myeloid cells of the innate immune system are comprised of two distinct populations: tissue-resident and monocyte-derived macrophages. In the central nervous system (CNS), the macrophage compartment consists of parenchymal macrophages, known as microglia, and non-parenchymal macrophages, known as CNS (or border)-associated macrophages (CAMs or BAMs) (Kierdorf et al., 2019; Mrdjen et al., 2018). Microglia reside in the brain parenchyma spatially arranged in discrete non-overlapping territories, while BAMs reside within specialized CNS border interfaces that separate the CNS from the periphery, including the choroid plexus, meninges, and perivascular spaces. Recent studies indicate that microglia and non-parenchymal macrophages represent ontologically, phenotypically, and functionally distinct cell populations (Jordao et al., 2019; Masuda et al., 2019; Mrdjen et al., 2018; Munro et al., 2020; Shemer et al., 2018; Utz et al., 2020; Van Hove et al., 2019); however, inflammation-induced phenotypic changes in these cells have made distinguishing and assessing different myeloid cell populations and their diverse functions during disease difficult.
In mice, studies have shown that microglia derive from erythromyeloid precursors in the yolk sac, entering the brain as primitive or pre-macrophages to colonize the CNS during embryonic development (Ginhoux et al., 2010; Kierdorf et al., 2013). Once the blood–brain barrier (BBB) is formed, myeloid cell infiltration into the CNS is restricted and microglial population maintenance relies on local self-proliferation without contributions from peripheral monocytes (Shemer et al., 2015). While studies have shown that specific BAM subsets (e.g. perivascular and leptomeningeal macrophages) also derive from the yolk sac (Gomez Perdiguero et al., 2015; Utz et al., 2020), it appears that choroid plexus and dural macrophage populations can be replenished by bone marrow (BM)-derived monocytes under steady-state conditions (Goldmann et al., 2016; Van Hove et al., 2019). Under inflammatory or disease conditions (e.g., facial nerve axotomy, amyotrophic lateral sclerosis, and experimental autoimmune encephalomyelitis), studies have shown that peripheral-derived monocytes enter the brain, but do not contribute significantly to the microglial pool unless under defined experimental circumstances (e.g., irradiation, myeloablative chemotherapy, and BBB disruption) (Ajami et al., 2007; Ajami et al., 2011; Cronk et al., 2018; Ginhoux et al., 2010; Hohsfield et al., 2020; Jordao et al., 2019; Lund et al., 2018; Mildner et al., 2007; Reed-Geaghan et al., 2020).
Despite their distinct origins and functions, assessing the individual contributions of infiltrated myeloid cells and activated microglia remains one of the major challenges in neuroimmunology, particularly within the context of neuroinflammatory diseases (Herz et al., 2017; Honarpisheh et al., 2020; Prinz & Priller, 2014). Monocytes and microglia share substantial transcriptional and phenotypic overlap. Several of the genes and proteins used to separate these two populations are not exclusively expressed but instead only relatively enriched in one population (e.g., CD45, CX3CR1, and CCR2) (Haage et al., 2019; Honarpisheh et al., 2020; Ransohoff & Cardona, 2010; Shemer et al., 2015). Microglial-specific genes and proteins have been identified; however, microglia downregulate their homeostatic signature (e.g., P2ry12, Tmem119, Sall1, and Siglech) and upregulate monocyte/macrophage-associated (e.g., Apoe, Itgax, and Lyz2) markers during disease (Bennett et al., 2016; Butovsky et al., 2014; Buttgereit et al., 2016; Keren-Shaul et al., 2017; Konishi et al., 2017). Studies have also identified genes and proteins that are highly expressed in BM-derived myeloid cells, including brain engrafted macrophages (e.g., Ms4a7, Clec12a, Ccr2, Apoe, CD38, Mrc1, and Cd11a), but many of these genes are also found in other CNS myeloid subsets or fail to label cells during immunohistochemical investigations on fixed brain sections (Bennett et al., 2018; Mrdjen et al., 2018; Shemer et al., 2018; Shukla et al., 2019). As such, there is no histological marker that can reliably identify peripheral myeloid cell infiltrates versus activated microglia in the CNS to date.
Researchers currently utilize a number of experimental approaches to identify peripheral myeloid cells in the CNS. However, many of these paradigms pose concerning caveats. The generation of GFP BM chimeras provides labeling of BM-derived cells, but this approach involves irradiation, which can induce BBB damage and non-homeostatic peripheral contributions to the microglial niche (Ajami et al., 2007; Mildner et al., 2007). Parabiosis avoids these irradiation-induced effects but can involve complicated surgery and result in host-graft rejection. Despite the usefulness of mice genetically labeled for monocyte markers (e.g., Ccr2RFP mice), studies have shown that these cells may downregulate CCR2 as they mature/differentiate and enter the brain (Gschwandtner et al., 2019; Saederup et al., 2010). Furthermore, these mice are haploinsufficient for CCR2, a critical factor for monocyte migration and entry into the CNS (Chu et al., 2014). Fate mapping techniques have allowed for unprecedented exploration and manipulation of monocytes, but again these techniques are not without their limitations (Chen, Sun, et al., 2020; Liu et al., 2019). The use of lineage tracing from BM-expressed drivers involves the use of tamoxifen, which has recently been identified as a neutral agonist in macrophage lineage tracing studies. A recent study has shown that tamoxifen treatment of pregnant mice induces a significant expansion of the embryonic macrophage population (Rojo et al., 2018).
Given the lack of reliable markers that can distinguish between monocyte-derived cells and activated microglia, we set out to develop a new histological tool for peripheral myeloid cell studies in the mouse CNS. To accomplish this, we employed infection of C57BL/6 mice with the neuroadapted JHM strain of mouse hepatitis virus (JHMV), a mouse coronavirus and a robust mouse model for monocyte infiltration in the CNS. Studies indicate that JHMV-infected mice exhibit substantial infiltration by monocytes along with other peripheral immune cells (Held et al., 2004; Savarin et al., 2010). We recently employed single-cell RNA sequencing (scRNAseq) on flow-sorted CD45+ cells infiltrating into the CNS of JHMV-infected mice to better understand the immunological landscape at defined times following infection with a neurotropic virus (Syage et al., 2020). Using this approach, we identified Lgals3 as a highly enriched gene for monocytes. We then validated the expression of this marker at the protein level via galectin-3/MAC2 staining in BM-derived myeloid cells, and its utility in distinguishing between monocyte and microglia populations in response to JHMV infection as well as in young transgenic mouse models of Alzheimer's disease (AD). This approach not only provides a reliable marker for peripheral-derived cells, but also eliminates the necessity of complex transgenic mouse lines to discern myeloid cell populations, broadening the study of myeloid cell spatial and phenotypic profiles during disease and neuroinflammation.
2 MATERIALS AND METHODS
2.1 Compounds
Pexidartinib (PLX3397) was provided by Plexxikon Inc. and formulated in AIN-76A standard chow at a dose of 600 ppm by Research Diets Inc.
2.2 Mice
All mice were obtained from The Jackson Laboratory. For transplant studies, bone marrow cells were isolated from CAG-EGFP mice (Stock No. 006567). Male and female 5xFAD mice were obtained from MMRRC-JAX (Stock No. 34848) and have been previously described in detail (Oakley et al., 2006). For 5xFAD genotyping, the primer sequences used were PS1 Forward 5′-AAT AGA GAA CGG CAG GAG CA-3′ and PS1 Reverse 5′-GCC ATG AGG GCA CTA ATC AT-3′. All other mice were male C57BL/6 (000664) mice. Animals were housed with open access to food and water under 12 h/12 h light–dark cycles.
2.3 Animal treatments
All rodent experiments were performed in accordance with animal protocols approved by the Institutional Animal Care and Use Committee at the University of California, Irvine (UCI). JHMV infection: Six-week-old C57BL/6 mice (males and females) and four-month-old 5xFAD mice (males and females) were infected intracranially (i.c.) with 200–250 PFU of JHMV in 30 μL of sterile Hanks balanced sterile solution (HBSS); control mice received an i.c. injection of HBSS. JHMV-infected C57BL/6 mice were sacrificed at 7, 14, and 21 days post-infection (d.p.i.) and brains and spinal cords isolated to assess viral titers and perform immunohistochemical staining to evaluate monocyte infiltration. JHMV-infected 5xFAD mice were sacrificed at 10 d.p.i. and brains removed to determine viral titers, evaluate β-amyloid (Aβ) burden, and perform immunohistochemical staining to assess monocyte infiltration. scRNAseq was conducted on male animals. Microglial depletion: Mice were administered ad libitum with PLX3397 at a dosage of 600 ppm (to eliminate microglia) or vehicle (control) for 14d. Bone marrow transplant: Tissue from a previous study by Hohsfield et. al were employed for analyses performed in the present report (Hohsfield et al., 2020). In brief, C57BL/6 mice were anesthetized with isoflurane and then irradiated with 1000 cGy (whole body) and reconstituted via retroorbital injection with 2 × 10⁶ whole BM cells from CAG-EGFP mice. Blood was measured at 4, 8, and/or 12 weeks post transplantation to track granulocyte chimerism. At time of sacrifice, mice were euthanized, and BM was harvested and analyzed by flow cytometry for HSC chimerism. This established an average percent chimerism of >95% in whole body irradiated mice as previously reported (Hohsfield et al., 2020). Tissue collection: Following treatments, adult mice were sacrificed via carbon dioxide inhalation and perfused transcardially with 1X PBS. Brains were extracted and dissected down the midline, with one half flash-frozen for subsequent RNA and protein analyses, and the other half drop-fixed in 4% paraformaldehyde. Fixed brains were cryopreserved in PBS + 0.05% sodium azide + 30% sucrose, frozen, and sectioned at 40 μm on a Leica SM2000 R sliding microtome for subsequent immunohistochemical analyses. For brains and spinal cords from JHMV-infected mice, half brains dissected down the midline and the length of spinal cord extending from thoracic vertebrate 6–10 was cryoprotected in 30% sucrose, cut into 1-mm transverse blocks and processed to preserve the craniocaudal orientation and subsequently embedded in O.C.T. (VWR, Radnor, PA, USA). For spinal cords, 8 μm-thick coronal sections were cut and sections were stained following standard immunofluorescence protocols; for brains, 8 μm sagittal sections were cut (Blanc et al., 2015; Dickey et al., 2016; Marro et al., 2016).
2.4 Histology and confocal microscopy
Fluorescent immunolabeling followed a standard indirect technique as described previously (Elmore et al., 2014). Brain sections were stained with antibodies against the following defined antigens: ionized calcium binding adaptor molecule 1 (IBA1; 1:1000; 019-19,741, Wako and ab5076, Abcam) and MAC2/Galectin-3 (1:500; CL8942AP Cedarlane). For DAPI staining, mounted brain sections were cover-slipped using Fluoromount-G with DAPI (00-4959-52, Invitrogen). Amylo-Glo (TR-300-AG; Biosensis) staining was performed according to the manufacturer's instructions. High resolution fluorescent images were obtained using a Leica TCS SPE-II confocal microscope and LAS-X software. For confocal imaging, one field of view (FOV) per brain region was captured per mouse unless otherwise indicated. For whole brain stitches, automated slide scanning was performed using a Zeiss AxioScan.Z1 equipped with a Colibri camera and Zen AxioScan 2.3 software. Microglial morphology was determined using the Filaments module in Bitplane Imaris 7.5, as described previously (Elmore et al., 2015). Cell quantities were determined using the Spots module in Imaris. MAC1+ IBA1+ staining was quantified by using a standardized algorithm in the Surfaces module in Imaris. Total IBA1+ and MAC2+ IBA1+ surface area in the field of view was categorized as plaque-associated or non-plaque-associated based on proximity to plaques (plaque-associated ≤ 5.8 μm). Percentage of MAC2+ IBA1+ coverage was calculated by dividing MAC2+ IBA1+/total IBA1+ surface area.
2.5 Data analysis and statistics
Statistical analysis was performed with Prism Graph Pad (v.8.0.1). To compare two groups, the unpaired Student's t-test was used. To compare multiple groups, a one-way ANOVA with Tukey's posthoc test was performed. For all analyses, statistical significance was accepted at p < .05. All bar graphs are represented as means ± SEM and significance expressed as follows: *p < .05, **p < .01, ***p < .001. n is given as the number of mice within each group, unless otherwise indicated.
3 RESULTS
3.1 Lgals3/MAC2 distinguishes infiltrating cells from microglia in the adult CNS
We and others have previously identified distinct transcriptional and phenotypic profiles of brain-engrafted peripherally derived myeloid cells from resident microglia in the adult mouse brain; however, these findings have yet to translate into reliable histological markers that distinguish peripheral infiltrates from their microglial counterparts in the CNS (Bennett et al., 2018; Cronk et al., 2018; Hohsfield et al., 2020; Anat Shemer et al., 2018). In this study, we explored a previously described scRNAseq data set to identify transcripts that distinguish between resident microglia and infiltrating myeloid cells (Syage et al., 2020). scRNAseq data was obtained from the JHMV mouse model which recapitulates many characteristics of human diseases associated with encephalomyelitis and demyelination (Bergmann et al., 2006; Lampert et al., 1973; Lane & Buchmeier, 1997; Savarin et al., 2010; Weiner, 1973). In brief, intracranial inoculation of susceptible C57BL/6 mice with the neuroadapted JHMV, a member of the Coronaviridae family, results in an acute encephalomyelitis characterized by wide-spread viral replication in astrocytes, microglia, and oligodendroglia with relative sparing of neurons (Bergmann et al., 2006; Lane & Hosking, 2010). In response to JHMV infection, proinflammatory cytokines and chemokines are expressed by activated microglia and astrocytes, resulting in an orchestrated inflammatory response consisting of neutrophils, monocytes/macrophages, and activated virus-specific CD4+ and CD8+ T cells (Bergmann et al., 2006; Hosking & Lane, 2010; Lane & Hosking, 2010).
We recently performed a detailed analysis of immune cell infiltration into the CNS of JHMV-infected mice through scRNAseq, which highlighted the heterogeneity of the immune response following infection with a neurotropic virus, in addition to confirming that monocytes and neutrophils are the prominent cells entering the CNS (Syage et al., 2020). Here, we employed the scRNAseq data set to identify differentially expressed genes between monocyte/macrophage cells compared to microglia. Lgals3 transcripts were enriched in infiltrating monocytes and macrophages, and lowly expressed in microglia (specifically in MG3 and Cyc. MG clusters) even under JHMV/inflammatory conditions (Figure 1a–d). Lgals3 encodes galectin-3 (also known as MAC2), which is a member of the lectin family involved in monocyte/macrophage chemoattraction and activation (MacKinnon et al., 2008). Since low levels of Lgals3 transcripts were detected in some microglia clusters, we next evaluated whether galectin-3/MAC2 expression was present in both monocyte/macrophage and distinct microglial populations. To assess this, we subsequently infected a separate cohort of C57BL/6 mice with JHMV and evaluated the ability of galectin-3/MAC2 to distinguish distinct myeloid cell populations. Histological analyses for MAC2 in non-infected brain sections revealed no MAC2 staining in IBA1+ cells, except in areas associated with ventricles and the choroid plexus (Figure 1e and f). Analysis of JHMV-infected brain and spinal cord sections showed a clear population of IBA1+/MAC2+ cells that were not present in uninfected animals. IBA1+/MAC2+ cells appear spatially and morphologically distinct from IBA1+/MAC2- cells, which resemble microglia and reside in parenchymal areas (Figure 1e, f, and i). In the brain, IBA1+/MAC2+ cells accumulated in the brainstem (medulla, pons, midbrain, thalamus, and hypothalamus), cerebellum (near the fourth ventricle), and in white matter tracts (corpus callosum), whereas little to no deposition was observed in the cerebrum at any timepoint (hippocampus, cortex, and striatum) with the exception of sites near the lateral ventricle and/or white matter tracts (Figure 1e, f, and h). Many areas of high MAC2+ cell accumulation appear to be in or near white matter areas (Figure 1f). IBA1+/MAC2+ cells appear less ramified with retracted/thickened processes and enlarged cell somas compared to IBA1+/MAC2- cells (Figure 1f). IBA1+/MAC2+ cell infiltration in the brain appears to peak around 14 d.p.i (Figure 1e, g, and h); however, the brainstem still shows prominent accumulation at 21 d.p.i. In the spinal cord, IBA1+/MAC2+ cell infiltration peaked at 14 d.p.i. and declined by 21 d.p.i. with cells enriched in white matter tracts within the ventral funiculus (Figure 1i and j).

3.2 MAC2 is a specific and long-lasting marker for bone marrow-derived infiltrating cells
Beyond acute CNS infiltration, current monocyte markers make it difficult to distinguish between peripheral and resident myeloid cells. CCR2 and CD14 are downregulated following monocyte differentiation into macrophages (Fantuzzi et al., 1999; Steinbach & Thiele, 1994; Wong et al., 1997) and studies using CCR2RFP knock-in mice report that CCR2RFP+ cells are not detected in the CNS, even under inflammatory conditions (Saederup et al., 2010), meaning that these markers fail to label monocyte-derived cells past a few days following engraftment in the CNS. Given these difficulties, we next sought to examine whether MAC2 could serve as (1) a marker for BM-derived cells and (2) a long-lasting marker for these cells once engrafted in the brain.
To accomplish this, we utilized BM GFP chimeric mice to assess the ability of this monocyte/macrophage marker candidate to label infiltrating BM-derived cells. CAG-GFP donor BM was administered (via retro-orbital injection) to whole body (WB, with >95% chimerism) irradiated mice and allowed to recover for ~10 months, resulting in long-term GFP chimeric mice. In this model, GFP+ expression indicates that cells derive from the BM. Following recovery, we explored co-localization of MAC2 expression in GFP+ cells in the adult mouse brains of long-term GFP BM chimeric mice and long-term GFP BM chimeric mice that underwent colony-stimulating factor 1 receptor inhibitor (CSF1Ri)-induced myeloid cell depletion and repopulation (~6 months following CSF1Ri treatment and CNS engraftment) (Figure 2a). In a previous study, we demonstrated that irradiation/BM transplant followed by CSF1Ri treatment results in substantial replacement of the microglial compartment with BM-derived monocytes (Hohsfield et al., 2020), providing a model to evaluate long-term and brain-wide BM-derived monocyte/macrophage engraftment.

Ten-month WB irradiated mice exhibited ~20% infiltration of GFP+ cells, with prominent deposition observed in areas near the lateral ventricle/subventricular zone (SVZ), medial habenula (MHb), internal capsule (IC), and meninges (Figure 2a and b). In accordance with our prior data, we observed that these infiltrating GFP+ cells express little to no levels of P2RY12 and TMEM119, two canonical microglial markers (data not shown). Ten-month WB irradiated mice treated with CSF1Ri exhibited 79–96% (mean = 86%) engraftment of GFP+ cells, seen throughout the brain parenchyma (Figure 2a, d, and h–j). In aged-matched controls, no GFP+ cell deposition is visible (Figure 2b, and h–j). Notably, we found that MAC2+ staining was still apparent in GFP+/IBA1+ cells, even 6 and 10 months after CNS infiltration was stimulated, while no MAC2 expression was seen in control animals or in GFP-/IBA1+ cells (Figure 2b–g, and h–j). In 10 mo WB irradiated mice, an average of 89–96% of GFP+ cells express MAC2 near the lateral ventricle/SVZ, MHb, and IC (Figure 2k–m). In 10 mo WB irradiated + CSF1Ri treated mice, an average of 85–93% of GFP+ cells express of MAC2 near the lateral ventricle/SVZ, MHb, and IC (Figure 2k–m). It should be noted that there are differential levels of MAC2+ staining in GFP+ cells in mice, which likely reflects the more recent infiltration of BM-derived cells into the parenchyma, indicating that MAC2 expression may gradually decrease over time as cells become more CNS parenchymal macrophage- or microglia-like to fill the tissue niche. Some MAC2 expression is seen in the nuclei of resident microglia, but clearly fills the cell body and processes of GFP+/IBA+ cells. Given the high level of co-expression of MAC2 in GFP BM-derived myeloid cells, these results indicate that MAC2 can serve as a histological marker of BM-derived infiltrating cells and utilized as a potential long-lasting marker to distinguish between peripherally derived monocytes/macrophages and resident microglia.
3.3 MAC2 is not a ubiquitous marker for plaque-associated microglia during the early stages of disease in 5xFAD mice
While we identified MAC2 as a marker for peripheral infiltrates, Lgals3 has also been reported in specific myeloid cell populations under certain conditions. For example, Lgals3 was identified as an upregulated gene in amyloid-β (Aβ) plaque-associated microglia, also known as disease-associated microglia (DAM) or microglial neurodegenerative (MGnD) phenotype (Butovsky & Weiner, 2018; Krasemann et al., 2017), and in isolated amyloid plaque-containing microglia (Grubman et al., 2021). Moreover, galectin-3/MAC2 staining has been found in microglia in close contact with Aβ plaques in both human and mice (Boza-Serrano et al., 2019). However, it is often difficult to distinguish between monocytes/macrophages and activated microglia, as they share many morphological and gene expression similarities (Bennett et al., 2016; Butovsky et al., 2014; Buttgereit et al., 2016; Keren-Shaul et al., 2017; Konishi et al., 2017). To directly test Lgals3/Galectin-3 expression in the AD brain, we stained for MAC2 in 5xFAD mice, and then used JHMV infection to trigger peripheral infiltration, evaluating whether MAC2 expression is specific to plaque-associated microglia.
5xFAD mice, which express five human APP and PSEN1 transgenes with familial Alzheimer's disease mutations, display extensive extracellular plaque deposition and microgliosis (Oakley et al., 2006). In these mice, amyloid plaques begin to form around 3 months of age and exhibit significant plaque deposition and microglial activation in the cerebral cortex and brain stem, including the thalamus, midbrain, and hindbrain, by 4 months of age (Figure 3a). Here, we i.c. infected 4-month-old 5xFAD mice with JHMV to stimulate monocyte infiltration into the CNS. Brain sections of uninfected and JHMV-infected mice were stained for amyloid plaques (Amylo-Glo), myeloid cells (IBA1), and MAC2. Evaluation of whole brain sagittal sections showed profound MAC2 staining in JHMV-infected 5xFAD (Figure 3b), but not uninfected mice (Figure 3a). Similar to WT JHMV-infected mice, MAC2+ cell deposition is apparent in areas near ventricles (in the cerebellum near the fourth ventricle, in tissue near the lateral ventricle) and white matter tracts (the corpus callosum, middle longitudinal fasciculus), whereas little to no MAC2 staining is present in 5xFAD controls (Figure 3a–e). MAC2+ cells are seen in the choroid plexus of 5xFAD controls, but do not infiltrate into the parenchyma (Figure 3c and e). High resolution images show little to no MAC2+ staining in plaque-associated microglia (1.6% of MAC2 staining in plaque-associated IBA1+ cells) in uninfected 5xFAD mice (Figure 3f–g), and an average of 16.4% of MAC2 staining in IBA1+ cells surrounding amyloid plaques in JHMV-infected 5xFAD mice (Figure 3h–i). It also appears that not all plaque-associated microglia are MAC2+ nor is there an abundance of MAC2+ IBA1+ in plaque-associated regions. MAC2+ staining is also present in non-plaque-associated regions in IBA1+ cells (8.7% MAC2+ IBA1+ staining) in JHMV-infected mice (Figure 3d, and h–i). These findings provide evidence that MAC2 is not a specific marker for plaque-associated microglia and is not expressed by microglia in the young non-infected 5xFAD mouse model, indicating that Lgals3/MAC2 expression may reflect peripheral infiltrates honing to plaques.

3.4 The effects of aging on MAC2 staining in WT and 5xFAD mice
Transcriptional profile analysis has revealed an upregulation of Lgals3 in microglia isolated from mouse models of neurodegenerative disease, including Alzheimer's disease and amyotrophic lateral sclerosis as well as aging, and identified Lgals3 as a hub gene for primed microglia (Holtman et al., 2015). Safaiyan et al. recently identified white matter-associated microglia (WAM), which accumulate in white matter tracts during aging. Lgals3 was one of 39 transcripts of the WAM signature that was identified when comparing aged white matter compared to young white matter or aged gray matter myeloid cells; and the authors report expression of galectin-3 in IBA1+ cells in old but not young white matter (Safaiyan et al., 2021).
To address whether MAC2 staining also increases with aging under steady-state and diseased conditions, we next stained brain sections from 4, 8, 12, and 18 mo WT and 5xFAD mice with MAC2, IBA1, and Amylo-Glo. Again, we observe that MAC2+ IBA1+ cells and staining is most apparent in the choroid plexus of WT and 5xFAD mice, regardless of age (Figure 4a and b). In line with previous studies, our data shows an age-dependent increase in MAC2+ IBA1+ cell accumulation in 5xFAD mice in the hippocampus, cortex, and in white matter areas (e.g. fimbria, corpus callosum) within close proximity to the lateral ventricle (Figure 4b, c, and e). In gray matter regions, the majority of MAC2+ cells are IBA1+ plaque-associated microglia (Figure 4b and c). However, there appears to be a lag in the appearance of MAC2 expression and microglial/DAM activation around plaques. For example, prominent MAC2 expression in plaque-associated IBA1+ cells appears at 18 mo of age in the cortex despite the accumulation of these plaque-associated microglia at 4 mo of age (Figure 4c). Furthermore, the majority of IBA1+ plaque-associated cells do not express MAC2 (<20% of IBA1+ cells are MAC2+; Figure 4e), meaning MAC2 does not account for a significant proportion of plaque-associated cells. MAC2+ IBA1+ cell deposition does not occur in gray matter areas in the aged WT mice (Figure 4a, d, and f); however, interestingly we do observe MAC2+ IBA1+ cells present in white matter areas at 18 mo of age (Figure 4d). This is also true for 5xFAD mice (Figure 4c). Thus, it appears that MAC2 expression is not a specific response to plaques. Given the proximity of these brain regions to the lateral ventricles and the lack of MAC2 expression in the majority of plaque-associated microglia, we postulate two scenarios: (1) a specific subpopulation of activated microglia (subset of DAM and/or WAM) switch on Lgals3 and galectin-3/MAC2 expression over time or (2) that MAC2+ cells derive from a different cell source, such as from the periphery. Since microglia and macrophages undergo rapid morphological and transcriptional transformations upon activation, reflective of the highly plastic nature of myeloid cells, defining MAC2 expression as an indicator of cell activation or peripheral infiltration remains difficult. However, given the findings in this study, specifically the spatial and temporal expression of MAC2+ IBA1+ cells in areas that are closely associated with peripheral immune cell infiltration in CNS disorders, most prominently in white matter areas in multiple sclerosis, we hypothesize that MAC2 expression labels a subset of peripheral immune cells in the young adult brain that can infiltrate and engraft the brain.

The effects of aging on MAC2 staining in WT and 5xFAD mice. Brains of wild type (WT) and 5xFAD mice at 4, 8, 12, and 18 months (mo) of age were evaluated for MAC2 staining in plaque-associated microglia. (a–b) Representative images of MAC2 (green), IBA1 (red, myeloid cells), and Amylo-Glo (blue, amyloid plaques) staining in brain sections of WT (a) and 5xFAD (b) mice. (c–d) Representative 20× confocal images of MAC2, IBA1, and Amylo-Glo staining in the cortex (CTX), hippocampus (HC), and lateral ventricle (LV)/fimbria (Fim) of WT (d) and 5xFAD (c) mice shows the age-dependent increase in MAC2 staining in 5xFAD mice. (e–f) Quantification of plaque-associated MAC2+ IBA1+ staining and MAC2+ IBA1+ cells in 5xFAD and WT mice, respectively. Female (pink) and male (blue) mice are indicated by color scheme. Data are represented as mean ± SEM (n = 3–5). ** p < .01, *** p < .001, compared to 4 mo. Scale bar in (c) ~60 μm
4 DISCUSSION
Microglia and BM-derived monocytes are implicated in a number of neurological disorders (Herz et al., 2017). In AD, several genome-wide association studies have identified variants associated with myeloid cells that increase disease risk, highlighting the importance of myeloid cells and the growing need to decipher their phenotype and function during disease (Bradshaw et al., 2013; Guerreiro et al., 2013; Jonsson et al., 2013; Lambert et al., 2013). However, myeloid cells are highly dynamic cells, which can be influenced at both the transcriptional and protein level by specific diseases during disease induction and progression, thus complicating the use of reliable and stable cell-specific markers and posing challenges to the functional exploration and contributions of these distinct cells. For instance, the presence of peripheral-derived myeloid cells around amyloid plaques and their contribution in AD pathology has been a long-standing question in the field with contrasting results (El Khoury et al., 2007; Hawkes & McLaurin, 2009; Jay et al., 2015; Reed-Geaghan et al., 2020; Simard et al., 2006).
Under steady state conditions, microglia and monocyte/macrophages populations express several overlapping surface markers, including Cd11b, F4/80, CD115 (CSF1R), and IBA1 (Gautier et al., 2012; Prinz et al., 2011). Recent gene expression studies have identified surface markers and transcription factors unique to resident microglia (e.g., P2RY12, TMEM119, SIGLEC-H, and Sall1), but several of these markers lose their distinct homeostatic expression levels during disease/cell activation (Bennett et al., 2016; Butovsky et al., 2014; Buttgereit et al., 2016; Chen & Colonna, 2021; Keren-Shaul et al., 2017; Konishi et al., 2017). Despite the utility of previous approaches (e.g., BM chimeras, parabiosis, and mouse models of fluorescent protein expression or tamoxifen-inducible Cre-recombinase under monocyte/microglia promoters) in providing myeloid cell-specific labeling/targeting and unprecedented opportunities to study microglia and monocytes (Ajami et al., 2007; Jung et al., 2000; Mildner et al., 2007; Wang et al., 2016), the field has lacked a commercially available histological marker for monocyte-derived populations in the CNS.
In this study, our main goal was to identify a marker that can discern between murine microglial and monocyte-derived cell populations during inflammation and disease in the CNS. Given the plasticity of myeloid cells, we recognize that the identification of cell lineage based on a single marker is not ideal (Bennett et al., 2016; Butovsky et al., 2014); however, previous studies have identified unique single genes and markers for microglia, such as P2ry12 and Tmem119, that have aided investigations and added to the repertoire of tools utilized by CNS myeloid cell researchers (Bennett et al., 2016; Butovsky et al., 2014). These markers have been indispensable to identifying endogenous and homeostatic microglia in the CNS. Here, we show that Lgals3 is highly expressed in monocyte/macrophages in the healthy and JHMV-infected brain, and that galectin-3/MAC2 can be used as a histological marker to distinguish peripherally derived myeloid cells from microglia under both steady state and neuroinflammatory conditions. Galectin-3/MAC2 is a β-galactoside-binding lectin that is highly expressed in and secreted by monocytes/macrophages; it is associated with many macrophage functions, including cell adhesion, migration, proliferation, and apoptosis (MacKinnon et al., 2008). However, galectin-3 expression has also been reported in other cell populations, including fibroblasts, osteoblasts, endothelial cells, neuronal cells, and immune cells (neutrophils, eosinophils, basophils, mast cells) (Thomas & Pasquini, 2018). Here, we show that Lgals3 is not highly expressed in other Cd11b+ cell populations via scRNAseq, including T cells, B cells, NK cells, neutrophils, and microglia, but is highly expressed in several monocyte and macrophage cell clusters. Although we do not observe significant MAC2+ staining in non-IBA1+ cells in the CNS, careful consideration here is also warranted and IBA1 (or other myeloid cell markers) should be employed in combination with MAC2 to distinguish these myeloid populations.
In line with our study, recent work by Ochocka et al. using scRNAseq and flow cytometry of CD11b+ myeloid cells in naïve and glioma-bearing mice showed that Lgals3 and galectin-3 are highly expressed by infiltrating monocyte/macrophages at RNA and protein levels, respectively (Ochocka et al., 2021). These authors propose the use of TMEM119 and galectin-3 for efficient and distinguishable separation of microglia and monocyte/macrophages in glioma models and highlighted their ability to achieve distinct spatial distribution of these cells within tumor tissue (Ochocka et al., 2021). Moreover, recent studies in mouse models of diabetes and spinal cord injury have identified unique populations of infiltrating and phagocytic macrophages, distinct from resident microglia, that express Lgals3/galectin-3/MAC2. In diabetes, galactin-3 expressing macrophages infiltrate and aggregate near injury sites, implicating these cells in the response to cerebrovascular insults (Mehina et al., 2021). In spinal cord injury, injury-activated macrophages maintain a transcriptionally distinct identify to activated microglia, expressing higher levels of Lgals3, Apoe, and Cxcr4, among other genes (Wahane et al., 2021). In the present study, we also observed distinct spatial distribution of MAC2+ cells in the JHMV-infected brain; cells were sequestered in the brain stem, white matter areas, and regions surrounding the ventricles. Further study is needed to evaluate the distinct contributions of MAC2+ myeloid cells and MAC2- myeloid cells in pathogenesis, but given the role of BM-derived myeloid cells in demyelination (Yamasaki et al., 2014), it is not surprising to find their selective recruitment in these areas. In GFP BM chimeras, MAC2+ cells were observed in the choroid plexus and perivascular spaces in whole body-irradiated mice, respectively, consistent with their partial cell turnover from BM sources (Goldmann et al., 2016; Van Hove et al., 2019). Identifying MAC2 as a distinct histological marker for monocytes provides investigators with the ability to explore the spatial distribution and dynamics of these peripheral cells without the side effects of irradiation or other experimental caveats (e.g., tamoxifen).
In mice, monocytes express CD11b and CD45, and are divided into two main subpopulations: classical/inflammatory monocytes (Ly6ChiCCR2 + CX3CR1lo) and non-classical/patrolling monocytes (Ly6CloCCR2lo CX3CR1hi) (Geissmann et al., 2003; Geissmann et al., 2010). Of interest, studies have shown that Lgals3 is enriched in a population of Ly6C+ monocytes located in the BM and blood (Mildner et al., 2017). Although transcriptional profile analyses of microglia and monocytes have generated several proposed monocyte-specific markers based off of an identified monocyte signature, including Apoe, Ccr2, Ms4a7, and Clec12a (Bennett et al., 2018; Cronk et al., 2018; Hohsfield et al., 2020; Lund et al., 2018; Anat Shemer et al., 2018) these markers have presented a number of limitations: upregulation during disease, downregulation upon macrophage differentiation, or lack of success in staining fixed adult brain tissue. For example, though Cd11a (Itgal) is expressed on all peripheral circulating immune cells and not microglia, it could only be detected on infiltrating cells in fixed brain sections using a tedious tyramide amplification strategy, limiting its practical use (Shukla et al., 2019). In addition, Bennett et al. identified MS4A7 as a unique marker for HSC-derived cells, but MS4A7 staining was only shown in blood, fetal brain, and primary human microglia, and RNA in situ hybridization was required to show staining in postmortem AD brain samples (Bennett et al., 2018). CD44 was a marker identified for distinguishing CNS infiltrating from CNS resident cells by Korin et al., however, later found by Mrdjen et al. to be upregulated in microglia during disease or aging (Korin et al., 2017; Mrdjen et al., 2018). Given that monocytes and macrophages exist as heterogenous populations with varying expression profiles (reflecting functional diversity, differential origins, differentiation status, tissue of residence) and dynamic adaption of their transcription regulatory networks to changing environments (Gosselin et al., 2014; Lavin et al., 2014), it has been challenging for researchers to develop a marker for monocyte-derived cells that remains intact following differentiation and tissue engraftment. Here, we show that MAC2 staining is retained in BM-derived cells 6–10 months following CNS recruitment in the brain, indicating that MAC2 may be a marker that is conserved across several monocyte and macrophages subpopulations, or at least the subsets recruited to the CNS/sites of inflammation.
Transcriptional profile analysis of isolated microglia from mouse models of AD, amyotrophic lateral sclerosis, and aging identified Lgals3 as a central hub gene in primed microglia, along with Apoe, Axl, Clec7a, and Itgax (Holtman et al., 2015). Further comprehensive scRNAseq analysis of microglia in neurodegenerative diseases discovered a unique microglial subset, termed disease-associated microglia (DAM) or microglial neurodegenerative phenotype (MGnD) microglia. These cells exhibit a downregulation in homeostatic microglia genes (e.g., P2ry12 and Tmem119) and upregulation in genes involved in phagocytic, lysosomal, and lipid metabolism pathways (e.g., Apoe, Axl, Clec7a, Cst7, Itgax, and Lilrb4) (Keren-Shaul et al., 2017), including Lgals3 (Butovsky & Weiner, 2018; Krasemann et al., 2017), which is upregulated during later stages of neurodegeneration (Chen & Colonna, 2021). However, a recent study has shown that enzymatic dissociation methods can induce aberrant gene expression signatures in microglia (Marsh et al., 2020), indicating that some scRNAseq findings may be confounded and an artifact of isolation methods, analysis, or sequencing platform. A recent investigation utilizing scRNAseq, snRNAseq and scATACseq identified distinct microglia subpopulations in 3xTgAD and 5xFAD mice, including a DAM cluster containing Cst7, but lacking Lgals3; instead, Lgals3 was found in a small cluster containing Cd14 and Itgal (Balderrama-Gutierrez et al., 2021). Galectin-3 was also shown to be significantly elevated in human AD patients, exhibit preferential expression in microglia in contact with plaques, and serve as a ligand for TREM2 (Boza-Serrano et al., 2019). In contrast, Sobue et al. showed that gene expression levels of LGALS3, AIF1, and CD68, were unchanged in human AD precuneus samples (Sobue et al., 2021). In line with this, using bulk-tissue RNAseq analysis, our lab has shown that while Lgals3 is upregulated in 5xFAD mice in the hippocampus and thalamus compared to wild types, expression levels do not change following sustained microglial depletion, unlike several homeostatic (e.g., Csf1r, Cx4cr1, Hexb, and Siglech) and DAM genes (e.g., Clec7a, Cst7, and Itgax) which are significantly downregulated by microglial depletion (Spangenberg et al., 2019). These data provide evidence that elevated Lgals3 in 5xFAD brains may not be specific to microglia. Consistent with spatial transcriptomics and in situ sequencing data in APPNL-G-F mice, Lgals3 was not identified in plaque-induced genes (PIGs), consisting of 57 genes that overlap with several DAM genes (Chen, Lu, et al., 2020). The current study shows that MAC2 staining is not present in plaque-associated microglia in the young 5xFAD mice, and only appears in plaque-associated IBA1+ cells during JHMV infection or in aged animals (albeit at modest numbers). A recent study—showing clonal hematopoiesis of indeterminate potential (CHIP) is associated with protection against AD—detected mutated marrow-derived cells in the brains of patients which appear indistinguishable from microglia (Bouzid et al., 2021), highlighting the potential role for peripheral infiltrates in replacing defective microglia during aging or disease. Thus, the presence of MAC2+ cells in disease and experimental models should be considered a potential sign of peripheral infiltrates, and subsequently followed up with BM chimeric models, parabiosis, or BM lineage tracing transgenics. It is possible that microglia may upregulate Lgals3 under certain conditions, including infection or inflammatory stimulus, or that upregulated mRNA does not effectively translate to protein expression. Likewise, we cannot discount the possibility that microglia in other conditions (stroke, injury, and chronic neurodegenerative disease) may also upregulate Lgals3, or that these MAC2+ cells may derive from BM sources. Other explanations for the disparity between Lgals3 transcript levels and MAC2 staining in plaque-associated microglia could be a result of: (1) microglia and infiltrating peripheral myeloid cells expressing different isoforms of Lgals3/galectin-3, in which one isoform is detectible by the MAC2 antibody while the other is not, or (2) different secretion and/or cellular retention rates of Lgals3/galectin-3 within these two myeloid cell populations. Moreover, Lgals3 may also be expressed by discrete microglial populations in the brain–for example, in specialized axon tract-associated microglia (ATM) or P7/early postnatal microglia (termed proliferative region-associated microglia (PAM), which appear as amoeboid cells that transiently reside in axon tracts of the corpus callosum and cerebellum (Hammond et al., 2019; Li et al., 2019), as well as in white matter-associated microglia (WAM), found specifically in white matter areas that increase with aging (Safaiyan et al., 2021). Furthermore, surviving microglia following CSF1Ri-induced depletion have been described as MAC2+ (Zhan et al., 2020). Given these findings and the data from this current study, we would implore researchers to consider Lgals3/MAC2 expression as a potential indicator of peripheral origins, but encourage further validation with other important tools, such as fate-mapping techniques. For example, lineage tracing from Ms4a3 or Cxcr4 could be utilized, as it has recently been shown as a specific gene expressed by BM-derived granulocyte-monocyte progenitors (GMPs) or HSC-derived monocytes, respectively, to efficiently trace monocyte-derived cells (Liu et al., 2019; Werner et al., 2020). Other markers include Cd49d, also expressed by T cells and DCs, and Cd49e, which were identified in peripheral monocyte populations, but not in CNS resident myeloid cell populations utilizing CyTOF (Bahareh Ajami et al., 2018).
In sum, we identify galectin-3/MAC2 as a potential monocyte marker that can be utilized in inflamed CNS tissue. Unlike other markers, BM-derived myeloid cells retain MAC2 expression even as they leave perivascular areas and occupy the parenchymal niche for prolonged periods of time. The ability to discern peripherally derived cells from resident microglia is critical to exploring their distinct roles in health and disease. Growing attention has been placed on understanding CNS myeloid cells and the environmental cues that sculpt their transcriptional and phenotypic profiles, particularly during disease. Detailed knowledge of these distinct myeloid cell populations and our ability to distinguish microglia and monocytes will prove essential in targeting these cells for improved therapeutic strategies.
ACKNOWLEDGMENTS
We thank Edna Hingco for her excellent technical assistance. WT and 5xFAD time course tissue was provided by U54 AG054349 (NIA Model Organism Development and Evaluation for Late onset Alzheimer's Disease [MODEL-AD]). K.N.G was supported by the National Institutes of Health (NIH) under awards: R01NS083801 (NINDS), RF1AG056768 (NIA), and RF1AG065329 (NIA). L.A.H. was supported by the Alzheimer's Association Research Fellowship (AARF-16-442762). T.E.L. was supported by the National Institutes of Health (NIH) under awards: R01NS041249 (NINDS) and R35NS116835 (NINDS), the National Multiple Sclerosis Society (NMSS) Collaborative Research Center grant CA-1607-25040 and The Ray and Tye Noorda Foundation. Y.G. was supported by NIH T32 training grant (NS082174).
CONFLICT OF INTEREST
The authors declare that they have no conflicts of interest.
AUTHOR CONTRIBUTIONS
L.A.H. developed experimental protocols, designed, performed, and analyzed experiments and wrote the manuscript. K.I.T., Y.G., A.R.S., S.J.K., Y.C. and S.F. performed, and analyzed experiments. M.A.I. and T.E.L. contributed to project design. K.N.G directed the project, designed the experiments, interpreted the results and wrote the manuscript.
Open Research
DATA AVAILABILITY STATEMENT
The data that support the findings of this study are available from TEL and KNG upon reasonable request.