Wind regimes and aeolian geomorphology in the western and southwestern Tengger Desert, NW China
Abstract
Wind is the primary control on the formation of aeolian geomorphology. In this study, we combined wind regime data from automated weather stations in the western and southwestern Tengger Desert of the Inner Mongolia region in China with remote-sensing data to analyse the relationship between the wind energy environment and aeolian geomorphology. Tengger Desert is one of the main dust storm sources in northwestern China. Therefore, efforts aimed at controlling desertification and dust storm require a deeper understanding of the processes that govern the formation and subsequent evolution of dunes in this area. Wind speed was largest in the northwest (3.3 m/s in the Xiqu station) and smallest in the southeast (1.2 m/s in the Haizitan station). Potential sand transport was also largest in the northwest (195 in the Jiahe station) and smallest in the southeast (33 in the Tumen station). The sand-driving wind (5.92 m/s) directions were from the NW and SE quadrant across the study area, at >76% of all sand-driving wind, reaching 99% in the Tumen station. The sand-driving wind in the NW quadrant reached >48%, and in the SE quadrant, >12% of all sand-driving wind in all stations. In the study area, sand dunes included crescent, dune networks, transverse, and coppice dunes. Dune crest directions had similar trends from upwind to downwind, at 133° in the middle region, and 124° in the southwestern region. Mean dune spacing changed with dune patterns; the maximum spacing for crescent dunes was 147 m, for dune networks 118 m, and for transverse dunes it was 77 m. The mean crest length was 124 m (maximum) for crescent dunes in the northwest, 121 m for transverse dunes, and 84 m for dune networks. However, because of gullies in the southern region, the mean crest length was only 58 m (least) for the crescent dunes in that area. The defect density ranged from 0.007 to 0.014. The spatial differences in dune patterns reflected the evolution of the dune field, where older dunes had been formed upwind and younger downwind. Copyright © 2014 John Wiley & Sons, Ltd.
1 Introduction
The spatial pattern of aeolian dunes depends on the history of wind regimes and sand availability (Reffet et al., 2010). Aeolian dune patterns can be described according to dune external morphology (morphological classification) and to formative winds or sediment supply (morphodynamic classification) (Lancaster, 1995). In morphological classification, dunes are classified by their shape and the number of slip faces, and thus include crescent, transverse, linear, reversing, and star dunes (McKee, 1979; Cooke et al., 1993; Lancaster, 1995; Livingstone and Warren, 1996; Thomas, 1997). In morphodynamic classification, dunes are classified according to the orientation of the dune crest relative to the dominant or resultant direction of sand transport; thus, dunes may be transverse, longitudinal, or oblique (Hunter et al., 1983; Rubin and Hunter, 1987; Rubin and Ikeda, 1990; Lancaster, 1995; Werner, 1995; Reffet et al., 2010). Wind regime encompasses wind directional variability and wind strength or speed. The wind regime of a region is the main force responsible for the dune field pattern. The relationships between the regional wind regime and general dune form have been comprehensively investigated in the field (Breed and Grow, 1979; Fryberger and Dean, 1979; Wasson and Hyde, 1983; Rubin and Hunter, 1987; Zhang et al., 2010a, b), and in experimental scale (Rubin and Ikeda, 1990; Reffet et al., 2010), and via numerical simulations (Werner, 1995; Parteli et al., 2009). The methods developed in these prior studies have been used subsequently to examine possible regional-scale changes in dune morphology to understand changes in regional wind regimes (e.g. Lancaster, 1981; Thomas, 1984; Bullard et al., 1996; Wang et al., 2005). Wind energy environment (the wind's drift potential (DP) and directional variability (RDP/DP, where RDP is the resultant drift potential)), which calculates an index of sand transport intensity, has also been applied in studies of dune patterns around the world (Fryberger and Dean, 1979; Bullard et al., 1996; Hereher, 2010). Dune patterns differ among wind regimes, with narrow unimodal wind environments leading to transverse dunes, bimodal ones leading to linear dunes, and complex ones leading to star dunes (Fryberger and Dean, 1979; Wasson and Hyde, 1983). Directional variability decreases from crescent to star dunes (crescent dunes form in less directionally-variable wind regimes than star dunes do) (Fryberger and Dean, 1979).
In addition to the wind regime, sediment supply is an important factor in the formation of dune patterns (Wasson and Hyde, 1983; Livingstone and Warren, 1996; Lancaster, 2009). Dune networks and transverse dunes form in areas with an abundant sediment supply, whereas crescent dunes form in areas with a smaller sediment supply. Rubin and Hunter (1987) hypothesized that dunes were oriented so as to maximize sand transport perpendicular to the crest line; however, because of the limitations of the hypothesis (Fenton et al., 2014), only a few researchers used this approach (Rubin and Ikeda, 1990; Werner, 1995; Kocurek and Ewing, 2005; Parteli et al., 2009; Reffet et al., 2010; Fenton et al., 2014).
Dune networks are sometimes called ‘reticulate dunes’, ‘dune reticules’, ‘aklés’, ‘rhombic waffle patterns’, or ‘alveolar dunes’ (Cook et al., 1993). They are one of the general dune types (Cook et al., 1993; Livingstone and Warren, 1996; Hasi et al., 1999; Ewing et al., 2009), and are characterized by network patterns. In contrast to other major dunes, such as transverse (Howard et al., 1978), linear (Tsoar, 1983; Livingstone, 1986), and star dunes (Lancaster, 1989), whose formation mechanisms and evolution are well known, the formation and evolution of dune networks has received relatively little research (e.g. Warren and Kay, 1987; Cook et al., 1993; Hasi et al., 1999). As a result, many unanswered questions remain about these dunes. The Tengger Desert of China is synonymous with dune networks for Chinese aeolian scientists (Hasi et al., 1999). However, the wind energy environment has not been described, nor has its relationship to the spatial variation of the dune pattern been analysed.
The goals of the present study were to analyse the wind energy environment in the southern and southwestern Tengger Desert, and to discuss the relationships between dune morphology, the wind regime, and the wind energy environment in these areas. The results of this study provide useful reference data about the intensity of regional aeolian activity, and support studies of regional aeolian geomorphology.
2 Materials and Methods
2.1 Study area
The Tengger Desert is the fourth-largest desert in China, and covers an area of about 42 320 km2 (Wang et al., 2005). The desert is bounded by the Qilian Mountains to the southwest, the Yabulai Mountains to the northwest, and the Helan Mountains to the east. The desert has developed in the Shiyang River Basin and the western-most area of the desert is connected to this basin (Fig. 1). The Tengger Desert formed at least 1.8 Ma BP (Yang et al., 2006). Since the Late Quaternary, 40 ka BP, the desert area was a huge and continuous palaeolake (Megalake Tengger). Due to climate change, the lake water levels were not constant, but rather fluctuated on different time scales. The water level declined and the Megalake Tengger finally desiccated at 18 ka BP (Zhang et al., 2002; Wang et al., 2011) and, since 5.2 ka BP, the desert environment has been similar to the modern one (Qiang et al., 2000). Aeolian dunes have developed on the sediments that originated mainly from the Shiyang River Basin, and have been subsequently reworked by winds primarily from the northwest. The mean particle size in dune sediments averaged 0.25 mm in the whole desert, and the mean particle size decreased from the northwest to the southeast. In the desert, about 67.2% of the land is covered by mobile dunes, and semi-fixed and fixed dunes account for about 17.4 and 15.4%, respectively. Spatial variation in dune geomorphology is pronounced. Dune patterns are mainly networks and crescent dunes. Dune height ranges between 10 and 20 m (Wu, 2009). The southern region of the desert contains many gullies. Sparse and unevenly-distributed vegetation includes Artemisia desertorum, Artemisia salsoloides Willd, Nitraria Tanggutorum Bobr, Agriophyllum arenarium Bieb (Wu, 2009).
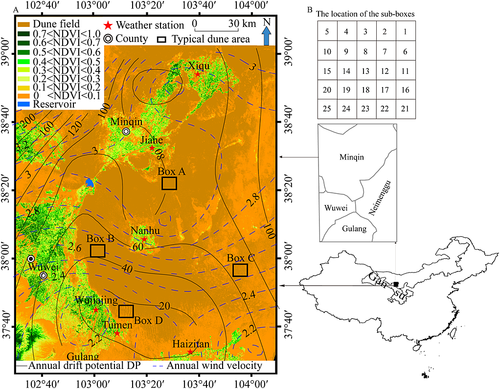
Climatically, the area is situated at the convergence of the arid and hyper-arid northwest, the arid-semiarid southeast, and the cold, high, mountain–plateau regions in the southwest. The strong seasonal influence of the East Asian Monsoon, coupled with the meandering Westerly-Jetstream results in concentrated rainfall during the summer months. Cold and dry air masses originating in the Siberian–Mongolian High Pressure cell generally prevail during the winter.
The study area includes the plateau area of Minqin County, Wuwei City, Gulang County and Nanhu Oasis (Fig. 1). Average annual rainfall increases from 110 mm near Minqin to 160 mm near Wuwei, and reaches a maximum of 360 mm near Gulang. Annual temperature averages 8.4, 8.1, and 5.4 °C near Minqin, Wuwei, and Gulang, respectively. Wind speed averages 2.6, 1.7, and 3.3 m/s near Minqin, Wuwei, and Gulang, respectively. Annual relative humidity averages 44, 51, and 51% in Minqin, Wuwei, and Gulang, respectively (Table 1).
| Meteorology station | Rainfall (mm) | Temperature (°C) | Humidity (%) | Wind speed (m/s) |
|---|---|---|---|---|
| Minqin | 110 | 8.4 | 44 | 2.6 |
| Wuwei | 160 | 8.1 | 51 | 1.7 |
| Gulang | 360 | 5.4 | 51 | 3.3 |
The study area lies in the downstream reaches of the Shiyang River Basin. In this area, sensitive ecological environment underwent severe desertification caused by changes in the natural environment and anthropogenic disturbance. The results have attracted considerable attention in China, and research has indicated that the Minqin area is one of the main dust storm sources in northwestern China (Man, 2010). Therefore, efforts aimed at controlling desertification require a deeper understanding of the processes that govern the formation and subsequent evolution of dunes in this area.
2.2 Methods
Wind data were obtained from automated weather stations at six locations in the Tengger desert: at Xiqu, Jiahe, Nanhu, Wujiajing, Tumen, and Haizitan (Fig. 1). The data were acquired at 10-min intervals for 24 h daily in the year 2010, in an open area at 10 m above the land surface.
 (1)
(1) (2)
(2) (3)
(3) (4)
(4) (5)
(5)| DP (vector units) | Wind energy environment | RDP/DP | Directional variability | Probability directional category |
|---|---|---|---|---|
| <200 | Low | <0.3 | High | Complex or obtuse bimodal |
| 200 to 400 | Intermediate | 0.3 to 0.8 | Intermediate | Obtuse or acute bimodal |
| >400 | High | >0.8 | Low | Wide or narrow unimodal |
- DP, drift potential; RDP, resultant drift potential.
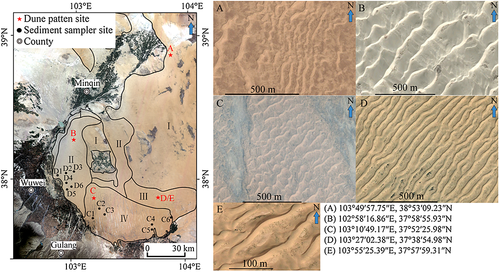
Sediment samples were collected in May, 2013. A total of 64 samples were collected in 12 sample sites (Fig. 2, D1 to D6 and C1 to C6), including dune windward slope, crest ridge, and leeward slope. Particle size distribution was analysed using a Malvern MasterSizer 2000 (Malvern, England), which operates in the range of 0.02 to 2000 µm. In this paper, particle size is expressed by phi (Φ) values, where Φ = −log2 d, where d is the grain diameter in millimetres. Sediment parameters were analysed based on the Udden–Wentworth grade scale (Udden, 1914; Wentworth, 1922).
 (6)
(6)Dune pattern parameters, including dune crest length, crest orientation, and dune spacing, were calculated in GIS software using Google Earth's high-resolution images. Dune crestlines were visually identified on the images and traced manually. To determine dune spacing, crest length, crest orientation, and defect density, three typical dune patterns (crescent, transverse, and dune networks) were selected and oriented from the upwind to the downwind margin of the dune field (Fig. 1a). We delineated 4 box transects, A, B, C, and D. Each box transect is 10 km × 10 km, which is located in the northern, eastern, southwestern and western areas of the study region (Fig. 1a). With each box transect, we located twenty-five 2 km × 2 km sub-boxes, each sub-box were joined (Fig. 1b). At each sub-box level, we measured the crest length, crest orientation, dune spacing and defect density. These data were averaged in GIS software and here we report averages per transect sub-box. Average spacing between crestlines was calculated following the methods of Ewing and Kocurek (2010b). Defect density was calculated following the methods of Werner and Kocurek (1999) and Ewing et al. (2006).
3 Results
3.1 Vegetation cover
Vegetation cover influences the development of dune fields and sand seas. Vegetation cover was greater in the middle and outside of our study area than elsewhere (Fig. 1). Vegetation cover was also greater in the northwest and the south of the study area, and at the Nanhu Oasis (NDVI value usually larger than 0.1). At the Nanhu Oasis, vegetation cover decreased from the middle region (NDVI larger than 0.5) to the outside (NDVI smaller than 0.1). In the southern part of the study area, dune fields and vegetation cover were discontinuously distributed in some places, with NDVIs between 0 and 0.1.
3.2 Regional wind regimes
Not all winds are strong enough to transport sand; we analysed only the sand-driving wind, defined as wind with speeds >5.92 m/s. Within that (Tables 3 and 4, and Fig. 1), we identified the primary (highest percentage of occurrence) and secondary (second highest frequency of occurrence) wind directions. The primary wind direction was generally the same throughout the study area (i.e. from the NW quadrant), but the secondary wind direction was SE in the northern and middle parts of the study area and at Tumen, whereas in the southern part, the SE component was small. In the study area, the primary wind direction and potential sand transport are from the NW quadrant and from the NW to the SE quadrant in spring, summer, and winter (Supplemental Figure S1, Fig. 3). At Xiqu, Tumen, and Jiahe, these were WNW and NW, respectively, for primary and secondary wind directions. At Nanhu and Haizitan, the primary and secondary wind directions were NW and WNW. At Wujiajing, the primary and secondary wind directions were NNW and NW. Throughout the study area, the most common wind direction was therefore from the NW quadrant; the percentage of total wind from the NW quadrant was >48%, and reached a maximum of 84%. Meanwhile, other wind directions, for example, from the SE quadrant, made up about 12% to 29% of the total wind (Supplemental Figure S1).
| Frequency (%) at station | ||||||
|---|---|---|---|---|---|---|
| Wind direction | Xiqu | Jiahe | Nanhu | Wujiajing | Tumen | Haizitan |
| NNE | 1.56 | 0.96 | 1.13 | 1.35 | 0.00 | 0.81 |
| NE | 0.93 | 0.48 | 0.41 | 0.00 | 0.00 | 1.01 |
| ENE | 0.78 | 1.76 | 1.24 | 0.68 | 0.00 | 3.23 |
| E | 2.41 | 5.13 | 6.08 | 2.36 | 18.18 | 4.64 |
| ESE | 8.40 | 13.70 | 12.78 | 4.05 | 18.18 | 3.02 |
| SE | 10.96 | 8.65 | 7.01 | 4.05 | 9.09 | 1.21 |
| SSE | 1.87 | 1.04 | 0.41 | 1.35 | 0.00 | 3.63 |
| S | 0.39 | 0.08 | 0.10 | 0.00 | 0.00 | 4.03 |
| SSW | 0.16 | 0.16 | 0.00 | 1.35 | 0.00 | 1.21 |
| SW | 0.23 | 7.85 | 0.41 | 0.68 | 0.00 | 0.20 |
| WSW | 0.86 | 12.42 | 1.65 | 0.34 | 0.00 | 0.81 |
| W | 8.55 | 5.85 | 4.02 | 2.03 | 0.00 | 9.88 |
| WNW | 29.08 | 24.04 | 18.66 | 4.05 | 18.18 | 26.61 |
| NW | 20.92 | 13.78 | 28.14 | 31.42 | 36.36 | 26.81 |
| NNW | 8.71 | 2.16 | 15.98 | 37.50 | 0.00 | 10.89 |
| N | 4.20 | 1.92 | 1.96 | 8.78 | 0.00 | 2.02 |
| Wind speed (m/s) at station | ||||||
|---|---|---|---|---|---|---|
| Xiqu | Jiahe | Nanhu | Wujiajing | Tumen | Haizitan | |
| Average | 3.31 | 3.29 | 3.14 | 2.24 | 2.34 | 1.22 |
| Maximum | 20.2 | 20.4 | 18.6 | 16.1 | 17.3 | 7.1 |
| Averaged sand-driving wind | 7.95 | 8.20 | 8.08 | 7.95 | 6.40 | 7.51 |
| Ratio* | 13.01 | 12.79 | 9.75 | 2.76 | 0.09 | 4.73 |
- * Ratio, the ratio of the sand-driving wind speed to the total wind speed.
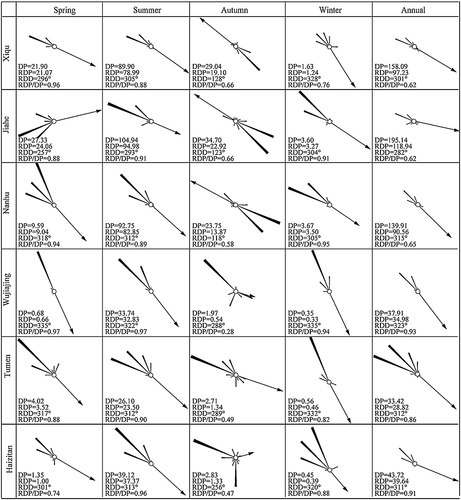
The study area was also divided into two regions based on annual data: from Xiqu to Nanhu, the primary wind directions were from the NW and SE, whereas at Tumen, Wujiajing, and Haizitan, the primary wind direction was from the NW, with the SE component greatly diminished.
Wind direction differed across stations and seasons (Supplemental Figure S1). In spring, the percentage of total wind in the primary and secondary wind directions was >60%. In summer, the primary and secondary wind directions were also from the NW quadrant at most stations, but their percentage (of total wind) decreased to 50%. In autumn, the primary and secondary wind directions changed and were from the SE quadrant in the northern and middle stations (Xiqu, Jiahe, Nanhu and Wujiajing); the percentage of total wind in the primary and secondary wind directions was >56%, however, in the other two stations (Tumen and Haizitan), the primary and secondary wind directions were from the NW quadrant and their combined percentage was 40 and 32%, respectively for Tumen and Haizitan. In winter, the primary and secondary wind directions were from the NW quadrant in all stations, and their percentage of the total was about 45% at Xiqu and Haizitan, but reached >60% at other stations.
The annual mean wind speed was greatest in the north, with the largest value at Xiqu (3.31 m/s), and decreased towards the south, with the smallest value (1.22 m/s) at Haizitan (Table 4, Fig. 1). The maximum wind speed followed a similar pattern, although the highest value was at Jiahe and the smallest at Tumen, probably as a result of more vegetation at Tumen than at other stations. Mean wind speed > 3 m/s was considered high, while lower wind speeds were considered low. We divided the study area on the basis of this mean wind speed grouping: high from Xiqu to Nanhu, and low from Wujiajing south. The averaged sand-driving wind speed was largest at Jiahe (8.20 m/s), and decreased toward the south, with the smallest value (6.4 m/s) at Tumen. The ratio of the sand-driving wind to the total wind was largest at the Xiqu (13%) and decresed to 0.1% at Tumen (Table 4).
3.3 Regional wind energy environments
The annual wind energy environment was classified as low, according to the criteria in Table 1. The wind energy environment can be divided into two regions: the northern and middle, and the southern (Fig. 1). In the northern and middle parts of the study area, DP was larger than in the southern part. The largest DP (195.1) was at Jiahe. The smallest (33.4) was at Tumen.
In the northern and middle parts of the study area, the RDD was consistently toward the SE quadrant (ranging from 282 to 315°), which meant that sand transport occurred from the NW to the SE; in the southern part, the RDD was also consistently toward the SE quadrant (ranging from 311 to 323°) direction. Based on the criteria in Table 1, directional variability in the study area was intermediate in the northern part of the study area, indicating an obtuse or acute bimodal wind regime, but was low in the southern part, indicating a wide or narrow unimodal wind regime.
Seasonal wind energy differed across the six stations (Fig. 3); in the northern and middle parts, DP was largest in the summer and autumn, and smallest in winter; in the southern parts, the largest was in summer, with the second largest in autumn at Wujiajing and Haizitan, but in spring at Tumen, and smallest in winter. The RDD was also different at different stations; in the northern and middle parts, the RDD was consistently toward the SE quadrant in spring, summer, and winter, but it was toward the NW quadrant in autumn. In the southern parts, the RDD was consistently toward the SE quadrant in spring, summer, and winter; however, in autumn, the RDD was toward the SE quadrant at Wujiajing and Tumen, and toward the NE quadrant at Haizitan. Directional variability (RDP/DP) was low in spring, summer, and winter at all stations, except in winter at Xiqu and in spring at Haizitan; in autumn, directional variability was intermediate at all stations.
3.4 Aeolian sediment
Sediment particle size distribution is important for the development of aeolian geomorphology, and hence needs to be determined in a study of regional aeolian geomorphology. Mean grain size of surface sediments in the Tengger Desert varied between 2.0 ϕ and 3.4 ϕ (0.14 to 0.22 mm), averaging 2.5 ϕ (0.18 mm). There were no significant differences in the mean grain size in the study area. However, with an increase in distance from the oasis to the sampling site (such as from D1 to D2 and D3), the mean grain size became finer; this indicated that aeolian sediment transport was controlled by wind and there was no relationship between mean grain size and dune type. Sediment grains were sorted well to very well, with a phi sorting index of 0.27 to 0.41 (Table 5). Skewness was nearly symmetrical to positively-skewed, with values of −0.07 to 0.27. Kurtosis was mesokurtic to leptokurtic, with values of 0.95 to 1.48. Sediment supply for the Tengger Desert was mainly from the weathering and erosion of the Qilian Mountains to the south, and alluvial–proluvial sediment material in the Shiyang River Basin to the west. Regional differences in sediments were further promoted by the prevailing winds and the local air flow circulation caused by the mountains; this led to the differential sorting and transport of sediments.
| Dunes parameters | D1 | D2 | D3 | D4 | D5 | D6 | C1 | C2 | C3 | C4 | C5 | C6 |
|---|---|---|---|---|---|---|---|---|---|---|---|---|
| Mz/Φ | 2.32 | 2.37 | 2.81 | 2.36 | 2.48 | 2.31 | 2.28 | 2.37 | 2.33 | 2.43 | 2.22 | 2.19 |
| σI | 0.36 | 0.27 | 0.41 | 0.29 | 0.24 | 0.30 | 0.33 | 0.37 | 0.27 | 0.31 | 0.28 | 0.32 |
| SkI | 0.01 | 0.10 | −0.02 | 0.07 | 0.12 | 0.07 | −0.07 | 0.23 | 0.08 | 0.27 | 0.06 | 0.01 |
| KG | 1.34 | 1.12 | 1.00 | 0.97 | 1.07 | 1.19 | 1.02 | 1.25 | 0.95 | 1.23 | 1.48 | 1.19 |
| Mz/mm | 0.19 | 0.19 | 0.14 | 0.19 | 0.18 | 0.20 | 0.21 | 0.19 | 0.20 | 0.19 | 0.21 | 0.22 |
- D1–D6, dune networks; C1–C6, crescent dune.
3.5 Dune patterns and parameters
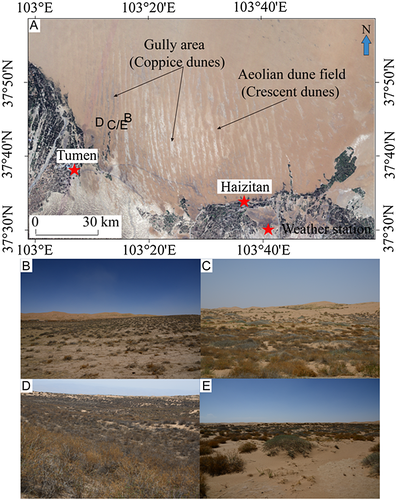
Typical dune patterns in our study area included crescent dunes (Fig. 2A), and dune networks (Fig. 2B), coppice (Fig. 2C), and transverse dunes (Fig. 2D, E). Dune networks were found in the western part of the study area, where little vegetation was present. Transverse dunes were found in the central part, where vegetation cover was higher than in the western part (dune networks region). Crescent dunes were found at the edge of oases (Fig. 2A) and in the south of the study area (Fig. 2C). Coppice dunes were also found in the southern part, and were distributed in the area of the gully (Fig. 2C).
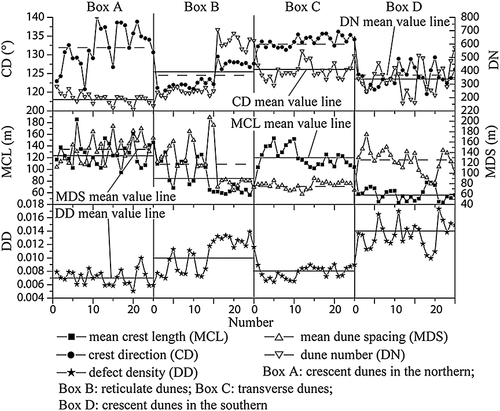
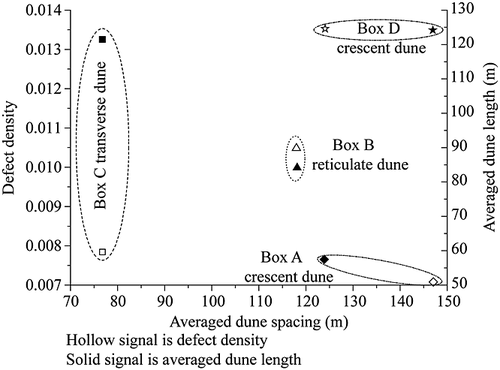
Spatial variations in the different dune patterns in the Tengger Desert were measured by manually digitizing crestlines from the Google Earth's high-resolution images. Figure 4 shows the measured dune patterns parameters in four box transects. The total dune number increased from upwind transect box A (4889) to downwind box C (10 037), except for the transect box D (Table 6). The total dune number in box D (8511) was lower than in the upwind box B (9878), due mainly to the presence of gullies in box D (Figs. 2 and 5), which separated crescent dunes and impeded their development. Mean crest length and direction were almost the same for the transect box A and C, and the same for box B and D (because of the gullies, the mean crest length in box D was smaller than in box B—we think that than the mean crest length could be the same, if there were no gullies in this region). Mean dune spacing decreased in the downwind direction except in transect box D; however, mean dune spacing was similar for box A and D (crescent dune) and again for box B and C, decreasing from crescent dunes to dune networks and transverse dunes (Fig. 6). In our study, mean dune spacing and crest length was between 50 and 200 m, and defect density between 0.005 and 0.018. The defect density was almost the same in transect box A and C, and again in B and D, decreasing from the southern crescent, to dune networks, to transverse, and to northern crescent dunes.
| Box A | Box B | Box C | Box D | |
|---|---|---|---|---|
| Dune number | 4889 | 9878 | 10 037 | 8511 |
| Mean | 195.6 | 395.1 | 401.5 | 340.4 |
| Standard deviation | 41.0 | 192.8 | 61.6 | 112.3 |
| Coefficient of variation | 21.0 | 48.8 | 15.3 | 33.0 |
| Mean crest length (m) | ||||
| Mean | 123.6 | 84.2 | 121.4 | 57.5 |
| Standard deviation | 24.8 | 25.1 | 16.1 | 10.6 |
| Coefficient of variation | 20.1 | 29.9 | 13.3 | 18.4 |
| Mean dune spacing (m) | ||||
| Mean | 146.9 | 118.1 | 76.8 | 124.0 |
| Standard deviation | 23.2 | 39.7 | 7.3 | 23.0 |
| Coefficient of variation | 15.8 | 33.6 | 9.5 | 18.6 |
| Crest direction (°) | ||||
| Mean | 132.2 | 124.1 | 133.7 | 124.1 |
| Standard deviation | 5.2 | 3.2 | 1.4 | 2.6 |
| Coefficient of variation | 4.0 | 2.6 | 1.0 | 2.1 |
| Defect density | ||||
| Mean | 0.007 | 0.010 | 0.008 | 0.014 |
| Standard deviation | 0.001 | 0.002 | 0.001 | 0.002 |
| Coefficient of variation | 16.1 | 22.7 | 11.1 | 14.6 |
4 Discussion
Wind regime, sand supply, source area, areal limit, and orographic factors are the primary environmental controls on the formation of aeolian dune field patterns (Kocurek and Lancaster, 1999; Lancaster, 1999; Derickson et al., 2008; Ewing and Kocurek, 2010a). Dune pattern parameters such as crest length, crest orientation, dune spacing, and defect density are strongly influenced by these external factors (Werner and Kocurek, 1999; Ewing et al., 2006; Derickson et al., 2008; Ewing and Kocurek, 2010a; Kocurek et al., 2010).
Wind and sand supply controlled the distribution of the observed dune patterns. Wind speed, potential sand transport, sand supply, and topography changed from north to south in the study area. These conditions were responsible for the formation of the crescent dunes and the main crestline of the dune networks. However, in autumn, the main wind direction and potential sand transport are from the SE quadrant and from the SE to the NW quadrant (Supplemental Figure S1, Fig. 3) at Xiqu, Jiahe, and Nanhu, and in such conditions, the patterns of the crescent dunes and the main crestline of the dune networks did not change. At Wujijing, Tumen, and Haizitan in autumn, wind direction and potential sand transport are complex, with the main wind direction and potential sand transport from the SW quadrant and from the SW to the SE quadrant, but at Wujinjing, almost 20% of the potential sand transport is from the SW quadrant to NE quadrant; in such conditions, the secondary crestline of the dune networks formed. The potential sand transport also decreased from north to south, with values larger than 140 in the northern and middle parts of the study area, versus <44 in the southern and western parts.
Sand supply was the main factor that controlled the formation of crescent and dune networks. The northwestern, western, and southern part of the desert lie in the northern part of the mountain, where alluvial–proluvial sediment material is abundant, however, the northwestern and the western part of the desert lie a relatively long distance away from the mountain, so the amount of fine sediment material is richer in the northwestern and western part than in the southern part. Crescent and coppice dunes formed under conditions of low sand availability, but dune networks formed under conditions of high sand availability. In our study area, crescent dunes were found mainly in two locations: one at the edges of the desert downwind of oases, and in areas with higher vegetation cover or with farmland present upwind of the dunes, both of which reduce sand supply, and the other in the southern part of the study area, where crescent dunes are at a relatively higher elevation, and gully channels at a lower elevation, with gully channels separating the continuously-distributed crescent dunes, resulting in a low sand supply. Coppice dunes were distributed at the edge of the desert and in the gully channels; in these areas, water availability was higher than in shifting-sand areas, and vegetation decreased wind speed. The dune networks were mainly distributed downwind of the crescent dunes, where crescent dunes can provide sand material for networks dunes to form. The transverse dunes were mainly distributed in the central part of the study area, with an abundant sand supply and higher vegetation cover than elsewhere.
In the northern and middle parts of the desert, vegetation cover was relatively low and the sand supply relatively large, but in the south, vegetation cover was higher and the sand supply lower. In the study area, the presence of mountains in the south results in higher elevations than in the north. As a result, alluvial channels carry sediments from the mountains towards the southern part of the desert, and this transport may be the main source of the coppice and crescent dunes area. Thus, the changes in the wind regime, sand supply, vegetation cover, and topography from north to south were responsible for the distribution of the dune field patterns.
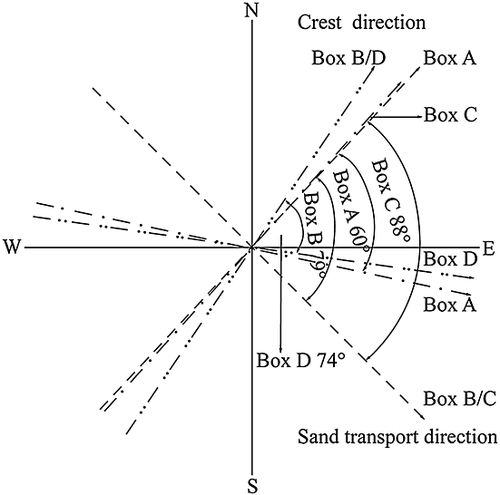
Previous research indicated that the effect of wind direction on the formation and evolution of dune patterns cannot be ignored (Bauer et al., 2012). Variability of wind direction is an important factor in pattern formation, with narrow unimodal distributions producing transverse, bimodal wind regimes producing linear, and more complex wind regimes producing star dunes (Fryberger and Dean, 1979). Rubin and Hunter (1987) hypothesized that dunes were oriented so as to maximize sand transport perpendicular to the crest line. Numerical simulations indicated that the divergence angle between two transport directions and transport ratio control dune patterns (longitudinal, oblique, and transverse). Various combinations of the divergence angles and transport ratios formed different dune patterns (Rubin and Hunter, 1987; Rubin and Ikeda, 1990; Werner, 1995; Kocurek and Ewing, 2005; Parteli et al., 2009; Reffet et al., 2010). For example, divergence angles between 0 and 90° formed transverse, 90° formed star, between 90 and 180° formed longitudinal, oblique or transverse (in different transport ratios), and 180° formed reversing dunes (Rubin and Hunter, 1987; Rubin and Ikeda, 1990; Werner, 1995; Werner and Kocurek, 1999; Kocurek and Ewing, 2005). Thus, while different methods were used to classify dune patterns, to date, little research has been devoted to the relationship between different methods. In our study, dune crest direction and resultant sand transport direction were 60 and 74° (Fig. 7) in both box A and box D transects, and 79 and 88° in both box B and box C transects. Dune patterns in box A and D transects were crescent, while in box B and C they were dune networks and transverse dunes; according to the relationship between dune crest direction and sand transport direction this indicated that the crescent dunes were oblique, while dune networks and transverse dunes were transverse.
Crescent dunes form in areas with a relatively low sand supply and a unimodal wind direction (Cook et al., 1993). In our study, crescent dunes were mainly distributed upwind of the desert (Fig. 1 box A) and in the southern region (Fig. 1 box D). Wind direction was mainly from the NW in the areas of crescent dunes, with a low wind energy environment and relatively high directional variability (Fig. 3). In the southern part of the study area, large areas of crescent dunes (dry yellow area) were found together with gully-channel area (field grey and light black) (Fig. 5A). The crescent dunes were located in higher latitudes (Fig. 5B) and divided into many linearly-distributed areas. The gully channel areas were located at lower latitudes (Fig. 5B) and the land surface was covered by coppice dunes (Fig. 5C, E), soil crust (Fig. 5D), and lacustrine sediment (Fig. 5B, E). Wind and sediment parameters alone cannot robustly explain such co-occurrence. Crest length, dune spacing, and defect density could be used to determine the age of dune formation (Werner and Kocurek, 1999; Ewing et al., 2006; Ewing and Kocurek, 2010a, 2010b). In our study, dune spacing and crest length increased with time, but decreased with dune defect density (Werner and Kocurek, 1999; Ewing et al., 2006; Ewing and Kocurek, 2010a, 2010b). Estimated time of dune formation at dune spacing 100 to 200 m would be 1 to 5 ka, at defect density of 0.001 to 0.01, it would be 0.1 to 6 ka, and at crest length 100 to 200 m, it would be 0.1 to 3 ka (Ewing et al., 2006); based upon observed crest length, spacing, and defect density, we estimate the age range for the Tengger Desert dunes at 0.1–6 ka.
Zhang et al. (2002, 2004) found that the Tengger Desert was a lake before 22 ka BP and that the lake levels fluctuated at different time scales; since then, the lake disappeared, and in the process, small gully channels formed. The evolution of the modern Tengger Desert included several expansion and contraction episodes (Qiang et al., 2000). In the expansion process, shifting sand covered the entire area of the Tengger Desert; however, in the contraction process, rainfall increased, and water flow formed from the southern mountains possibly expanding the previously-formed gully channels. As a result, the modern gully channels and crescent dune areas formed, and the mean crest length and the defect density differ substantially from those of the northern crescent dunes (Figs. 5 and 6). Dune pattern parameters differed across our study area; from upwind (Fig. 1 box A transect) to downwind (Fig. 1 box C transect), mean dune spacing and mean crest length decreased, but defect density increased, indicating that dunes formed upwind were older than those formed downwind. A similar trend was present for box B and D transects.
Dune networks are typically formed by overlapping dune systems, usually transverse dunes, with each system adjusted for a different seasonal wind (Aufrère, 1935), in areas with an abundant supply of sand (Cook et al., 1993), and under a bimodal wind energy environment. Dune network dynamics are similar to those of longitudinal dunes superimposed on transverse dunes (Hasi, 1998; Hasi et al., 1999). Dune networks were distributed in the central part of the desert, where vegetation cover was practically absent (Fig. 1) and the supply of sand abundant (from crescent dunes located upwind). The main crests were conspicuous, but the secondary crests were inconspicuous. Dune pattern parameters were controlled by wind speed, sand transport, sand supply, and vegetation cover. Wind speed, sand transport and vegetation cover were larger than southeastern in the study area; dune spacing (between 100 and 300 m, averaged 118 m) was larger than that in the southeastern region of the Tengger Desert (30 to 170 m) (Hasi et al., 2000).
From south to north, the elevation of the gully channels decreased, and the channels were typically parallel (i.e. most run northwards). In the southern part of the gullies, vegetation cover was relatively higher than in the middle part of the gullies. This suggests that vegetation cover area is controlled primarily by a combination of drainage channel systems and water availability; in the southern part of the gullies, annual rainfall is 360 mm and much larger than in the northern part (Minqin), which receives about 110 mm (Table 1). In this gullies region, vegetation cover was abundant; vegetation immobilized sand eroded from the dune field, and coppice dunes and soil crust could form (Fig. 5 B, C, D, E).
5 Conclusions
Wind is a primary factor that controls dune formation and evolution. The sand-driving wind speed and potential sand transport control the development of dune field patterns. We distinguished two areas at our study site based on the wind speed and potential sand transport: an area with a higher wind speed and potential sand transport in the northern and middle parts, and an area with a lower wind speed and potential sand transport in the southern part.
Different types of dunes formed in different parts of the study area. According to morphodynamic classifications, dunes can be transverse and oblique, however, according to morphological classifications, dunes include crescent, dune networks, transverse, and coppice dunes. In the northern part of our study area, we detected mainly crescent dunes and dune networks, although the secondary crests of the dune networks were inconspicuous. From the interior of the desert towards its edge near the mountains, the area of crescent dunes decreased, and in the middle part of the study area, there were mainly dune networks. In the southern part, we found coppice and crescent dunes, with coppice dunes distributed mainly in the gully channels, and crescent dunes distributed between the linearly-distributed gully channels.
Acknowledgements
We gratefully acknowledge funding from the National Natural Science Foundation of China (41101007), the West Light Foundation of the Chinese Academy of Sciences, International Cooperation in Science and Technology Projects (2011DFA11780), and the Ministry of Science and Technology of the People's Republic of China (2013CB956000). We are also indebted to the China Center for Resources Satellite Data and Applications, which provided the HJ-1A/B images.


