
Bayesian analysis of rare variants in genetic association studies
Abstract
Recent advances in next-generation sequencing technologies facilitate the detection of rare variants, making it possible to uncover the roles of rare variants in complex diseases. As any single rare variants contain little variation, association analysis of rare variants requires statistical methods that can effectively combine the information across variants and estimate their overall effect. In this study, we propose a novel Bayesian generalized linear model for analyzing multiple rare variants within a gene or genomic region in genetic association studies. Our model can deal with complicated situations that have not been fully addressed by existing methods, including issues of disparate effects and nonfunctional variants. Our method jointly models the overall effect and the weights of multiple rare variants and estimates them from the data. This approach produces different weights to different variants based on their contributions to the phenotype, yielding an effective summary of the information across variants. We evaluate the proposed method and compare its performance to existing methods on extensive simulated data. The results show that the proposed method performs well under all situations and is more powerful than existing approaches. Genet. Epidemiol. 35:57–69, 2011. © 2010 Wiley-Liss, Inc.
INTRODUCTION
It has been a well-established hypothesis that the genetic etiology of common (or complex) human diseases is determined by both common and rare genetic variants [Bodmer and Bonilla, 2008; Schork et al., 2009]. Although genome-wide association studies, which have thus far focused on common variants (with minor allele frequency (MAF) >∼5%) in the human genome, have successfully identified hundreds of novel disease-associated variants, these common variants explain only a small proportion of heritability for most diseases, motivating interest in finding the ‘missing heritability’ [Eichler et al., 2010; Manolio et al., 2009]. Rare variants have been naturally speculated as one of the most important sources of missing heritability [Cirulli and Goldstein, 2010; Eichler et al., 2010; Manolio et al., 2009]. Several studies have already shown that rare variants play an important role in genetic determination for some diseases [Ahituv et al., 2007; Azzopardi et al., 2008; Cohen et al., 2004, 2006; Ji et al., 2008; Nejentsev et al., 2009; Romeo et al., 2007, 2009]. Recent advances in next-generation sequencing technologies facilitate the detection of rare variants, making it possible to uncover the roles of rare variants in complex diseases.
As a single rare variant contains little variation owing to low MAF (<0.5 or 1%), statistical methods that test variants individually provide insufficient power to detect causal rare variants. Therefore, association analysis of rare variants requires sophisticated methods that can effectively combine the information across variants and test for their overall effect [Manolio et al., 2009]. Several approaches have been developed to analyze rare variants, including the Collapsing, Simple-Sum, and Weighted-Sum methods [Li and Leal, 2008; Madsen and Browning, 2009; Morris and Zeggini, 2010; Price et al., 2010]. These methods summarize multiple rare variants by weighting them equally [Li and Leal, 2008; Morris and Zeggini, 2010] or on the basis of estimated standard deviation [Madsen and Browning, 2009] or functional prediction [Price et al., 2010]. As we show in this study, however, these existing methods actually implicate assumptions about the relative effect sizes of individual variants (for example, the Simple-Sum method implicitly assumes that the genetic effects of individual variants are identical) and thus can be suboptimal if the data do not follow the implicit assumptions.
There are complications that the existing methods have not addressed yet. First, multiple rare variants detected in a gene or region may affect phenotype in either direction (i.e. some are disease-causing and others are disease-protective) [Cohen et al., 2004; Manolio et al., 2009]. If these rare variants are simply pooled, the existing methods will fail, because the effects of the variants can cancel each other and thus the true signal is lessened. Second, sequencing uncovers both functional and nonfunctional variants, and treating them equally may reduce association. The ideal solution to these problems is to separately combine disease-causing and protective variants or scale the allele counts of all variants in the same association direction and to exclude nonfunctional variants from the analysis. However, accurately determining which variants are disease-causing or protective and which are responsible for a given phenotype represent a massive task and are not always feasible [Manolio et al., 2009]. Therefore, statistical methods that can deal with these complications are required.
In this study, we introduce a novel Bayesian hierarchical generalized linear model for analyzing multiple rare variants within a gene or genomic region in association studies. Although our method can deal with various phenotypes, we demonstrate its performance with a binary disease trait as in population-based case-control studies. Rather than predetermining the weights of variants as previous methods, our approach jointly models the overall effect and the weights of multiple rare variants and estimates them from the data. This could produce different weights to different variants based on their contributions to the phenotype, yielding an effective summary of the information across variants. We use extensive simulations to evaluate the proposed method and compare its performance to existing methods. The results show that the proposed method performs well under all situations and is more powerful than existing approaches.
METHODS
BAYESIAN MODEL OF MULTIPLE RARE VARIANTS
 (1)
(1) , equal to 9.5×10⁻³ when the frequency pj and the odds ratio exp(βj) equal 1 and 2%, respectively. A solution would be to create a “genetic score” that combines information across multiple rare variants for each individual. The genetic score is then treated as a single predictor, allowing us to detect the overall association of the variants with the disease. We construct the genetic score as a linear function of the separate main-effect predictors, i.e.
  , and set up a generalized linear model:
 (2)
(2) (3)
(3) [Gelman and Hill, 2007]. However, we prefer the Student-t distribution because it estimates the variances
  from the data and thus may better deal with disparate effects. The prior means µj can be specified as the relative importance of the individual variants based on our prior knowledge or initial analysis (see Discussion). In this study, we incorporate no prior information into the model by setting µj = 1 for all j = 1,…,m. We found that the method is fairly robust to any small changes for the scale sα (for example, from 0.2 to 0.8).
 (4)
(4)COMPUTATION
Our Bayesian generalized linear model can be fitted using Markov chain Monte Carlo algorithms that fully explore the joint posterior distribution of the parameters by alternatively sampling each parameter from its conditional posterior distribution. However, it is desirable to have a faster computation that provides a point estimate (i.e. the posterior mode) of β and αj's and their standard errors (and thus the P-values) by maximizing the marginal posterior  . Such an approximate calculation has been routinely applied in statistical practice [Gelman et al., 2008]. We develop our algorithm by modifying the standard iterative weighted least squares (IWLS) for fitting classical generalized linear models. We have implemented these computations by altering the glm function in R (the general statistical package) that fits classical generalized linear models.
 . Then, at each step of the algorithm, we first update αj's conditional on the current estimate
  by using the modified IWLS algorithm of Yi and Banerjee [2009] and Yi et al. [2010] to fit the hierarchical generalized linear model:
 (5)
(5) 's by fitting the hierarchical model using the modified IWLS algorithm [Yi and Banerjee, 2009; Yi et al., 2010]:
 (6)
(6)
 and
and  are deviances at the tth iteration for the models [4] and [5], respectively, and
  is a small value (say 10−8). In practice, our algorithm converges rapidly. At convergence of the algorithm, we obtain all the outputs produced by the glm function, including the latest estimate
  , their standard deviations, and the P-values for testing β = 0.
RELATIONSHIP WITH EXISTING METHODS
The basic procedure of rare variant analysis is to construct a weighted combination (genetic score) of m rare variants,  , that summarizes the information across the variants for each individual i, and then estimate the association between the phenotype yi and the genetic score Ti using a generalized linear model,
  , or other testing statistics. Our method differs from existing methods in estimating the weights αj's (along with the overall effect β) from the data using a hierarchical modeling framework rather than simply presetting them to fixed values. This would produce higher weights for more ‘important’ variants.
Presetting the weights αj's to different values results in different existing methods: (1) If  , we have
  and thus the method is the Simple-Sum [Han and Pan, 2010; Morris and Zeggini, 2010]; (2) If we take
  , where I(x) is an indicator variable taking 1 if x>0, and 0 otherwise, the method becomes the Collapsing approach [Li and Leal, 2008]; (3) If αj = 1/sd(xij|yi = 0), j = 1,…,m, where sd(xij|yi = 0) is the estimated standard deviation of xij in unaffected individuals, the model is similar to the Weighted-Sum approach [Madsen and Browning, 2009]; (4) If setting αj to the posterior probability of being functional for each variant j, Ti corresponds to that of Price et al. [2010]. These posterior probabilities can be calculated using bioinformatics tools such as PolyPhen [Adzhubei et al., 2010; Price et al., 2010].
From the above procedure, we can see that the term αjβ actually corresponds to the genetic effect βj of the jth variant. With the fixed weights, therefore, the individual genetic effect βj is proportional to the corresponding weight αj. This important result reveals the underlying assumptions of the existing methods. The Simple-Sum method implicates that the effects of all variants are identical; obviously, this is an unrealistic assumption. The Weighted-Sum method first standardizes the main-effect predictors and then assumes identical coefficients for all variants in the standardized model. This corresponds to the implicit assumption 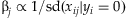 . The approach of Price et al. [2010] implicitly assumes that the effect of a variant is proportional to the posterior functional probability. Therefore, all the existing methods implement pooling of multiple rare variants according to certain assumptions about the genetic effects of variants. Although powerful in certain situations, these methods can be inefficient if the underlying assumption is not true. In contrast, the proposed method does not require any assumptions about the relative importance of individual variants and thus could be more robust than the existing methods.
SIMULATIONS AND COMPARISON WITH EXISTING METHODS
We use extensive simulations to evaluate the proposed approach and to compare the proposed method with five existing methods: the Collapsing, Simple-Sum, Weighted-Sum, and All-Variants (i.e. jointly fitting all variants) and Single-Variant (i.e. fitting one variant at a time).
BAYESIAN VERSIONS OF EXISTING METHODS
Although various testing statistics have been proposed for the existing Collapsing, Simple-Sum, and Weighted-Sum methods [Han and Pan, 2010; Li and Leal, 2008; Madsen and Browning, 2009; Price et al., 2010], we implement these methods using logistic regressions:

 for the Collapsing,
  for the Simple-Sum, and
 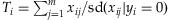 for the Weighted-Sum. The All-Variants method jointly estimates the individual effects of all variants:

These logistic regressions can be nonidentifiable when the variance Var(Ti) or Var(xij) is small [Li and Leal, 2008]. We overcome this problem by placing the weakly informative prior [Gelman et al., 2008],  ,
, 
 , and
, and 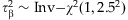 . We fit these models using the modified IWLS algorithm of Yi and Banerjee [2009] and Yi et al. [2010]. This improves the performance of these previous approaches and has the advantage of always producing stable estimates.
SIMULATION DESIGN
We consider different combinations of the factors that may affect the performance of the methods:
(a) Sample size: We simulate n = 500, 1,000, and 2,000 individuals with an equal number of affected and unaffected.
(b) Number of rare variants: We simulate m = 20, 40, and 80 rare variants.
(c) Minor allelic frequencies and genotypes: We sample m variants independently because correlation between rare variants is low [Pritchard, 2001; Pritchard and Cox, 2002]. For the jth variant, we sample the MAF pj uniformly from the region [0.001, 0.01], as variants with MAF<0.001 would be indistinguishable in our presumed sample sizes. Assuming the Hardy-Weinberg equilibrium for each variant, we thus generate the genotypes from the multinomial distribution: 
(d) Genetic model: We evaluate our method using the additive genetic model for each variant. For rare variants, the additive model is approximately equivalent to the dominant model, and detection of recessive effects requires extremely large sample [Li and Leal, 2008].
(e) Number of functional variants and genetic effects: For m = 20, 40 and 80, we set all the variants to be functional or randomly sample 40% of the simulated variants as nonfunctional. For each functional variant, we simulate the odds ratio exp(βj) to be 1 (for type-I error rate) or uniformly from the region [1.05, ORu] (for power analysis). To ensure that the overall effect of all variants is reasonably low, we determine the upper bound ORu by controlling the total liability heritability, which approximates  (as derived in the next paragraph), where pave is the average MAF, mf is the number of functional variants, and exp(βave) is the average odds ratio, equal to (1.05+ORu)/2. For example, ORu = 2.0 when mf = 40 and
  . We consider the total liability heritability
  from 0.7 to 8%. Finally, we consider the most complicated case in which the effects of the functional rare variants are in opposite directions; for each functional variant, we first simulate the odds ratio exp(βj) uniformly from the region [1.05, ORu], and then change the sign of βj with the probability of 0.3 or 0.5.
Given the coefficients βj and the genotypic codes xij, we can simulate the disease phenotype yi using two methods. The first method is to directly sample yi from the binomial distribution: 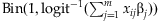 . This procedure is repeated until we obtain n/2 affected and n/2 unaffected individuals. The second is to use the latent-data formulation of the logistic regression; the logistic model
 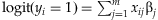 is equivalent to the model,
 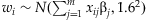 ,
,  [see Gelman and Hill, 2007]. Thus, we first sample n latent normal phenotypes wi and then set n/2 individuals with the 50% largest wi as affected (i.e. yi =1) and the other n/2 individuals as unaffected. The latent-data formulation allows us to calculate the proportion of the latent-data variance explained by the variants, i.e. the liability heritability [Wray et al., 2010],
  . As described above, this formulation can be used to control the total heritability when we simulate the coefficients βj.
For each set of parameters, 1,000 replicated data sets are simulated, and each is analyzed using our hierarchical model approach and the Collapsing, Simple-Sum, Weighted-Sum, All-Variants, and Single-Variant methods. For each analysis, we use the additive genetic model. We calculate power to detect overall association β=0 at significance levels of α = 0.001 and α = 2.5×10⁻⁶. These thresholds correspond to candidate gene studies [Price et al., 2010] or a genome-wide study of about 20,000 fairly independence human genes [Madsen and Browning, 2009], respectively. We also examine type-I error rate at a significance level of α = 0.05. For the All-Variants and Single-Variant methods, the overall association is examined by testing whether at least one βj = 0 for all j = 1,…,m, and for simplicity we do not adjust the significance level for multiple testing. Therefore, we overestimate the power for the All-Variants and Single-Variant methods.
RESULTS
TYPE-I ERROR RATE
As shown in Figure 1, the type-I error rates are well controlled for the proposed method and the Collapsing, Simple-Sum, and Weighted-Sum methods. The proposed method slightly inflates the type-I error rate when n = 500 and m = 20. However, there is no constant trend that the proposed method generates higher type-I error rate than those of the previous methods. The type-I error rates for the All-Variants and Single-Variant methods are unacceptably high, and significantly increases with increasing number of variants, indicating the need for multiple-testing correction.

Type-I error rates of the proposed method, Collapsing, Simple-Sum, Weighted-Sum, All-Variants, and Single-Variant methods at the 5% level with the number of variants m = 20, 40, and 80 and the number of individuals n = 500, 1,000, and 2,000. The dashed horizontal line is the nominal 0.05 level.
ANALYSIS OF FUNCTIONAL VARIANTS
We first investigated powers of the methods for the relatively simple scenario in which all rare variants are functional and affect disease risk in the same direction. As shown in Figures 2 and 3, the results for different sample sizes, different numbers of rare variants and different liability heritabilities display similar patterns of empirical powers. A notable result is that the proposed method is consistently more powerful than the other methods. Because our method estimates the weights of multiple variants from the data, our model fits the data better and generates a genetic score that better summarizes the information across the variants. Thus, the proposed method improves the power to detect the overall association between rare variants and disease.

Empirical powers of the proposed method (○), Collapsing (▵), Simple-Sum (+), Weighted-Sum (×), All-Variants (◊), and Single-Variant (▿) methods at a significance level of α = 0.001. n and m represent the numbers of individuals and rare variants, respectively. The total liability heritabilities are 0.7, 1, 3, 5, or 8%. The numbers at the bottom line are the corresponding upper bounds ORu of the odds ratios. All the simulated variants are functional, and affect phenotype in the same direction.

Empirical powers of the proposed method (○), Collapsing (▵), Simple-Sum (+), Weighted-Sum (×), All-Variants (◊), and Single-Variant (∇) methods at a significance level of α = 2.5×10⁻⁶. n and m represent the numbers of individuals and rare variants, respectively. The total liability heritabilities are 0.7, 1, 3, 5, or 8%. All the simulated variants are functional, and affect phenotype in the same direction.
As expected, the power drastically increases with the sample size and the total liability heritability explained by the variants. These relationships hold rather generally for the methods that we examined. Given sample size and total liability heritability, the power slightly decreases with the number of variants. This is likely the results that more variants generate a lower upper bound ORu of odds ratios for individual effects (thus smaller individual effects) and thus their information may be more difficult to be summarized. Our simulations showed that with small sample sizes (n = 500, 1,000) the All-Variants and Single-Variant methods have no power to detect the association between rare variants and disease. These are expected because these methods test for the effects of single variants each of which has little variation. For larger sample size (n = 2,000), the powers of the All-Variants and Single-Variant methods go up at the significance level of α = 0.001 with no multiple-testing correction, but rapidly decrease to near zero with a more stringent significance level (Fig. 3).
Our results showed that some of the previous methods produce similar power as the proposed method in some situations, masking the real difference between these methods. To investigate whether the proposed method provides any advantages in these situations, we calculated the median value of P-values for simulation replicates with P-value <0.001. A notable outcome of this analysis is that the proposed method uniformly yields much lower P-values than the previous methods (Fig. 4). This finding indicates that our method usually provides stronger evidence of association if the variants really influence the disease.

Median of P-values (rescaled as −log10 P) for the proposed method (○), Collapsing (▵), Simple-Sum (+), and Weighted-Sum (×) methods for replicates with P-value <0.001. n and m represent the numbers of individuals and rare variants, respectively. The total liability heritabilities are 0.7, 1, 3, 5, or 8%. All the simulated variants are functional, and affect phenotype in the same direction.
INCLUSION OF NONFUNCTIONAL VARIANTS
Nonfunctional variants do not contribute to disease risk. Therefore, the inclusion of nonfunctional variants in the analysis introduces noisy variation in the model and may influence the performance of the methods. Our simulations showed that the power decreases when nonfunctional variants are included (Figs. 5 and 6). This is true for all the methods that we examined. However, we found that the previous methods lose more power than the proposed method. This probably results from the fact that the previous methods use equal or inappropriate weights for functional and nonfunctional variants, thereby ineffectively summarizing the information across the multiple rare variants. In contrast, our method estimates weights from the data and thus can set lower or even zero weights to nonfunctional variants, providing a better genetic score.

Empirical powers of the proposed method (○), Collapsing (▵), Simple-Sum (+) and Weighted-Sum (×), All-Variants (◊), and Single-Variant (∇) methods at a significance level of α = 0.001. n and m represent the numbers of individuals and rare variants, respectively. The total liability heritabilities are 0.7, 1, 3, 5, or 8%. The numbers at the bottom line are the corresponding upper bounds ORu of the odds ratios. Sixty per cent of the simulated variants are functional, and affect phenotype in the same direction.

Empirical powers of the proposed method (○), Collapsing (▵), Simple-Sum (+) and Weighted-Sum (×), All-Variants (◊), and Single-Variant (∇) methods at a significance level of α = 2.5×10⁻⁶. n and m represent the numbers of individuals and rare variants, respectively. The total liability heritabilities are 0.7, 1, 3, 5, or 8%. Sixty per cent of the simulated variants are functional, and affect phenotype in the same direction.
Although the power decreases with inclusion of nonfunctional variants, the general conclusions obtained earlier still hold. The proposed method is uniformly more powerful (Figs. 5 and 6) and generates much lower P-values than the previous methods (Fig. 7).

Median of P-values (rescaled as −log10 P) for the proposed method (○), Collapsing (▵), Simple-Sum (+), and Weighted-Sum (×) methods for replicates with P-value <0.001. n and m represent the numbers of individuals and rare variants, respectively. The total liability heritabilities are 0.7, 1, 3, 5, or 8%. Sixty per cent of the simulated variants are functional, and affect phenotype in the same direction.
ANALYSIS OF RARE VARIANTS WITH OPPOSITE EFFECTS
We finally investigated empirical power of the methods in the complicated scenario in which the effects of the functional rare variants influence disease in opposite directions. With 30% (70%) of functional variants increasing (decreasing) disease risk, the previous methods have some power to detect the association when sample size is large (n = 2,000) (Fig. 8). But the power rapidly decreases with a more stringent significance level (Fig. 9). For the worst case where 50% (50%) of functional variants increase (decrease) disease risk, the Collapsing, Simple-Sum, and Weighted-Sum methods have no power to detect the association even when sample size and odds ratios are large. These results are expected because these methods simply pool all variants together, using equal weights for disease-causing and disease-protective variants. Therefore, the information across multiple rare variants is canceled and the true association signal is completely hidden. As expected, the All-Variants and Single-Variant methods perform similarly as the previous cases that we studied.

Empirical powers of the proposed method (○), Collapsing (▵), Simple-Sum (+), Weighted-Sum (×), All-Variants (◊), and Single-Variant (∇) methods at significance level of α = 0.001. n and m represent the numbers of individuals and rare variants, respectively. The total liability heritabilities are 0.7, 1, 3, 5, or 8%. The top (bottom) pattern shows the analyses that 30% (50%) of the functional variants affect phenotype in the opposite direction.

Empirical powers of the proposed method (○), Collapsing (▵), Simple-Sum (+), Weighted-Sum (×), All-Variants (◊), and Single-Variant (∇) methods at a significance level of α = 2.5×10⁻⁶. n and m represent the numbers of individuals and rare variants, respectively. The total liability heritabilities are 0.7, 1, 3, 5, or 8%. The top (bottom) pattern shows the analyses that 30% (50%) of the functional variants affect phenotype in the opposite direction.
The most striking finding of this study is that our method is still powerful even when multiple rare variants have opposite effects on disease risk (Figs. 8 and 9). This remarkable feature is certainly the result of the unique property of the proposed method. Our method estimates weights from the data and thus yields different weights for disease-causing and protective variants, avoiding cancellation of individual-variant variation. Compared to the simpler case, however, for this complicated case, the proposed method is less powerful and is more sensitive to the number of variants. This is expected because the increasing complexity certainly reduces the accuracy of statistical inference.
DISCUSSION
The Bayesian method developed here includes innovative and attractive features in both modeling and computation steps. The proposed hierarchical model treats the weights as parameters, not only obviating the choice of them but also allowing for better combination of multiple variants. The key to this approach is the use of an appropriate model for the weights, so that the overall coefficients and the weights are identifiable [Gelman, 2004; Gelman and Hill, 2007]. The proposed algorithm extends the standard procedure for fitting classical generalized linear models in the general statistical package R to our Bayesian model, leading to the development of stable and flexible software. Although a fully Bayesian computation that explores the posterior distribution of parameters provides more information, our mode-finding algorithm quickly produces all results as in routine statistical analysis. Our method is directly applicable to candidate gene association studies and has the potential to be applied to large-scale exome sequencing or whole-genome resequencing data. Furthermore, the hierarchical generalized model framework and the computational strategy developed here can deal with various types of continuous and discrete phenotypes and any generalized models.
We describe our Bayesian method by setting the same prior means for all variants. This means that our model assumes no hypothesis on the relative effect size of rare variants. The motivation for this prior specification is that our understanding of the role of rare variants in common disease is far from complete and thus any assumptions may not be always appropriate. However, recent empirical and theoretical studies have suggested that effect size may correlate with the frequency distribution or the functional credibility of rare variants [Ahituv et al., 2007; Madsen and Browning, 2009; Ng et al., 2009; Price et al., 2010; Pritchard, 2001]. These relationships can be easily incorporated into our Bayesian model by modifying the prior means for variants. By doing so, our approach has the additional advantage of accounting for uncertainties about these relationships in the hierarchical modeling.
There are several ways in which our method may be extended. First, for simplicity, we have not considered the issue how to determine which variants to be combined. The approach proposed by Li and Leal [2008] that pools variants below a fixed allele-frequency threshold (say, 1%) and separately models other variants can be easily applied to our model. A recently proposed method uses a variable allele-frequency threshold, which also can be incorporated into our model [Price et al., 2010]. Second, we have focused on rare variants in a gene or region, but complex diseases are usually influenced by multiple genes and environmental factors and their interactions. Our hierarchical model can be easily extended to include environmental factors as covariates and jointly analyze all rare variants in multiple genes using a separate genetic score for each gene. In principle, we can extend the proposed model to include gene-environment and gene-gene interactions by defining an overall coefficient and a genetic score for each interaction. However, it would be interesting to investigate statistical power for detecting interactions in analysis of rare variants. Third, rare variants tend to have occurred more recently and therefore population stratification should be adequately controlled when analyzing rare variants [Eichler et al., 2010]. We can infer population substructure from sufficient data and then incorporate them into our model.
Acknowledgements
This work was supported in part by the National Institutes of Health (NIH) Grants 2R01GM069430-06 and GM077490 to N. Y. and the NIH Grant R00 RR024163 to D. Z. N. Y. and D. Z. designed the statistical models and simulation studies together. N. Y. implemented the method and developed the software. Both authors contributed to the writing of the manuscript. The authors declare no competing financial interests.