Comparison of the General Threshold Model of Survival and Dose–Response Models in Simulating the Acute Toxicity of Metals to Danio rerio
Abstract
We exposed zebrafish (Danio rerio) to different concentrations of lead and cadmium, and monitored them for survival at 24, 48, 72, and 96 h. Metal toxicity was predicted and compared using the dose–response and general threshold survival models in terms of required data sets, fit performance, and applicability. Environ Toxicol Chem 2019;38:2169–2177. © 2019 SETAC.
INTRODUCTION
The acceleration of industrialization has released a large amount of metals into the aquatic environment (Hendriks 2013). Heavy metals not only pose potential risks to the survival, growth, and reproduction of plants and nonhuman animals (de Oliveira et al. 2018), but they can also affect the fertility and reproduction of humans through the food chain (Zhang et al. 2018). Therefore, how to effectively identify and manage heavy metal pollution is a major issue worldwide.
Previous studies on quantifying chemical toxicity have presented several approaches on the basis of certain theoretical propositions (Vaananen et al. 2018). Among these approaches, the classical dose–response model has frequently been used to relate internal metal concentration with toxicity (Fox and Billoir 2013; King et al. 2015). The dose–response model cannot predict effects in other exposure scenarios, such as long-term exposure, because it relies on a certain exposure endpoint (Delignette-Muller et al. 2017). The toxicokinetic–toxicodynamic (TK–TD) model (Schmitt et al. 2013; Swiatek et al. 2017) is a type of dynamic model that describes the cumulative dynamics of metals in vivo over time (Ducrot et al. 2016). Jager et al. (2011) integrated a kinetic model with different hypotheses of biological individuals into a framework and proposed the general unified threshold model for survival (GUTS) based on the general TK–TD model of mortality threshold. Stochastic death (GUTS–stochastic death) and individual tolerance (GUTS–IT) approaches were the most commonly used TD models in the GUTS framework. The GUTS–stochastic death model assumed that the threshold of lethal effect was fixed and was identical for all individuals. However, the GUTS–IT model assumed that the threshold of the lethal effect was distributed for all individuals and that once an individual threshold was exceeded, mortality immediately followed.
Compared with the dose–response model, the GUTS model took into account both time and concentration simultaneously. Up to now, few studies have compared applicability between the dose–response and GUTS models. Recently, in a study of the time-course survival of Lymnaea stagnalis exposed to cadmium (Cd), the GUTS model was found to produce more conservative estimates and to have lower uncertainty than the dose–response model for visual assessment (Baudrot et al. 2018). Studies are needed to evaluate the performance of these models in determining Cd toxicity in other organisms. In the present study, the model organism zebrafish (Danio rerio) was chosen to assess these models.
In general, heavy metal toxicity is assumed to be caused by binding with carriers or an ion pathway for the uptake of essential elements (Bridges and Zalups 2005). In zebrafish, it was observed that Cd2+ was taken up mainly through the potassium (K+), calcium (Ca2+), and magnesium (Mg2+) uptake channel, and that lead (Pb2+) was taken up by the Ca2+ and Mg2+ channels (Feng et al. 2018). Some studies (Hogstrand et al. 1996; Rogers et al. 2003) have demonstrated that Cd and Pb act as Ca analogs. In the present study, we simulated Pb toxicity to zebrafish with the dose–response and GUTS models to verify the reliability of the data and to evaluate model performance. The objective of our study was to model the time-course of survival of zebrafish exposed to Pb or Cd using the dose–response and GUTS models, to evaluate model applicability, and to determine whether Cd and Pb differed in their toxicity to zebrafish.
MATERIALS AND METHODS
Chemicals and reagents
The Cd and Pb stock solutions (Cd: 10 g/L; Pb: 40 g/L) were prepared by adding Cd chloride and Pb nitrate (>99%; Aladdin Ultra Pure) to ultrapure water (Milli-Q; R > 18.2 MΩ cm). The stock solutions were diluted with ultrapure water to create graded series of working solutions with Pb concentrations of 0, 1.21 × 10⁻⁶, 2.42 × 10⁻⁶, 4.84 × 10⁻⁶, 9.68 × 10⁻⁶, and 1.93 × 10⁻⁵ M and Cd concentrations of 0, 8.90 × 10⁻⁷, 2.22 × 10⁻⁶, 4.45 × 10⁻⁶, 8.90 × 10⁻⁶, and 1.78 × 10⁻⁵ M.
Test organism
Zebrafish (Danio rerio, AB strain) were purchased from the Institute of Hydrobiology, Chinese Academy of Sciences, Wuhan, China. The fish were aerated in 50-L glass tanks for approximately 1 mo at 26 ± 0.5 °C under a 12:12-h light:dark photoperiod and were fed brine shrimp (Artemia nauplii) twice a day. At 24 h before the experiment, feeding was ceased, and survival was assessed to ensure that the mortality rate was less than 5%. The present study was conducted in accordance with the national and institutional guidelines for the protection of human subjects and animal welfare.
Experimental design
The zebrafish (6 mo old, 35–45 mm long, 0.5–0.65 g) were exposed to the single Cd or Pb working solutions. For all exposure treatments, the zebrafish were transferred into a glass beaker containing 2 L of working solution. Ten zebrafish were added per beaker, and the treatments were performed in triplicate. The zebrafish were maintained at 26 ± 0.5 °C under a 12:12-h light:dark photoperiod. To maintain constant exposure, the working solutions were renewed every day. The zebrafish were not fed during treatment to avoid the influence of food on metal accumulation in the body during the experiment. The pH was controlled at approximately pH 7.0 with 2 × 10⁻² M 3-[N-morpholino] propane sulfonic acid buffer or 1 mol L–1 diluted HCL (Aladdin; >99% purity) and was measured with a pH meter (S20P-L Seven Easy Plus; Mettler Toledo).
Mortality was recorded at 24, 48, 72, and 96 h, and the surviving fish from each treatment and the control were collected and washed with ultrapure water to remove the interference of metal on the surface of the fish. The fish were dried at 60 ± 0.5 °C until they reached constant weight and were digested by the water-bath (thermostat water bath cauldron; JinXiang) method at 80 ± 2 °C. The digest was filtered with a 0.45-μm membrane (Whatman) to determine the total metal concentrations in the animals by using inductively coupled plasma–mass spectrometry (ICP–MS; model ELAN DRC-e; PerkinElmer; Gao et al. 2017). In the experimental treatments, the Pb exposure concentrations were 1.30 × 10⁻⁶, 2.30 × 10⁻⁶, 4.96 × 10⁻⁶, 9.48 × 10⁻⁶, and 1.91 ×10⁻⁵ M, and the Cd exposure concentrations were 7.90 × 10⁻⁷, 2.36 × 10⁻⁶, 4.36 × 10⁻⁶, 9.80 × 10⁻⁶, and 1.72 × 10⁻⁵ M. The Pb and Cd concentrations in the control (ultrapure water) were measured and were lower than the limit of detection (LOD) of ICP–MS (LOD values for Cd and Pb of 0.01 and 0.02 μg/L, respectively).
Model approach
Dose–response model
 (1)
(1) (2)
(2)TK–TD models
 (3)
(3) (4)
(4) is the internal concentration in the organism at a given exposure time (t).
 (5)
(5)The model equation and parameter estimations of GUTS–stochastic death and GUTS–IT have been described by Virgile Baudrot (2018).
Statistical analysis
 (6)
(6)where Qobserved value is the observed survival rate of the zebrafish, and Qfitted value is the fitted survival rate estimated by the dose–response, GUTS–stochastic death, or GUTS–IT models.
RESULTS
Modeling of the required data sets
All the parameters could be estimated by the dose–response and GUTS models for either the Pb or Cd treatments with at least 3 sets of data where 1 set of data included one concentration at different exposure times. The dose–response relationships could be estimated with at least 3 sets of data (Figure 1). Moreover, the parameters that were estimated by the dose–response and GUTS models remained stable once 5 or more sets of data were used, which demonstrated that both the dose–response and GUTS models had identical data requirements.
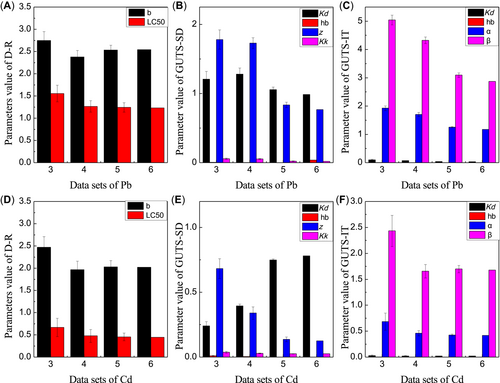
The different required numbers of data sets for the parameters estimated by the dose–response (D–R), general unified threshold model for survival–stochastic death (GUTS–SD), and general unified threshold model for survival–individual tolerance (GUTS–IT) models for cadmium (Cd) and lead (Pb). (A) The D–R parameters for Pb toxicity. (B) The GUTS–SD parameters for Pb toxicity. (C) The GUTS–IT parameters for Pb toxicity. (D) The D–R parameters for Cd toxicity. (E) The GUTS–SD parameters for Cd toxicity. (F) The GUTS–IT parameters for Cd toxicity. The background hazard rate (hb) estimated by GUTS–SD and GUTS–IT was 0.0005 for the Cd treatment and the Pb treatment, so it is almost not visible. LC50 = median lethal concentration.
Prediction of metal toxicity in zebrafish by different models
Prediction of Cd and Pb toxicity by the dose–response model
The parameters at the different exposure times were estimated by the dose–response model, and the results are shown in Table 1. The parameter b indicates the strength of the toxic effect: the b value increased over time up to 72 h, and then decreased slightly at 96 h. Furthermore, the b value at the 72-h exposure time was approximately twice that at 24 h, and thus the results showed that the effect strength of Cd in fish was strongest at the 72-h exposure time. The LC50 decreased gradually over time, as shown in Table 1 (Cd: by 63% decrease). For the Pb treatments, the b value decreased gradually over time, and the toxic effect strength of Pb on zebrafish was the greatest at 24 h. The LC50 value decreased as time increased (Pb: 34% decrease), as shown in Table 1. The findings demonstrate that the survival rate of zebrafish declined with increasing exposure time.
| b | LC50 (mg/L) | ||||||
|---|---|---|---|---|---|---|---|
| Metal | Time (h) | Average | Q2.5 | Q97.5 | Average | Q2.5 | Q97.5 |
| Cd | 24 | 1.106 | 0.700 | 1.567 | 1.191 | 0.855 | 1.567 |
| 48 | 1.963 | 1.420 | 2.626 | 0.491 | 0.393 | 0.615 | |
| 72 | 2.105 | 1.523 | 2.801 | 0.469 | 0.377 | 0.583 | |
| 96 | 2.021 | 1.464 | 2.707 | 0.445 | 0.356 | 0.555 | |
| Pb | 24 | 2.941 | 2.091 | 4.011 | 1.869 | 1.568 | 2.247 |
| 48 | 2.741 | 1.987 | 3.692 | 1.516 | 1.267 | 1.825 | |
| 72 | 2.870 | 2.083 | 3.902 | 1.449 | 1.215 | 1.730 | |
| 96 | 2.545 | 1.857 | 3.414 | 1.231 | 1.025 | 1.496 | |
- b = effect strength; LC50 = median lethal concentration; Q2.5 = 2.5% quantile; Q97.5 = 97.5% quantile.
The predicted dose–response curve of Cd in fish at different exposure times is shown in Figure 2A. Survival rate decreased as exposure concentration increased for all exposure times. The curve for the 24-h exposure time was smoother than the curves for the other exposure times. In addition, the shape of the dose–response curve b was similar among the other exposure times, as shown in Table 1. All the observed survival rates fell into the confidence interval, as predicted by the dose–response model except for that at the 1-mg/L Cd concentration point at 24 h. The toxic effects of Cd on zebrafish exposed to different concentrations were well predicted by the dose–response model.
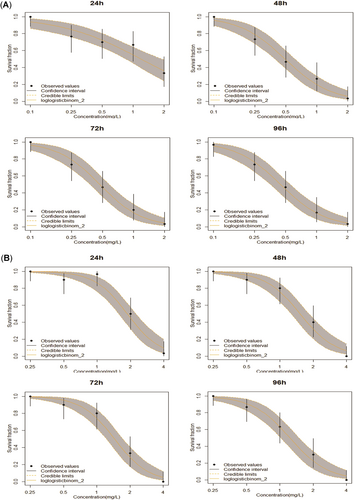
The dose–response curve of zebrafish exposed to single cadmium (Cd; A) or lead (Pb; B) treatments at different exposure times.
The toxic effects of Pb on zebrafish exposed to different concentrations were also well predicted by the dose–response model (Figure 2B). Survival rate decreased as exposure concentration increased at all exposure times. Moreover, the shape of the dose–response curve b was similar among the exposure times, as shown in Table 1. All the observed survival rates fell into the confidence interval predicted by the dose–response model except for those for Pb concentrations of 0.50 and 1 mg/L at 24 h.
The fitted performance of the dose–response model was higher for the Pb treatments than for the Cd treatments (Figure 3), with a higher R2 value (0.97) and a lower RMSE (0.06) for the Pb treatments than for the Cd treatments (R2 = 0.96, RMSE = 0.08). The survival rate of zebrafish was well simulated by the dose–response model.
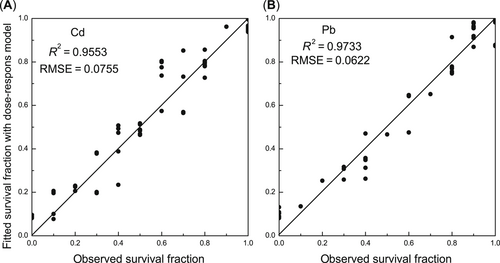
The fitted performance of the dose–response (D–R) model in (A) cadmium (Cd) and (B) lead (Pb) treatments. R2 = the coefficient of determination for the solid lines, the 1:1 lines between predicted and observed values; RMSE = the root mean square standard error of the 1:1 line.
Prediction of Cd and Pb toxicities by the GUTS models
The Kd estimated by GUTS–stochastic death (Pb: 0.10; Cd: 0.77) was approximately 25 to 30 times that estimated by GUTS–IT (Pb: 0.01; Cd: 0.02), and the background rate (hb) simulated by GUTS–stochastic death (Pb: 3.70 × 10⁻⁴; Cd: 1.68 × 10⁻⁴) was approximately twice that estimated by GUTS–IT (Pb: 1.27 × 10⁻⁴; Cd: 0.82 × 10⁻⁴; Table 2). For the Cd treatments, the no-effect concentration (Zw) from the GUTS–stochastic death model and the median effect concentration (α) from the GUTS–IT model were 0.13 and 0.42, respectively, demonstrating a difference in survival rate prediction between these 2 models. The GUTS–IT model assumes differences in sensitivity among individuals, with each individual having a different threshold concentration. A more sensitive individual will die at lower Cd concentrations, which leads to an underestimation of the survival rate at low Cd concentrations.
| GUTS–SD | GUTS–IT | ||||||
|---|---|---|---|---|---|---|---|
| Metal | Parameter | Average | Q2.5 | Q97.5 | Average | Q2.5 | Q97.5 |
| Cd | kd × 10–3 | 770.2 | 194.9 | 1118 | 20.55 | 8.808 | 33.87 |
| hb × 10–4 | 1.675 | 0.114 | 7.594 | 0.822 | 0.045 | 5.494 | |
| Zw or α | 0.127 | 0.065 | 0.197 | 0.416 | 0.229 | 0.588 | |
| Pb | kd × 10–3 | 98.900 | 24.360 | 122.600 | 3.590 | 2.332 | 5.606 |
| hb × 10–4 | 3.700 | 0.100 | 10.100 | 1.266 | 0.055 | 8.391 | |
| Zw or α | 0.769 | 0.349 | 0.918 | 1.176 | 0.927 | 1.506 | |
- Q2.5 = 2.5% quantile; Q97.5 97.5% quantile; kd = discharge rate; hb = background hazard rate; Zw = no-effect concentration; a = median effect concentration.
For the Pb treatments, the Zw in the GUTS–stochastic death model and the α in the GUTS–IT model were 0.77 and 1.18 mg/L, respectively, indicating a difference in survival rate prediction between GUTS–stochastic death and GUTS–IT. In GUTS–stochastic death, when the concentration in the body was lower than 0.77 mg/L, the zebrafish remained alive. However, in GUTS–IT, when it reached 1.18 mg/L, death occurred.
The survival rates of zebrafish at external concentrations of 0 and 0.10 mg/L Cd were adequately estimated by the GUTS–stochastic death model (Figure 4A). For the other exposure concentrations, all survival rates fit well except for the rate at 48 h. As shown in Figure 4B, the survival rate was underestimated at 0.10 mg/L Cd by the GUTS–IT model, yet overestimated at the remaining exposure concentrations except for 1 and 2 mg/L Cd at 24 h.
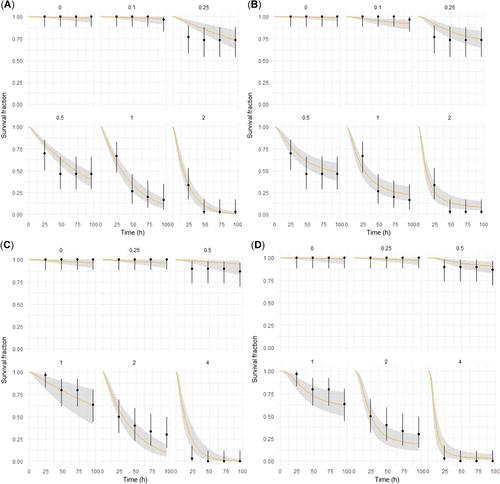
Comparison of the observed and fitted values by using different general unified threshold (GUTS) models with different levels of cadmium (Cd) and lead (Pb). (A) GUTS–stochastic death (SD) exposed to Cd. (B) GUTS–individual tolerance (IT) exposed to Cd. (C) GUTS–SD exposed to Pb. (D) GUTS–IT exposed to Pb.
The GUTS–stochastic death model underestimated the survival rate at 0 mg/L Pb (Figure 4C), because the hb rate of Pb was not 0 (Table 2). The effective concentration was 0.77 mg/L, and, if the internal concentration in the organism was below the threshold concentration, the predicted survival rate was equal to that in the control treatment. Hence, the predicted survival rate was equivalent across the Pb exposure concentrations of 0, 0.25, and 0.50 mg/L. However, no death occurred at the 0.50 mg/L Pb concentration, which caused overestimation of the survival rate at this concentration by the GUTS–stochastic death model. Survival rate fit perfectly when the external concentration was 1 mg/L Pb, but was underestimated and overestimated at 2 and 4 mg/L Pb exposure concentrations, respectively. For the GUTS–IT model simulation, as shown in Figure 4D, survival rate fit perfectly at 0 and 0.25 mg/L Pb concentrations. However, survival rate was overestimated at 0.50 and 4 mg/L Pb, and underestimated at 1 and 2 mg/L Pb.
Fitted performance of the GUTS model was higher for the Pb treatments than for the Cd treatments. Moreover, the fitted performance of GUTS–stochastic death (R2 = 0.94; RMSE = 0.09) was comparable to that of the GUTS–IT model (R2 = 0.94; RMSE = 0.09) for the Cd treatments, whereas for the Pb treatments, the fitted performance of GUTS–IT (R2 = 0.96; RMSE = 0.07) was better than that of GUTS–stochastic death (R2 = 0.94; RMSE = 0.09). It is noteworthy that there was little difference in fitted performance between the dose–response and GUTS models, which had similar R2 and RMSE values (Figures 3 and 5).
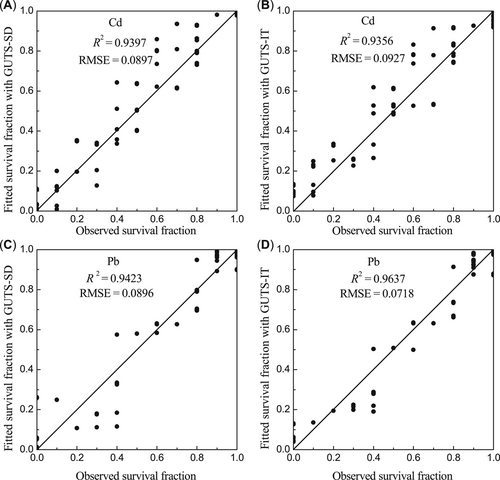
The fitted performance of the general unified threshold (GUTS) model in different treatments. R2 = the coefficient of determination for the solid lines, the 1:1 lines between predicted and observed values; RMSE = the root square standard error of the 1:1 line. (A) GUTS–stochastic death (SD) in cadmium (Cd) treatments. (B) GUTS–individual tolerance (IT) in Cd treatments. (C) GUTS–SD in lead (Pb) treatments. (D) GUTS–IT in Pb treatments.
DISCUSSION
The LC50 in zebrafish decreased gradually as exposure time increased in both Cd and Pb treatments; the same pattern has probably been found in other organisms and under different exposure scenarios, as observed for Gammarus pulex exposed to propiconazole (Nyman et al. 2012). We also noted that the magnitude of LC50 exposed to Pb and Cd treatments was Cd < Pb, which was inconsistent with the findings of Smith et al. (2015). This difference between studies might be due to species specificity in metal uptake. Accordingly, the Cd toxicity to zebrafish was stronger than that of Pb toxicity, indicating greater resistance to Pb than to Cd in the zebrafish. Furthermore, this result indirectly suggests that the no-effect concentration (Z) or median effect concentration (α) of Pb was higher than that of Cd, which was consistent with our results using the GUTS–stochastic death or GUTS–IT models. However, the quantitative relevance of LC50 and the no-effect concentration (Z) or median effect concentration (α) needs further investigation. In addition, the parameters Kd and b were derived by dose-response model and GUTS model, respectively, for Pb and Cd exposures. Our results show that the discharge rate (Kd) of zebrafish exposed to Cd (GUTS–stochastic death: 0.77; GUTS–IT: 0.02) was higher than that of fish exposed to Pb (GUTS–stochastic death: 0.10; GUTS–IT: 0.01), suggesting that Pb was higher in the body of the zebrafish, and indirectly indicating that the effect strength (b) of Pb was stronger than that of Cd. Moreover, the effect strength (b) of Pb was strongest at 72 h, whereas that of Cd was strongest at 24 h, possibly because of different Cd and Pb metabolism in zebrafish. However, the underlying effect mechanism requires investigation.
Our results showed that the data requirements were identical for both the dose–response and GUTS models. Evaluation of the quality of model predictions should be performed from both qualitative and quantitative perspectives. Qualitatively, the overall response pattern in the data was matched by the model outputs (Figures 2 and 4). Quantitatively, the goodness-of-fit of the observed and fitted values was evaluated based on R2 and RMSE, which were compared among the different models. The goodness-of-fit of the GUTS models was slightly smaller than that of the dose–response model. This difference was possibly due to the deviation between the observed and fitted values, which was mainly caused by the dominant parameters of the GUTS model (Kd, Z, or α) that had been correlated for laboratories and had an influence on the survival rate over time (Baudrot et al. 2018). However, compared with the dose–response model, the GUTS models had higher predictive ability, which could be extrapolated to predict the survival rate of organisms under other conditions (Ashauer and Escher 2010). Pollutant exposure conditions in the real environment are more complex than those in the laboratory; for example, pulse exposure (Nyman et al. 2012) and multiple metal exposures (Gao et al. 2016) occur in nature. In addition, the dose–response model can fit the survival rate at a given time, but cannot fit the survival rate at another time. However, the GUTS model can not only model the survival rate at a certain time, but can also simulate survival rate at another time based on survival rate at that time, and there would be no need for animals in toxicity testing of metals at another time (Forfait-Dubuc et al. 2012). Considering that animal testing costs €10 billion every year and uses more than 100 million animals, it has been recommended that animal testing be reduced as much as possible (Hartung 2009). The GUTS models had a greater ability than the dose–response model to predict toxicity. Moreover, the dose–response model is empirical, with no information on mechanisms of toxic action, whereas the GUTS model incorporates some mechanistic understanding (Brock et al. 2010; Baudrot et al. 2018).
The current paradigm of GUTS for most metals is spillover, in which metals are bound by metal-binding proteins to a threshold, above which free metals spill over into the cell and cause toxicity (Morcillo et al. 2016). Whereas the metal-binding proteins can be measured with current technology, free metals in the body cannot yet be distinguished and individually measured. The threshold estimated quantitatively by the GUTS model can approximately reflect the mechanism underlying mortality (Ashauer et al. 2015). Thus the GUTS model has greater potentiality for toxicity prediction than the dose–response model.
CONCLUSIONS
The present study demonstrated that Pb toxicity to zebrafish is stronger than Cd toxicity. For either the Pb or Cd treatments, we found that the data requirements were identical for both the dose–response and GUTS models. In addition, there was a negligible difference between the GUTS models and the dose–response model in simulating survival rate. Moreover, compared with the dose–response model, the GUTS model can be extrapolated to predict the survival rate of organisms at any time. The data requirements, fit performance, and applicability indicate that the GUTS model has greater potential than the dose–response model for the prediction of metal toxicity.
Acknowledgment
The present study was supported by the National Nature Science Foundation of China (grant 41877498) and the National Water Pollution Control and Treatment Science and Technology Major Project (grant 2017ZX07301002).
Open Research
Data Accessibility
Data pertaining to this article are located at figshare at DOI: 10.6084/m9.figshare.7581497.


