Corrigendum
McManus P, Hortin J, Anderson AJ, Jacobson A, Britt D, Stewart S, McLean JE. 2018. Rhizosphere interactions between copper oxide nanoparticles and wheat root exudates in a sand matrix: influences on copper bioavailability and uptake. Environ Tox Chem 37:2619-2632. DOI:10.1002/etc.4226.
The authors of the above-noted paper hereby submit the following corrections.
The literature values for complexes of H, Cu, Fe, Ca, and other transition metals with 2’-deoxymugineic acid (DMA) and gluconate were entered into the MINTEQ database as the reported conditional stability constants Kc, instead of the appropriate activity based values, K°. The log Kc values were not presented in the paper but are presented in McManus’ thesis (McManus 2016). The values listed in Table 1 are the corrected activity based values to be used in the model.
| Complex | log Kc | log K° | Reference | Complex | log Kc | log K° | Reference |
|---|---|---|---|---|---|---|---|
| HGluconate | 3.66 | 3.87 | Bechtold et al. (2002) | CaFeGluconate(OH) | 13.89 | 14.53 | Bechtold et al. (2002) |
| CuGluconate | 2.51 | 2.94 | Gajda et al. (1998) | CaFeGluconate(OH)2 | 11.21 | 12.49 | Bechtold et al. (2002) |
| CuGluconate(OH)3 | −20.96 | −20.53 | Gajda et al. (1998) | CaFeGluconate(OH)3 | 7.13 | 8.84 | Bechtold et al. (2002) |
| CuGluconate2 | 4.59 | 5.13 | Gajda et al. (1998) | CaFeGluconate(OH)4 | −0.99 | 0.93 | Bechtold et al. (2002) |
| CuGluconate2(OH) | −0.6 | −0.06 | Gajda et al. (1998) | CaFeGluconate(OH)5 | −11.01 | −9.09 | Bechtold et al. (2002) |
| CuGluconate2(OH)2 | −8.28 | −7.96 | Gajda et al. (1998) | MgGluconate | 0.7 | 1.21 | Cannan and Kibrick (1938) |
| Cu2Gluconate2(OH)3 | −7.25 | −6.07 | Gajda et al. (1998) | BaGluconate | 0.95 | 1.46 | Cannan and Kibrick (1938) |
| Cu2Gluconate2(OH)4 | −15.46 | −14.50 | Gajda et al. (1998) | ZnGluconate | 1.7 | 2.21 | Cannan and Kibrick (1938) |
| FeGluconate | 10.51 | 11.15 | Bechtold et al. (2002) | CaGluconate | 1.80 | Pallagi et al. (2010) | |
| FeGluconate(OH) | 9.03 | 10.10 | Bechtold et al. (2002) | CaGluconate(OH) | 2.82 | 3.43 | Pallagi et al. (2014) |
| FeGluconate(OH)2 | 6.35 | 7.63 | Bechtold et al. (2002) | Ca2Gluconate(OH)3 | 8.04 | 9.26 | Pallagi et al. (2014) |
| FeGluconate(OH)3 | 1.78 | 3.06 | Bechtold et al. (2002) | Ca3Gluconate2(OH)4 | 12.44 | 14.17 | Pallagi et al. (2014) |
| FeGluconate(OH)4 | −8.4 | −7.33 | Bechtold et al. (2002) | ZnGluconate(OH) | 8.14 | 8.14 | Pallagi et al. (2014) |
| FeGluconate2 | 22.23 | 23.30 | Bechtold et al. (2002) | Cu-DMA | 18.7 | 19.98 | Murakami et al. (1989) |
| FeGluconate2(OH) | 18.22 | 19.50 | Bechtold et al. (2002) | Fe-DMA | 18.38 | 20.31 | Murakami et al. (1989) |
| FeGluconate2(OH)2 | 15.3 | 16.58 | Bechtold et al. (2002) | Fe-DMA-OH | 16.25 | 18.18 | Murakami et al. (1989) |
| FeGluconate2(OH)3 | 9.84 | 10.91 | Bechtold et al. (2002) | Ca-DMA | 3.34 | 4.62 | Murakami et al. (1989) |
| FeGluconate2(OH)4 | −1.15 | −0.51 | Bechtold et al. (2002) | Mn-DMA | 8.29 | 9.68 | Murakami et al. (1989) |
| FeGluconate2(OH)5 | −20 | −20.01 | Bechtold et al. (2002) | Ni-DMA | 14.78 | 16.06 | Murakami et al. (1989) |
| Fe2Gluconate2(OH)7 | −1.42 | 0.50 | Bechtold et al. (2002) | Zn-DMA | 12.84 | 14.12 | Murakami et al. (1989) |
| CaFeGluconate2 | 20.96 | 21.60 | Bechtold et al. (2002) | H-DMA | 9.55 | 10.19 | von Wiren et al. (1999) |
| CaFeGluconate2(OH) | 22.47 | 23.75 | Bechtold et al. (2002) | H2-DMA | 17.33 | 18.40 | von Wiren et al. (1999) |
| CaFeGluconate2(OH)2 | 19.06 | 20.77 | Bechtold et al. (2002) | H3-DMA | 20.73 | 22.01 | von Wiren et al. (1999) |
| CaFeGluconate2(OH)3 | 14.82 | 16.74 | Bechtold et al. (2002) | H4-DMA | 23.45 | 24.73 | von Wiren et al. (1999) |
| CaFeGluconate2(OH)4 | 6.65 | 8.57 | Bechtold et al. (2002) | H5-DMA | 25.38 | 26.45 | McManus (2016) |
| CaFeGluconate2(OH)5 | −2.63 | −0.92 | Bechtold et al. (2002) | CaFeGluconate | 16.26 | 16.04 | Bechtold et al. (2002) |
Additionally, the appropriateness of allowing precipitation in the geochemical models was reconsidered. We were initially modeling the dissolution and precipitation of copper oxide nanoparticles (CuONPs) in the presence of wheat exudates as influenced by the NP concentration. When modeling the distribution of Cu complexes we continued with allowing precipitation. The main effect of this decision was that 99%+ of the soluble Al precipitated; no other component was affected. While we believe this choice can be justified for our paper, we have included model results with no precipitation to explicitly model only the soluble phase of the pore water.
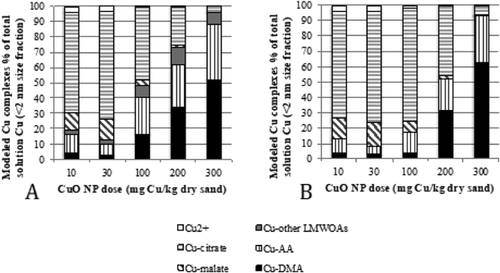
We have reanalyzed our data with the appropriate K° values for DMA and gluconate complexes and disallowing precipitation. The distribution of the complexed Cu does change, most noticeably a lack of Cu complexation with gluconate (included in the figures as Cu-other low–molecular weight organic acids [LMWOAs]) across the 5 NP doses (comparing Figure 1A, the original model results to Figure 1B). Using K° values, gluconate is now 100% complexed with Ca. In the 100 mg/kg dose, Cu-citrate complexation also notably increased. The main conclusion of the dominance of Cu complexation with citrate and malate at low dosing and DMA at high dosing however remains unchanged.

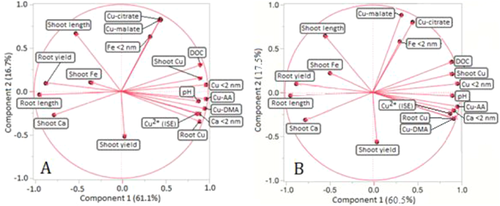
The principal component analysis of factors contributing to wheat plant uptake of Cu and resulting bioresponse was reanalyzed using the Cu complex distribution from MINTEQ with K° constants. There were limited differences in the PCA (Figure 2) and correlation matrices (Tables 2 and 3) using K° values. However, the overall conclusions are unchanged.

| Cu2+ μg/L | CU<2 μg/L | Cu-DMA μg/L | Cu-AA μg/L | Cu-citrate μg/L | Cu-malate μg/L | Cu shoot mg/kg | Cu root mg/kg | Root length cm | Shoot length cm | Root yield g | Shoot yield g | |
|---|---|---|---|---|---|---|---|---|---|---|---|---|
| Cu shoot mg/kg | 0.704 | 0.895 | 0.836 | 0.875 | 0.552 | 0.489 | 1.000 | 0.828 | −0.850 | −0.295 | −0.697 | −0.139 |
| Cu root mg/kg | 0.844 | 0.836 | 0.923 | 0.900 | 0.100 | 0.086 | 0.828 | 1.000 | −0.846 | −0.627 | −0.830 | 0.123 |
| Root length cm | −0.809 | −0.931 | −0.909 | −0.922 | −0.447 | −0.479 | −0.850 | −0.846 | 1.000 | 0.432 | 0.812 | −0.061 |
| Shoot length cm | −0.651 | −0.503 | −0.669 | −0.609 | 0.281 | 0.311 | −0.295 | −0.627 | 0.431 | 1.000 | 0.446 | −0.333 |
| Root yield g | −0.782 | −0.809 | −0.844 | −0.833 | −0.242 | −0.328 | −0.697 | −0.830 | 0.812 | 0.446 | 1.000 | −0.091 |
| Shoot yield g | 0.152 | 0.038 | 0.151 | 0.094 | −0.322 | −0.233 | −0.139 | 0.123 | −0.061 | −0.333 | −0.091 | 1.000 |
- a Numbers in bold are correlation coefficients that are significant (α = 0.05). Italicized numbers indicate no significant relationships between those factors. Correlation was estimated using row-wise comparisons. This table is as depicted in Table 1 of the manuscript using Kc values for DMA and gluconate and allowing precipitation.
- DMA = deoxymugineic acid; AA = amino acids.
| Cu2+ μg/L | CU<2 μg/L | Cu-DMA μg/L | Cu-AA μg/L | Cu-citrate μg/L | Cu-malate μg/L | Cu shoot mg/kg | Cu root mg/kg | Root length cm | Shoot length cm | Root yield g | Shoot yield g | |
|---|---|---|---|---|---|---|---|---|---|---|---|---|
| Cu shoot mg/kg | 0.704 | 0.895 | 0.783 | 0.846 | 0.568 | 0.501 | 1.000 | 0.828 | −0.850 | −0.295 | −0.697 | −0.139 |
| Cu root mg/kg | 0.844 | 0.836 | 0.938 | 0.924 | 0.133 | 0.050 | 0.828 | 1.000 | −0.846 | −0.627 | −0.830 | 0.123 |
| Root length cm | −0.809 | −0.931 | −0.874 | −0.909 | −0.492 | −0.300 | −0.850 | −0.846 | 1.000 | 0.432 | 0.812 | −0.061 |
| Shoot length cm | −0.651 | −0.503 | −0.722 | −0.661 | 0.214 | 0.395 | −0.295 | −0.627 | 0.431 | 1.000 | 0.446 | −0.333 |
| Root yield g | −0.782 | −0.809 | −0.841 | −0.844 | −0.263 | −0.182 | −0.697 | −0.830 | 0.812 | 0.446 | 1.000 | −0.091 |
| Shoot yield g | 0.152 | 0.038 | 0.2011 | 0.138 | −0.285 | −0.416 | −0.139 | 0.123 | −0.061 | −0.333 | −0.091 | 1.000 |
- a Numbers in bold are correlation coefficients that are significant (α = 0.05). Italicized numbers indicate no significant relationships between those factors. Correlation was estimated using row-wise comparisons. Values determined using Ko values for DMA and gluconate and no precipitation.
Changes to model input as described here does not alter the discussion or conclusions of the paper. But, for thoroughness of data analysis and for potential users of the reported K° values for input to geochemical models, this corrigendum has been provided.


