Linking hydrology and sediment dynamics of large alluvial rivers to landscape diversity in the Ganga dispersal system, India
Abstract
Discharge and sediment load data for several stations along the Ganga River and its major tributaries in the western Ganga plains (WGP) for a period of ~30 years have been analysed to understand the hydrological characteristics and sediment dynamics. In terms of hydrology, the rivers are less flood-prone than believed, exceeding bankfull discharges less frequently than the expected 1.5 year return interval. This has been attributed to the rivers of this region occupying incised valleys formed in the Late Quaternary period. Rivers draining the WGP are supply-limited systems compared to those draining the eastern Ganga plains (EGP) which have been characterized as transport-limited systems. We suggest that such geomorphic diversity as a function of spatial variability in precipitation regime and hinterland geology has existed for at least the Late Quaternary period and they in turn influence the modern day hydrology of the river systems in a significant way. Copyright © 2016 John Wiley & Sons, Ltd.
Introduction
Hydrology and sediment transport of large rivers in foreland settings are strongly influenced by orographic precipitation and upstream processes of sediment generation (Hovius, 1998; Ashworth and Lewin, 2012; Fielding et al., 2012) that in turn influence the river morphology in a major way (Arnell, 1996; Knighton, 1998; Latrubesse et al., 2005; Church, 2006; Latrubesse, 2008). It has been suggested that the large alluvial rivers adjust their channel and floodplain dimensions depending on the range of flows that are capable of mobilizing sediments from the hinterland, river beds, banks and floodplains and maintain channel geometry (Sinha and Friend, 1994; Allison et al., 1998; Dunne et al., 1998; Goodbred and Kuehl, 1999; Meade, 2007; Tandon and Sinha, 2007). In large rivers systems, climatic variability and geological characteristics of the hinterland create significant variability in hydrological characteristics of the system depending upon the geomorphic connectivity of different stretches of the river (Brierley et al., 2006; Stanford, 2006; Jain and Tandon, 2010) and the differential landscape sensitivity of the system to forcing functions (Brunsden and Thornes, 1979; Church, 2002; Sinha et al., 2005). Such differences in geomorphic processes are often manifested in river form and therefore significant geomorphic diversity from source to sink in large river systems (Goodbred, 2003; Sinha et al., 2005).
The Ganga is a large river system with high sediment supply and water discharge (Abbas and Subramanian, 1984; Sinha and Friend, 1994; Jain and Sinha, 2004; Roy and Sinha, 2007, 2014) and there are large spatial and temporal variations recorded across the basin in terms of hydrological characteristics of the rivers (Sinha et al., 2005). A genetic classification of Ganga plain rivers (Sinha and Friend, 1994) shows that the discharge and sediment load of the ‘mountain-fed’ rivers are an order of magnitude higher than ‘foot-hills-fed’ and ‘plains-fed’ rivers. It has also been documented that the rivers draining the eastern plains are also more dynamic and flood-prone compared to their western counterparts (Sinha, 1998; Sinha and Jain, 1998). Compared to the rivers in the eastern Ganga plains (EGP), those in the western Ganga plains (WGP) are much less understood in terms of their hydrological behaviour and sediment transport characteristics (Roy and Sinha, 2007, 2014) and their influence on geomorphology and landscape evolution.
This paper aims to investigate the hydrological characteristics of the Ganga River and its tributaries in the WGP for their variability at both temporal and spatial scales. We primarily test the hypothesis that the geomorphic diversity across the large Gangetic alluvial plains has evolved due to long-term climate-driven hydrological processes and this diversity in turn influences the modern-day hydrology of river systems in a significant way. We have made use of flow duration analysis and flood frequency analysis to gain insights to the hydrological processes and flood characteristics. Discharge–sediment inter-relationships and sediment budgeting have been used to characterize the sediment transport regime and landscape evolution in the WGP.
Study Area and Data Availability
The present study is on parts of the western or upper Ganga plains, which extends for about 300 km from the foothills of the Himalaya to the hills of peninsular India to the south. We have analysed the reach of the Ganga River between Farrukhabad and Kanpur (Figure 1). Further, the Ramganga is a major tributary of the Ganga River in the study window which originates in the Higher Himalaya and meets the Ganga 10 km upstream of Kannauj. The Garra, the Kali and the Isan are the other tributaries meeting the Ganga downstream of Kannauj. The Garra rises from a lake fed by glacier melt at a location ~135 km north of Fatehgarh and joins the Ganga ~10 km downstream of the Ganga–Ramganga confluence. The Kali is a much smaller, plains-fed river rising 250 km northwest of Fatehgarh and flowing almost east–west before joining the Ganga about 24 km downstream of Kannauj.
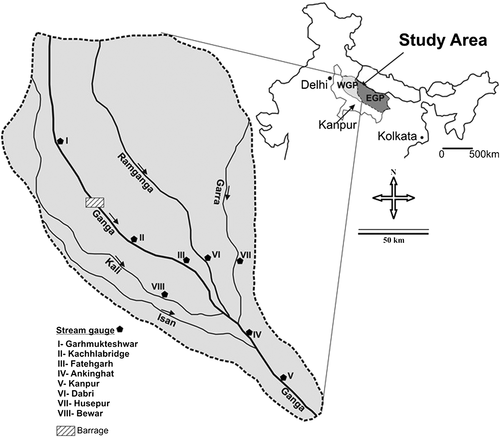
Physiographically, the study area forms an alluvial plain with a prominent valley margin of the Ganga and Ramganga Rivers. The major rivers in the study area flow through incised valleys which are 5–15 km wide and separated from each other by a wide interfluve (~70 km wide). The interfluve described here is an upland area at an altitude ~10–20 m from active channel surface. The interfluve is drained by smaller channels which rework older interfluve sediments (Gibling et al., 2005; Tandon et al., 2006; Sinha et al., 2007). The major rivers do not show any signature of inundation presently, and their floods are retained within the valleys. Minor plains-fed rivers are also incised.
Most parts of the study area experience monsoonal rainfall of about 60 to 80 cm/yr. The hinterland of the Ganga receives >200 cm/yr and that of the Ramganga receives 160–180 cm/yr. Most of this rainfall is concentrated during July–September of each year, while the rest of the year is dry or has little rainfall. The winter temperature varies from 2 to 15 °C, the summer temperature from 25 to 45 °C (Singh, 1994).
Hydrological data from six stations along the Ganga are available from the Central Water Commission (CWC), Government of India (Figure 1, Table 1). The CWC measures discharge at all stations on a daily basis but only monthly average discharge data is available for this work. Although daily discharge data are not available, the variation of average daily discharge with respect to mean monthly discharge is generally quite low and hence these data are good for observing the long-term trends. Suspended sediment data were obtained as monthly total load from 1987 to 2001. Suspended sediment data is measured by CWC using standard filtration method for three size fractions namely, coarse (> 0.2 mm), medium (0.2–0.075 mm) and fine (< 0.075 mm). Although no separate bedload data are measured by CWC at any of these stations, the coarse plus medium fractions of the suspended load correspond to medium sand and fine plus very fine sand on the Udden–Wentworth scale. Therefore, as a first approximation, coarse plus medium fraction of suspended load can be interpreted as temporarily suspended bedload (Sinha and Friend, 1994). The fine fraction of the suspended load corresponds to silt plus clay, and we can interpret this as wash load or long-term suspended load. All hydrological parameters are measured by CWC on a daily basis and are duly checked by the competent engineer at site.
| River | Stations | Discharge data | Sediment data |
|---|---|---|---|
| Ganga | Garhmukteswar | Monthly average discharge (1970–2001)
Peak discharge (1976–2003) |
Monthly total suspended load (1988–2001) |
| Kachhlabridge | Monthly average discharge (1987–2002)
Peak discharge (1976–2003) |
-do- | |
| Fatehgarh | Monthly average discharge (1970–2001)
Peak discharge (1976–2003) |
-do- | |
| Ankinghat | -do- | -do- | |
| Kanpur | -do- | -do- | |
| Ramganga | Dabri | Monthly average discharge (1987–2002)
Peak discharge (1987–2001) |
-do- |
| Garra | Husepur | Monthly average discharge (1987–2002)
Peak discharge (1987–1999) |
-do- |
| Kali | Bewar | Monthly average discharge (1971–2003)
Peak discharge (1971–2003) |
-do- |
Analytical Methods
 (1)
(1) (2)
(2) is the mean peak annual discharge for several years (n), σ is the standard deviation of variable x and K is a frequency factor that depends upon return period and assumed frequency distribution (Gumbel's distribution). The xT is the value of random annual peak discharge with return period T, where T is an interval of time within which a flood of given size will occur as an annual maximum, defined as:
 (3)
(3)Analysis of Streamflow Characteristics
Mean flow characteristics
Mean flow of the rivers is a basic discharge parameter that is measured at site on a daily basis and then averaged over a period of months to get mean monthly discharge. Mean monthly discharge was used for annual hydrograph analysis and for flow duration analysis for a period of approximately 30 years.
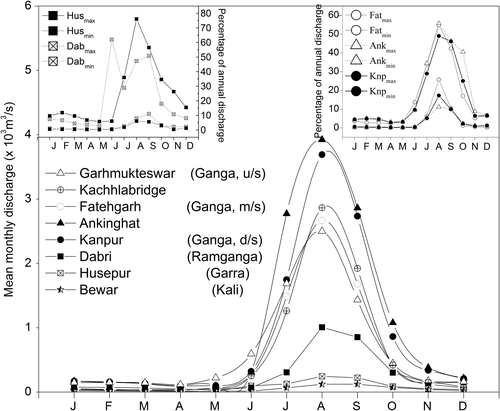
Annual discharge hydrographs for each site along the Ganga, Ramganga, Garra and Kali Rivers have single peaks that begin to rise in June, peak in August and then start to decline, typical of a monsoonal regime (Figure 2). The dispersion of discharge values during each month has been plotted as percentage of maximum and minimum of annual flows over the total period of records (Figure 2, inset). The largest dispersion of annual discharge occurs in the month of August and minimum during February to May. The dispersion of flow is quite large even in small tributaries suggesting prominent monsoonal influence.
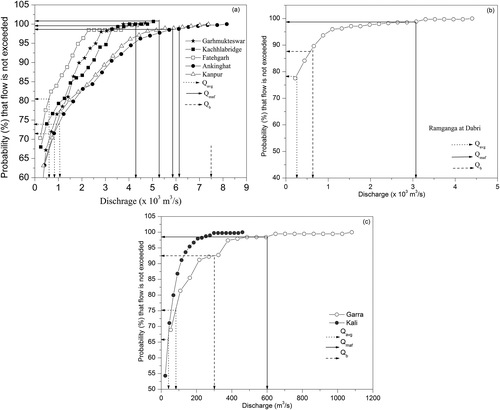
Flow duration curves (FDCs) primarily show the percentage of time for which a given mean monthly discharge was not equalled or exceeded. FDCs for each site along the Ganga are characterized by a steep slope at the beginning and a gentle slope at higher discharges (Figure 3a). They show a steeper slope for the sites (Garhmukteswar, Kachhlabridge and Fatehgarh) upstream of the Ganga–Ramganga confluence as compared to the downstream sites (Ankinghat and Kanpur). This demonstrates that discharge is highly variable at downstream sites and this can be attributed to the tributary influence. It is noted that only 20–30% of the monthly flows exceeded the mean annual flow over the period of record in the Ganga River (dotted arrows in Figure 3a). It is also noted that there is ~90% chance that the Ganga at this reach cannot exceed its discharge beyond mean annual flood. In addition, the discharge of the Ganga rarely reaches its bankfull capacity. This suggests that the river reach in the study area is not really flood prone. The chances of flooding every two years are only 10%. The Ramganga shows a slightly different flow duration curve (Figure 3b). A much flatter curve near the upper limit might indicate regulation of flood with reservoir storage due to the presence of the Ramganga dam in the upstream of study area near Moradabad. Flow duration curves of smaller rivers (Garra and Kali, Figure 3c) are much steeper than those of the larger rivers (Ganga and Ramganga), suggesting that flows through these rivers are low most of the time, i.e. they are seasonal rivers. They are expected to have higher flow variability because these are essentially monsoon-fed systems and these rivers have relatively much higher discharge for 10 to 20% of the time.
Extreme flow characteristics
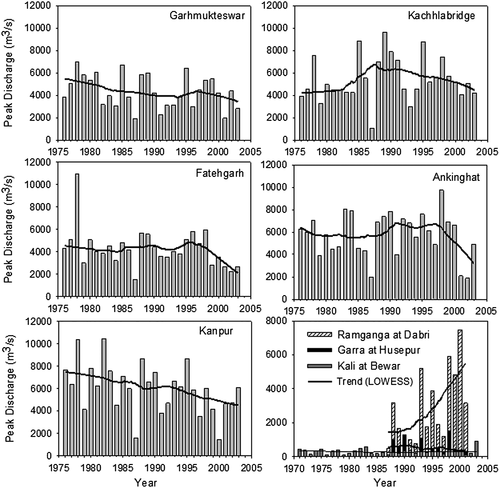
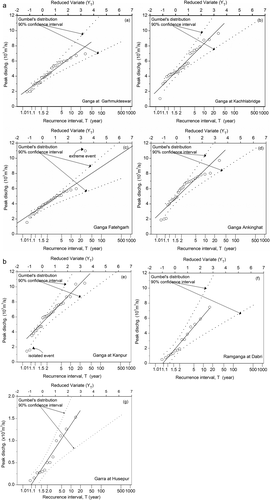
Peak flow is the observed highest daily recorded discharge in each year. The general trend of peak discharge shows monotonic decrease both at upstream and downstream stations of the Ganga without any discrete jump (Figure 4). Characteristics of peak flow records are demonstrated by flood frequency analysis, flood intensity and flood variability studies. Flood frequency estimates are presented as a set of peak flows and the corresponding exceedance probabilities or recurrence interval. Unlike FDCs, the extreme/peak flow probabilities are represented here instead of mean flow. Exceedance probability of a peak flow is the probability of that flow being equal or exceeded in a one-year period. The recurrence interval of a peak flow is the number of years, on average, in which the specified flow is expected to be equalled or exceeded one time. Flood–frequency plot for each station shows a good fit to a Gumbel probability distribution for all WGP rivers (Figure 5). The discharge parameters such as mean annual flood, most probable flood and maximum probable flood were estimated from the flood frequency regression curve (Table 2). It can be noticed that at Fategarh, the largest observed peak (10 974 m3/s, 1976 flood) on the record of 28 years was a highly anomalous event and indeed crossed the bankfull level (Table 2). The point deviates sharply on the flood–frequency plot generated from other recorded data. This is an outlier point, plots beyond the 90% confidence interval, and therefore is excluded from the linear regression model. At all other stations all the observed peak discharge values fall within the 90% confidence interval. The 90% confidence interval provides a measure of the certainty of the flow at a selected return period. So the outlier point at Fatehgarh is an unexpected event as per the present model. However, this unexpected event might have a particular cycle or recurrence interval, which cannot be demonstrated based on the present length of record. The largest observed peak (14 070 m3/s, 1961) of the Ganga at Kanpur between 1961 and 2010 is in agreement with 100-year flood estimate predicted from flood–frequency linear regression model in the present study. However, the prediction of 100-years (and even 500-year) flood estimate is still lower than the largest observed peak discharge. This reflects that the largest observed peak discharge either has higher recurrence interval or our flood prediction model needs further adjustment to this observed record. The 100-year flood estimate was found to have the largest uncertainty at Dabri on the Ramganga than any other rivers. The highest uncertainty at Dabri can be attributed to significant variability in observed peak discharge record.
| River | Stations | Catchment area (km2) | Mean Qannual (m3/s) | Qbankful (m3/s) | Qmaf (m3/s) | Qmpf (m3/s) | Qmxpf (m3/s) | Qmod (m3/s) | Mean ± SD of peak discharge | |
|---|---|---|---|---|---|---|---|---|---|---|
| DL = BFL | T = 1.5 | |||||||||
| Ganga | Garhmukteswar | 29 709 | 660 | 6940 | 3800 | 4366 | 10851 | 16858 | 6940 | 4302 ± 1600 |
| Kachhla bridge | 33 446 | 659 | — | 4500 | 5383 | 13326 | 20683 | 9644 | 5305 ± 1872 | |
| Fatehgarh | 40 096 | 576 | 7682 | 2880 | 4384 | 11360 | 17823 | 10,974 | 4315 ± 1720 | |
| Ankinghat | 82 209 | 1015 | 9720 | 4400 | 5828 | 13691 | 20974 | 9,720 | 5750 ± 1939 | |
| Kanpur | 87650 | 895 | 10482 | 4400 | 6150 | 15088 | 23383 | 14 070 | 6043 ± 2208 | |
| Ramganga | Dabri | 23919 | 274 | 4282 | 1400 | 3050 | 13302 | 21009 | 10 987 | 2913 ± 2123 |
| Garra | Husepur | 6155 | 82 | 303 | 300 | 620 | 2930 | 4648 | 1862 | 589 ± 452 |
| Kali | Bewar | 8495 | 44 | — | 236.23 | 333 | 975 | 1570 | — | 327 ± 161 |
- Note: DL, danger level; T, return period.
- Mean monthly discharge represents average of daily discharge for the whole month.
- Mean annual discharge represents average of daily discharge for the whole year.
- Annual mean discharge (Qannual), average of annual discharge for the period of observation.
- Seasonal mean discharge, average of daily discharge over a length of particular season in a year.
- Peak discharge (Qmax), maximum discharge recorded on a particular day in a year, with standard deviation (SD).
- Bankfull discharge (Qbankful), discharge which just fills the channel cross-section.
- Maximum observed discharge (Qmod ), highest peak discharge during a period of observation.
- Most probable flood (Qmpf ), peak discharge corresponding to a return period of 1.58 yr.
- Mean annual flood (Qmaf), peak discharge corresponding to a return period of 2.33 yr.
- Maximum probable flood (Qmxpf ), peak discharge corresponding to a return period of 10 000 yr.
Maximum and minimum daily discharge in a year can be used to show discharge variability at each site. The ratio Qmax/Qmin can be defined as an index of annual discharge variability and the ratio Qmax/Qmaf as the flood intensity of the stream (Latrubesse et al., 2005). It is observed that all rivers show a larger scatter in terms of discharge variability rather than flood intensity (Figure 6). Annual discharge variability is high in all rivers, which is essentially a reflection of the monsoonal regime. High discharge variability of this perennial mountain-fed river system can be attributed to local channel geometry and water usage pattern in the surrounding region (Sinha, 2005). Most of the Qmax/Qmaf values fall below one; a few are little above one but always below three, which indicates almost no flooding.
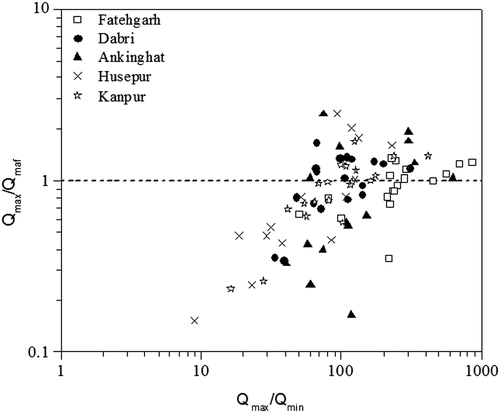
The ‘danger water level’ marked at each stream gauge is taken as bankfull discharge level as per the convention followed by the CWC. Based on stage–discharge relation the bankfull discharge of each site was measured (Table 2). Channel bankfull discharge of the Ganga corresponds to a recurrence interval of 5 to 7.5 year return periods. In general a bankfull discharge of a river is considered as 1.5 years return discharge (Leopold et al., 1964; Dury, 1973; Woodyer, 1968; Hey, 1998), based on flood–frequency plot. Our data suggests that the 1.5 years flood discharges are almost half of the actual channel bankfull discharge. The probable reason is that channels are deeply incised, and therefore, they have large flow capacity before overtopping the bank. Thus 1.5 year return discharge is not enough to fill these incised river channels.
Sediment Transport Characteristics
Bedload in the alluvial reaches of the Gangetic rivers mainly consists of fine to very fine sand for mountain-fed rivers and very fine sand for plains-fed rivers (Sinha and Friend, 1994). The suspended load mainly consists of very fine sands, silt and clay. The suspended load measured by the CWC consists of three size ranges: coarse (> 0.2 mm), medium (0.2–0.075 mm) and fine (< 0.075 mm). Coarse and medium size fractions are essentially ‘suspended bedload’ whereas fine fraction represents the wash load. Table 3 presents the data on suspended load in different size fractions carried by the different rivers in the study area and Table 4 shows the seasonal variation in sediment concentrations at these stations. It is noticeable that all stations have a high wash load fraction in the suspended sediments and show high sediment concentration during the monsoon. Monthly wash load in the alluvial plain is an order of magnitude higher than the wash load in the upper part of the catchment (e.g. Haridwar, Rishikesh, unpublished data). It is obvious therefore that the river picks up most of the wash load in the alluvial plains either through sheet wash or bank erosion and rigorous reworking of smaller channels (Sinha and Friend, 1994). It is not easy to interpret the actual mechanism for these additional sources of ‘wash load’ in the alluvial plain but this can be speculated based on a few observations. For instance, the seasonal variation of sediment at all hydrological stations shows high sediment concentration during monsoon, which is firstly due to increased water discharge during monsoon. Secondly, heavy and intense rainfall (700 mm/yr) observed in the recorded data and largely agricultural land in the alluvial plains would generate extensive sheet wash and also cause bank erosion. The distinction between these two processes would however need further investigations.
| River | Stations | Average annual suspended sediment load (× 103 t/yr) | Fraction of total load | Monthly sediment concentration (g/l) | |||||
|---|---|---|---|---|---|---|---|---|---|
| Coarse | Medium | Fine | Total | C + M | Fine | Monsoon | Non-monsoon | ||
| Ganga | Garhmuk | 898 | 3437 | 18430 | 22765 | 0.19 | 0.81 | 1.06 | 0.46 |
| Kachhla | 4261 | 6217 | 56384 | 67880 | 0.18 | 0.83 | 2.18 | 1.07 | |
| Fatehgar | 2838 | 4509 | 10443 | 25137 | 0.42 | 0.58 | 0.67 | 0.03 | |
| Ankinghat | 1787 | 4354 | 23978 | 30117 | 0.20 | 0.80 | 0.86 | 0.23 | |
| Kanpur | 1601 | 4612 | 26793 | 33006 | 0.19 | 0.81 | 0.87 | 0.06 | |
| Ramganga | Dabri | 808 | 1208 | 2750 | 4766 | 0.42 | 0.58 | 0.52 | 0.25 |
| Garra | Husepur | 84 | 932 | 6602 | 7618 | 0.13 | 0.87 | 2.12 | 0.46 |
| Ganga | C + M | F | C + M | F | |
| Garhmukteswar | 0.12–0.66 | 0.44–1.48 | 0.05–0.25 | 0.21–0.58 | |
| Kachlabridge | 0.11–0.53 | 0.41–3.69 | 0.08–0.40 | 0.26–2.25 | |
| Fatehgarh | 0.15–0.55 | 0.19–0.84 | 0.15–0.41 | 0.08–0.35 | |
| Ankinghat | 0.06–0.75 | 0.28–1.35 | 0.03–0.35 | 0.22–0.92 | |
| Kanpur | 0.08–0.45 | 0.32–1.37 | 0.04–0.16 | 0.21–0.54 | |
| Ramganga | Dabri | 0.003–0.47 | 0.02–0.739 | 0.01 | 0.01–0.705 |
| Garra | Husepur | 0.011–1.58 | 0.02–8.53 | 0.007–0.16 | 0.029–1.40 |
- Note: C, coarse (> 0.2 mm); M, Medium (0.2−0.075 mm); F, Fine (<0.075 mm).
Sediment budgeting
Variation of sediment load over the years (1988–2003) for the Ganga River at Garhmukteshwar and Kachlabridge stations shows interesting trends (Figure 7). Although both stations are located in upstream reaches, separated by 122 km, and there is no significant tributary contribution between Garhmukteshwar and Kachlabridge, the suspended load at Kachlabridge is much higher. Total suspended load at Ankinghat is generally greater than that at the upstream stations, Fatehgarh and Garhmukteshwar. Ankinghat interestingly shows higher suspended load than that at Kanpur (downstream station) until 1993 but the trend is reversed after 1993.
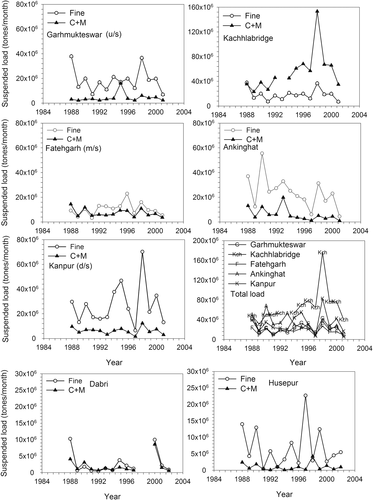
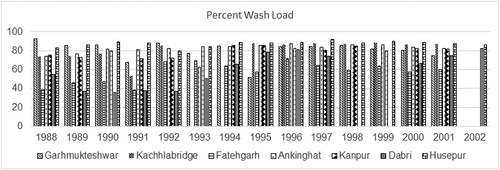
Over the years sediment load at each station is highly variable. The coarse plus medium sediment load is much less than the fine sediment load except at Fatehgarh where both fractions are comparable. Therefore, variations in total suspended load primarily reflect the variation in wash load at each station. Fine sediment load at Ankinghat shows a high peak in 1990 and Kanpur has two such peaks in 1995 and in 1998. Both Garhmukteshwar and Kachlabridge stations have a single peak in 1998, but no such peak can be observed at Fatehgarh. It is noted that these peaks do not correlate with the peak discharge data (Figure 7) and therefore do not mark any flood event. Although a crude correlation can be made with annual discharge data and the peak of suspended sediment load, it is not applicable for all stations. Therefore, it is suggested that the sudden increases of suspended sediment load is due to some localized event.
An interesting discovery is a much higher sediment load (mostly wash load) of the Garra River compared to the Ramganga River during the period of study. A rather high peak of sediment load in 1997 is mainly due to a sharp increase in wash load component of the Garra River. Though, peak discharge also increases in 1997 a little, but the reason for such large wash load is due to sheet wash from flood plains and bank erosion by heavy rainfall during each monsoon. The rainfall data show consistently high precipitation (~800 mm, from IMD database) at Shahjahanpur, the Garra catchment, and is likely to produce widespread sheet wash on the floodplain. Interestingly, the Ramganga River does not show a peak in 1997 and the total sediment load at Dabri remains low throughout the entire period except for two small peaks in 1988 and 2000, which coincide with high annual discharges in these years. This suggests that the Garra River catchment is more susceptible to erosion that is eventually manifested in terms of increased wash load contribution.
A clear picture of the sediment budgeting emerges from Figure 8 that plots the difference of total sediment load between the upstream and downstream stations along the Ganga River for the period 1988–2001. The positive sediment budget indicates local aggradation due to sediment accumulation within the reach and the negative sediment budget indicates local degradation due to sediment removal from river bed (Roy and Sinha, 2007, 2014). It is clearly observed from the plot that the reach between Garhmukteshwar and Kachlabridge has been degrading over the years (Figure 8a) while the reach between Kachlabridge and Fatehgarh has been aggrading (Figure 8b). The reach between Fatehgarh and Ankinghat stations was dominantly degrading until 1995 and a reversal of trend occurred during 1995–1998 when the reach showed aggradation (Figure 8c). Since 1999, minor degradation seems to have started in this reach but is yet to reach the earlier levels. A similar trend is noted between Ankinghat and Kanpur (Figure 8d), but along this reach aggradation was dominant until 1995 and then degradation occurred up to 2002.
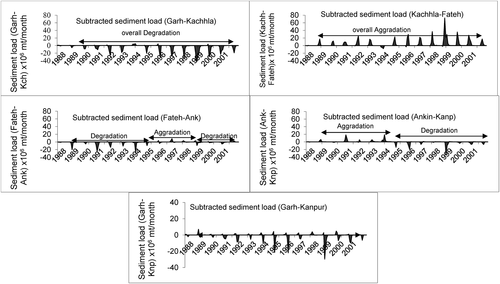
It has been observed that the Kachlabridge–Fatehgarh reach shows continuous aggradation throughout the period; in contrast, a continuous degradation occurred in the Garhmukteshwar–Kachlabridge reach. Continuous aggradation over a period of 14 years (1988–2002) may be related to the influence of the Narora Barrage located upstream of Kachlabridge. However, in other reaches, a shift from aggradational to degradational regime and vice versa may be linked to local sedimentological readjustments.
Sediment rating curve – sediment load versus discharge
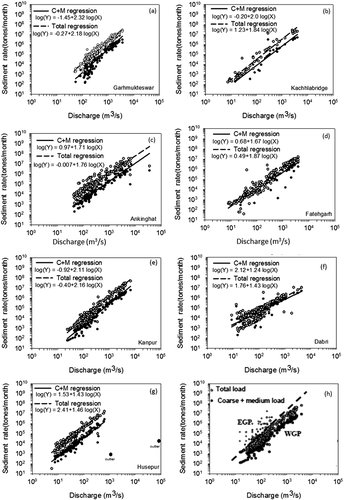
Suspended sediment rating curves for each station were developed for coarse plus medium fractions and total loads separately. Figure 9 shows that the sediment load continuously increases with discharge at all stations suggesting that sediment supply is mostly derived by fluvial erosion processes. Sediment load varies from station to station along the Ganga River and also varies among tributaries. The y-intercept values at some stations along the Ganga show negative values indicating that sediment transport is negligible during low flow conditions. A slight decrease of slope of the regression line (j) values from Garhmukteshwar to Kachlabridge reflects minor sediment aggradation in this reach. A small increase of ‘j’ value between Ankinghat and Kanpur indicates that some additional supply occurs in this reach. All tributaries in the WGP show higher y-intercept values in their rating curves in comparison to the Ganga. High y-intercept values for tributaries indicate higher sediment load at minimum discharge values, which can be interpreted that the floodplain areas of those tributaries are highly susceptible to sheet erosion. As discussed earlier, these tributaries also have a high wash load percentage (Figure 10), which also supports this idea.
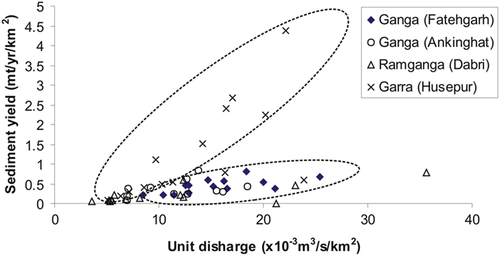
A plot of unit discharge (average annual discharge per unit area) and annual sediment yield clearly separates two clusters as shown by Roy and Sinha (2007), one consisting the Ganga and the Ramganga Rivers and the other of the Garra River (Figure 11). All rivers show a large variability in unit discharge that indicates the flashy nature of these rivers. Both the Ganga and the Ramganga Rivers have rather low specific sediment yield which is a reflection of their large catchment areas. The Garra River however shows a steep rise in sediment yield (mostly in wash load fraction) with increase in unit discharge suggesting vigorous reworking of the sediments through channel migration and lateral erosion. The geomorphic investigations (see Roy and Sinha, 2007) show a number of abandoned channels in the Garra floodplain which are suggestive of the dynamic behaviour of the river. The high sediment yield values, but low annual discharge over the Garra catchment indicate widespread sheet wash due to heavy rainfall along its catchment (Table 2).
Discussion
Hydrological behaviour of the rivers
The hydrographs of the Ganga and its tributaries with a single peak in August typically represent the monsoonal effect. Similar hydrographs are also observed for most rivers in the Ganga plains except where snowmelt contribution is higher such as the Brahmaputra in the eastern India which is characterized by a multiple-peaked hydrograph (Sarma, 2005). The snow-melt water is relatively less in the Ganga due to a much smaller glaciated catchment (1% of the total basin) compared to the Brahmaputra (3.1% of the total basin) (Immerzeel et al., 2010). The behaviour of rivers of similar genetic origin from other parts of the world can also be exemplified here to show climatic control on discharge hydrograph. For instance, the ‘mountain-fed’ Congo and the Magdalena Rivers from other tropical regions show bimodal discharge hydrographs which is generally attributed to bimodal rainfall distribution in summer and winter (Latrubesse et al., 2005).
Flow duration analysis separates the minor ‘plains-fed’ rivers Kali and Garra from major ‘mountain-fed’ rivers Ganga and Ramganga based on the nature of gradient observed. A high gradient curve for the plains-fed rivers reflects a very variable flow regime; low storage of water in the catchment results in a quick response to rainfall in the monsoon period and little flows in the absence of rainfall during the non-monsoon period.
Although all Gangetic rivers are typical monsoonal rivers, contrasting hydrological behaviour has been observed in the rivers draining the eastern and western parts of the plains. Our flow duration and flood frequency study show that the rivers draining the WGP rarely flood their banks, and these rivers have low flood intensity. In contrast, the rivers draining the EGP flood their banks almost every year and have a higher flood intensity compared to the rivers of the WGP (Sinha and Jain, 1998; Sinha, 2005). High flood intensity of the rivers of the EGP is attributed to higher rainfall and gentler topography of the alluvial plain. In contrast, the higher topographic gradient of western Ganga alluvial plain provides more erosional power to the rivers which contribute to channel thalweg erosion rather flooding during high discharge period (cf. Amsler et al., 2005). Several reaches of the rivers draining the WGP are deeply incised (maximum depth of the channel varies between 4 to 9 m and bank cliffs are at times 15–20 m high), and therefore, these rivers rarely cross their bankfull capacity.
Further, the general belief of bankfull discharge to be equivalent to 1.5 years return flood proposed by Leopold et al. (1964) and many other subsequent workers (Dury, 1973; Woodyer, 1968; Richards, 1982; Hey, 1998) does not apply to the rivers of WGP. Richards (1982) showed that bankfull discharges correspond to 1.5 year return period flood in humid to semi-arid alluvial plain region. Although the rivers draining the sub-humid WGP are perennial, we observed the discharge corresponding to 1.5 year return period to be almost half of the bankfull discharge estimated at each site based on stage–discharge relationship (Table 5). However, a number of rivers draining the EGP (namely Baghmati, Kamla-Balan, Kosi, downstream of Gandak) have width to depth ratio of 12 to 133 and bankfull discharges close to or lower than 1.5 year return discharge (Sinha and Jain, 1998; Table 5); this suggests frequent flooding of these rivers. Gentler topographic gradient (mean slope 11 cm/km) and higher average rainfall (150–200 cm) of the EGP corroborate the occurrence of bankfull discharge once in a year.
| River name | Station | WGP | River name | Station | EGP | ||||
|---|---|---|---|---|---|---|---|---|---|
| Qb (m3/s) | (Q1.5) (m3/s) | Qb/Q1.5 | Qb (m3/s) | Q1.5 (m3/s) | Qb/Q1.5 | ||||
| Ganga | Garmukh | 6940 | 3800 | 1.82 | Baghmati | Dhengebridge | 1100 | 1100 | 1 |
| Fatehgarh | 7682 | 2880 | 2.67 | Hyaghat | 870 | 750 | 1.2 | ||
| Ankinghat | 9720 | 4400 | 2.20 | Gandak | Triveni | 12500 | 6000 | 2/08 | |
| Kanpur | 8464 | 4400 | 1.92 | Dumariaghat | 5250 | 7000 | 0.75 | ||
| Ramganga | Dabri | 665 | 1400 | 0.47 | Kosi | Baltara | 5750 | 7000 | 0.82 |
| Garra | Husepur | 303 | 300 | 1.01 | Burhi Gandak | Chanpatia | 500 | 200 | 2.50 |
| Sikanderpur | 2050 | 600 | 3.42 | ||||||
| Rosera | 950 | 420 | 2.26 | ||||||
| Kamla-Balan | Jaynagar | 400 | 390 | 1.02 | |||||
| Jhanjharpur | 300 | 320 | 0.93 | ||||||
- Note: Qb, bankfull discharge; Q1.5, 1.5 yr return discharge.
Our study shows that the bankfull discharge is strongly dependent on channel geometry and may not always be equal to 1.5 years return period flood. The major rivers of the WGP are deeply incised (Tandon et al., 2006; Sinha et al., 2007), so their bankfull discharges are higher than 1.5 year return period flood. Although the spatial variation of climate has been considered as a major control on river hydrology (Petit and Pauquet, 1997), the present study highlights channel geometry as the dominating factor influencing bank discharge of the rivers in the WGP.
Sediment dynamics and landscape evolution
Sediment load versus discharge relationships for the rivers in the WGP also show some variance to those for the rivers in the EGP. Figure 9h shows that the rate of sediment supply in the rivers of the WGP is always lower at a given discharge than those of the EGP (Table 6). This indicates that the rivers draining the EGP attain surplus sediment supply with sediment yields of 0.5 to 4 × 10³ t/km2/yr and stream power of 6 to 20 W/m2 (Sinha et al., 2005), and therefore, behave as a transport-limited system. As a result, these rivers behave as largely aggradational systems and many of them have generated large alluvial fans. However, the rivers draining the WGP are sediment supply-limited systems, especially when discharge becomes high, and almost all of its sediments are transported downstream. Sinha et al. (2005) compiled the hydrological data for these rivers and showed that sediment yield is <0.5 × 10³ t/km2/yr for these rivers (except for Ganga at Kachlabridge) but stream power is much higher (40–43 W/m2) compared to the rivers draining the EGP. Consequently, the rivers draining the WGP represent degradational systems and have generated incised valley systems separated by wide interfluves. Our earlier work has also shown that the ‘effective discharge’ of most of the rivers of the WGP is less than 40% of the flow (Roy and Sinha, 2014). More specifically, 50% of the sediment load at most stations on the Ganga and its tributaries in the WGP is moved by discharge varying between 14 and 40% of total discharge. Also, this discharge is well below the bankfull discharge of the rivers. We conclude therefore that the ratio of water to sediment discharge has played an important role in long-term landscape development in this region.
| River station | Area (A) (×103 km2) | Water flux (1011 kg/yr) | Unit discharge (Q/A) (×10−3) (m3/s/km2) | Sediment flux (109 kg/yr) | Specific sediment yield (t/yr/km2) | |
|---|---|---|---|---|---|---|
| Western Ganga plains (WGP) | ||||||
| Ganga | Garhmukteshwar | 29.7 | 208 | 22.21 | 23 | 766 |
| Kachhlabridge | 33.4 | 218 | 19.70 | 68 | 2028 | |
| Fatehgarh | 40.1 | 181 | 14.36 | 25 | 626 | |
| Ankinghat | 82.2 | 320 | 12.34 | 30 | 366 | |
| Kanpur | 87.6 | 282 | 10.21 | 33 | 376 | |
| Ramganga | Dabri | 23.9 | 86 | 11.45 | 5 | 199 |
| Garra | Husepur | 6.1 | 25 | 13.32 | 8 | 1237 |
| Eatsren Ganga plains (EGP) | ||||||
| Gandak | Dumariaghat | 43 | 490 | 36.17 | 82 | 1906 |
| Kosi | Baltara | 88.5 | 641 | 23.01 | 43 | 485 |
| Baghmati | Hayaghat | 13 | 60 | 22.39 | 11 | 829 |
| Burhi Gandak | Rosera | 9.6 | 86 | 28.50 | 15 | 1562 |
| Kamla Balan | Jhanjharpur | 2.9 | 26 | 23.45 | 8 | 2758 |
Our observations are in line with the earlier suggestions that difference in sediment supply from the hinterlands in the WGP and EGP is a manifestation of geological characteristics of the hinterland and rainfall variability (Sinha et al., 2005). A higher sediment supply from the eastern hinterland (Nepal Himalaya) is a function of higher uplift rates (Lave and Avouac, 2000) and higher rainfall that results in higher sediment production and mobilization of sediments through the rivers draining the EGP. In a more recent study in the western and central Nepal Himalaya, van der Beek et al. (2016) have also demonstrated that tectonics is the primary driver for along-strike variations in topography in the Himalaya and climatic variations respond to these topographic changes. On the contrary, the WGP have smaller sediment supply due to lower uplift rates in the hinterland (Wesnousky et al., 1999) and lower rainfall.
We suggest that such diversity in the hinterland characteristics and regional climate have existed for a long timescale and they manifest as important landscape-forming events. As a result, the rivers of EGP have built large alluvial fans such as the Kosi and Gandak megafans characterized by thick multi-storied sand bodies (Sinha et al., 2014) dating back to ~50 ka (Jawed Ahmad, unpublished data). In contrast, the cliff sections and drill cores raised from the WGP recorded thin valley fills separated by thick interfluve deposits dating back to ~100 ka (Gibling et al., 2005; Tandon et al., 2006; Sinha et al., 2007, 2009). Stratigraphic records from the interfluve areas in the WGP are marked by major discontinuities in the form of low-relief degradational surfaces, pedogenic intervals and non-fluvial (lakes, eolian) deposition (Gibling et al., 2005). Age data from these sequences suggest that the river and floodplains in the WGP responded to fluctuations in southwest monsoon over the last 100 ka; for example, incision events during 15–5 ka linked to high stream capacity during high monsoon caused detachment of floodplains and local aggradation of detached floodplains occurred during low monsoon period through small plains-fed rivers, lakes and eolian processes (Gibling et al., 2005; Sinha et al., 2007). Therefore, long-term climate-driven hydrological variations played an important role in landscape evolution in this region that in turn influences the modern-day hydrology.
Conclusions
Analysis of hydrological data for the Ganga and its tributaries draining the WGP indicates that the probability of flood discharges to exceed the bankfull limit in the rivers of WGP is minimal, which implies that overbank flooding is rare in the rivers of the WGP. Flood intensity index just exceeds one, indicating low flood intensity, while larger scatter indicates high discharge variability. There are now growing evidences that bankfull discharge cannot be represented by 1.5 year return flood and our study on the rivers draining the humid to semi-humid WGP exemplifies this primarily due to their incised valleys. We therefore conclude that channel geometry influences the bankfull discharges in a major way. Further, the rivers in the WGP are characterized as supply-limited systems in terms of sediment dynamics as more than 50% of the total sediment load is transported by less than 40% of the total available discharge. Long term stratigraphic records from the WGP also suggest that river/floodplain aggradation and degradation events were strongly influenced by southwest monsoonal fluctuations during the last ~100 ka. We suggest that such hydrological variations have played an important role in long-term landscape evolution of the Ganga plains that in turn continue to influence the present-day hydrology of the river systems in this region.
Acknowledgments
The Central Water Commission, New Delhi is thanked for providing all the hydrological data for this study. The lead author thanks IIT Kanpur for providing the research assistantship during his PhD programme. Discussions and comments from Dr Shivam Tripathi, IIT Kanpur on an earlier version of this manuscript were useful to improve the interpretations. The authors thank all the reviewers for their constructive suggestions that have improved the paper significantly.


