Improved platinum-nickel nanoparticles with dopamine-derived carbon shells for proton exchange membrane fuel cells
Injoon Jang and Sehyun Lee contributed equally to this work.
Funding information: National Research Foundation of Korea, Grant/Award Numbers: 2021M3H4A1A02042948, 2021M3H4A3A02086681; Korea Institute of Science and Technology
Summary
Using platinum-based alloy nanocatalysts with other transition metals has the advantages of enhancing the oxygen reduction reaction (ORR) activity and reducing the platinum usage. However, there are many challenges to using nanocatalysts, including their instability, which hinder their practical application. In this study, we employed a strategy to improve the intrinsic instability of a nanocatalyst by encapsulating a dopamine-derived carbon layer on the surfaces of nanoparticles. The carbon layer formed on the surfaces of platinum-nickel (PtNi) nanoparticles demonstrated improved stability by inhibiting the nanoparticle growth, even during the heat treatment process. This could induce a high degree of alloying while minimizing the loss of surface area for the nanoparticles, which ensured an improved catalyst activity. Additionally, the PtNi nanocatalyst with the dopamine-derived carbon layer showed an improved performance and stability under long-term fuel cell operation conditions, thus proving the practicality of this strategy. The strategy developed in this study is not only a novel and facile approach to the synthesis of alloy catalysts, but also addresses the inherent instability of nanoparticles, which will encourage the practical use and commercialization of alloy nanocatalysts.
1 INTRODUCTION
Hydrogen is the most promising alternative for meeting the growing demand for eco-friendly energy sources. Proton exchange membrane fuel cells (PEMFCs), which are a type of hydrogen fuel cell, have been successfully commercialized in the automotive market owing to their high power density and potential.1, 2 However, the oxygen reduction reaction (ORR) activity, which indicates the PEMFC performance, is still insufficient. An improvement in the long-term stability is required, which is one of the major challenges facing PEMFCs.3-5
Although platinum (Pt) is regarded as the most promising ORR catalyst material, it has not been readily applied to commercial PEMFC systems because of its high scarcity and price. Various strategies have been studied to reduce the amount of Pt used, such as alloying Pt with other transition metals (TMs).6-8 When alloying Pt, a rearrangement of the electron structure occurs because of ligand and strain effects, resulting in a downshift of the d-band center.9, 10 According to the d-band theory, the d-band center is closely related to the binding energies of Pt and reactive intermediate oxygen species such as O*, OH*, and OOH*, and it is an important factor in determining the ORR of a catalyst.11, 12
However, as a result of the intrinsic vulnerability of TMs (TM = Co, Ni, and Fe) to oxidation and elution in a strong acidic atmosphere, Pt-TM alloy catalysts do not guarantee robust long-term stability under PEMFC operating conditions.13 The eluted TM adversely affects other parts of the membrane electrode assembly (MEA) and further impairs the performance of the fuel cell.14, 15 In addition, nanoparticles with high surface energy promote the diffusion and growth of nanoparticles on the carbon support during fuel cell operation, which further contributes to the lowering of the catalytic activity. Alloyed nanocatalysts are also subjected to high-temperature treatment during synthesis to induce a high alloying degree. However, nanoparticles exposed to high temperatures tend to aggregate, leading to an excessive increase in particle size and lower catalytic activity. Thus, the need for increased nanoparticle stability is not only limited to the fuel cell operation, but must also be ensured during the synthesis process.
To improve the stability of alloy nanoparticles, studies have mainly focused on the introduction of dopants or intermetallic structures and physical barriers such as carbon or oxide layers, which encapsulate the nanoparticles.16-18 A carbon layer doped with nitrogen on the surface of a nanoparticle not only increases the catalytic activity of the nanoparticle by interacting with nitrogen but also dramatically improves the stability of the catalyst by blocking the elution of TMs and diffusion of nanoparticles.19-21 However, the catalytic activity is too sensitive to the shape and thickness of the barrier layer formed on the nanoparticle surface. If the barrier layer is too thick or dense, even the reactant oxygen may be blocked, the catalytic activity may be lost, and the stability of the catalyst cannot be sufficiently improved. In addition, the performance improvements of catalysts developed with carbon layer coatings have mostly proven only in half-cell systems. Thus, their applicability to actual PEMFCs is unclear. Therefore, it is important to explore the optimal barrier conditions to simultaneously improve the activity and stability of the catalyst in a PEMFC system.
In this study, highly alloyed PtNi nanoparticles encapsulated in carbon shells were directly synthesized using a simple two-step generalized thermal-annealing strategy. By optimizing the coating conditions of the carbon layer, a solution was proposed to minimize the performance degradation and increase the durability of the catalyst. Furthermore, by adopting dopamine as a precursor for the carbon layer, the carbon layer was doped with N, which improved the activity of the catalyst. As a result, by coating the surface of the nanoparticles with a carbon layer, it was possible to successfully achieve both long-term durability for the catalyst and activity for the electrochemical ORR. Furthermore, the practicality of the strategy of coating the surfaces of the nanoparticles with a carbon layer was also confirmed by improving the catalyst performance not only in a half-cell test but also under actual PEMFC single-cell operating conditions.
2 METHODS
2.1 Preparation of PtNi nanoparticles
A carbon-supported PtNi alloy catalyst (PtNi/C) was prepared using a modified impregnation method. Carbon black (0.1 g, Vulcan XC-72) was mixed with 80 mL of anhydrous ethyl alcohol (Sigma Aldrich), and the solution was sonicated for 30 minutes to ensure an even dispersion. PtCl4 (0.033 mg, Sigma Aldrich) and NiCl2•6H2O (0.023 mg, Sigma Aldrich) precursors, and 1.4 g of sodium acetate, were dissolved in anhydrous ethanol, and the solution was stirred vigorously at room temperature for 4 hours. Then, 0.1 g of NaBH4 (Sigma Aldrich) dissolved in 20 mL of anhydrous ethanol was added to the prepared solution, and the mixture was stirred vigorously for 4 hours. After the reaction was complete, the emulsion was filtered and washed with ethanol and deionized water several times. Then, it was dried overnight in a vacuum oven at 60°C to obtain a powder product. Finally, it was heat-treated at 300°C in an oxygen atmosphere in a tube furnace to remove impurities such as the various remaining organic materials.
2.2 Polydopamine coating
The polydopamine coating of the nanoparticle surface was performed in a Tris-HCl buffer solution (10 mM, pH 7.4 Tris-HCl [Trizma hydrochloride buffer solution], Sigma Aldrich), in which dopamine chloride (Sigma Aldrich) was dissolved. Then, 0.1 g of PtNi/C was added to the prepared dopamine solution and sonicated for various time periods (10, 15, 30, and 60 minutes). After coating, the catalyst was washed several times with ethanol and deionized water to remove any residual polydopamine. Finally, it was vacuum-dried overnight at 60°C in an oven to obtain PtNi/C_Dopa.
2.3 Thermal annealing
To carbonize the polydopamine in the prepared PtNi/C_Dopa catalyst, thermal annealing was performed in a tube furnace at 700°C in a 5% H2 gas (Ar balanced) atmosphere. Finally, PtNi@C/C, a PtNi catalyst with a carbon layer on the surface of the nanoparticles, was obtained. For comparison, PtNi/C_700°C, a PtNi catalyst without a carbon layer, was also prepared by omitting the polydopamine coating process.
2.4 Physical characterization
where k is a coefficient (0.9); λ is the wavelength of X-rays used (1.54056 Ǻ); β is the full-width at half-maximum of the respective diffraction peak (rad); and θ is the angle at the position of the peak maximum (rad)
An X-ray photoelectron spectroscopy (XPS) analysis was performed using a Multilab ESCA 2000 system (VG Microtech, East Grinstead, West Sussex, UK) with Al Kα as the X-ray source. Before the measurements were performed, the binding energy scale was calibrated using the corresponding Ag 3d 5/2 photoelectron lines at 368.21 eV. Transmission electron microscopy (TEM) analyses were performed using an FEI Titan 80 to 300 microscope (FEI Company, Hillsboro, Oregon) operating at 300 kV. An elemental analysis using TEM energy dispersive X-ray spectroscopy (EDS) was performed using a Talos F200X (FEI Company, Hillsboro, Oregon).
2.5 Electrochemical evaluation
Electrochemical experiments were conducted using an Autolab PGSTAT 302 N potentiostat (Metrohm AG, Herisau, Switzerland) controlled by a computer. A standard three-compartment glass cell was used for all the experiments, and the measurements were conducted at room temperature.
The working electrode was a thin layer of Nafion-impregnated catalyst, cast on a glassy carbon disc held in a Teflon cylinder. Glassy carbon with a geometric surface area of 0.196 cm2 was used as the working electrode, using a rotating disk electrode (RDE) setup. A Pt wire and saturated calomel electrode were used as the counter and reference electrodes, respectively. To prepare the required catalyst slurry inks, the catalyst powder was blended with a 5 wt% Nafion solution as a binder and 2-propanol as a solvent. Sonication was carefully performed to obtain a finely dispersed slurry by maintaining the solution temperature below 40°C. Subsequently, 5 μL of the ink was loaded onto the glassy carbon electrode and dried. Steamed deionized (DI) water was flowed into the RDE equipment to achieve the surface wettability of the working electrode. All the potentials in the manuscript are reported with respect to the reversible hydrogen electrode (RHE). Prior to obtaining the ORR polarization curves, multiple cyclic voltammetry (CV) measurements were performed in a deaerated 0.1 M HClO4 solution at a scan rate of 50 mV/s in a potential window of 0.05 V to 1.0 V vs RHE at room temperature. The ORR activity was evaluated using the RDE technique in an O2-saturated 0.1 M HClO4 solution, with a sweep rate of 5 mV/s at 1600 rpm at approximately 25°C. Accelerated durability tests (ADTs) were conducted in a potential range of 0.6 V to 1.0 V, at a scan rate of 50 mV/s for 10 000 cycles in an Ar-saturated HClO4 electrolyte without rotation.
2.6 MEA fabrication and single-cell test
Membrane-electrode assemblies (MEAs) were prepared using a catalyst-coated membrane (CCM) method with hand spraying. To fabricate the CCM, we coated a Nafion 211 membrane with the catalyst ink composed of the catalyst, Nafion ionomer, and 2-propanol. A commercial Pt/C (46 wt%, TKK) anode was used, with a loading rate of 0.2 mg/cm2. Cathodes were prepared with loadings of 0.2 mg/cm2 using Pt/C (JM, 40 wt%), PtNi/C_700°C, and PtNi@C/C. The prepared MEA was sandwiched between gas diffusion layers (GDLs; 39 BC, SGL carbon). Single-cell current density-voltage (I-V) polarization results were obtained via a fuel cell station (CNL). Electrochemical impedance spectroscopy (EIS) and linear sweep voltammetry (LSV) were performed using a potentiostat (SP-300; Biologics). Single-cell electrochemical characterization performed at 80°C. H2 at 100% relative humidity (RH) was applied to the anode. The cathode was fed fully humidified O2 or air for the I-V polarization and EIS. The I-V polarization curves were derived from the open-circuit voltage to 0.35 V without back-pressure. EIS was performed from 0.1 mHz to 5 kHz at specified potentials (0.70 V and 0.80 V). The cell durability test was performed by repeatedly acquiring the I-V polarization curves for 100 hours.
3 RESULTS AND DISCUSSION
3.1 Preparation of carbon shell-coated PtNi nanocatalyst
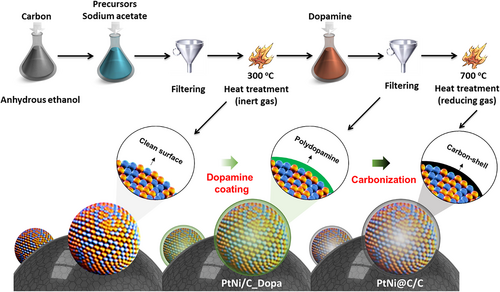
Scheme 1 depicts the chemical and experimental procedures described in detail in the methods section. Nanoparticles that underwent heat treatment at 300°C had clean surfaces because any organic matter remaining on their surfaces was removed. Polydopamine was coated onto the surfaces of the nanoparticles by redispersing the catalyst in a solvent in which dopamine was dissolved. To carbonize the polydopamine coating on the surfaces of the nanoparticles, heat treatment was performed at 700°C in a hydrogen gas atmosphere. During this process, the two elements (Pt and Ni) in the nanoparticles were uniformly alloyed. The heat treatment at 700°C performed in this experiment increased the PtNi alloying degree and simultaneously formed a carbon layer on the surfaces of the nanoparticles. The catalyst synthesized through this process was called PtNi@C/C. To make it easier to determine the effect of the carbon layer, a PtNi/C_700°C catalyst with the carbon layer was also synthesized. The synthesis process was the same as that for PtNi@C/C; however, the dopamine coating process was omitted. In addition, the polydopamine-coated catalyst before heat treatment at 700°C was called PtNi/C_Dopa.
The XRD results for the three prepared catalysts are shown in Figure 1A and consist of peaks that are typical of carbon-supported Pt alloy nanoparticles. The low intensity and wide peaks around 25°C are attributed to the (002) plane of the carbon support, Vulcan XC-72. The three peaks above 30°C were determined to be the (122), (200), and (220) planes of the face-centered cubic (FCC) structure. The XRD peaks of PtNi/C_Dopa were located between those of Pt (PDF#65-2868) and Pt1Ni1 (PDF#65-9445). This also exhibited asymmetrical peaks inclined toward the Pt reference peak. These results were due to the low and non-uniform alloying degrees of Pt and Ni. In contrast to those of PtNi/C_700°C, which was heat treated at 700°C, the XRD peaks of PtNi@C/C were close to the Pt1Ni1 reference peaks and maintained a symmetrical shape. As expected, high-temperature treatment improved the alloying degree of the PtNi nanoparticles. The TEM-EDS analysis results for a number of nanoparticles, shown in Figure S1, also show that the Pt to Ni ratio was close to 50:50, supporting the synthesis of the Pt1Ni1@C/C catalyst. The widths of the XRD peaks of the three catalysts were different, which meant that the crystal sizes of the planes constituting the nanoparticles were different. The crystallite sizes of the (111), (200), and (220) planes, determined using Scherrer's equation, are compared in Figure 1B. PtNi/C_Dopa, without the heat treatment at high temperature, naturally had the smallest crystal size of approximately 2.5 nm. The crystallite size of PtNi/C_700°C, which was annealed without a dopamine coating at 700°C, increased dramatically to approximately 8.4 nm, as a result of the agglomeration of nanoparticles at high temperatures, indicating the instability of the nanoparticles on the carbon support. On the other hand, the crystallite size of PtNi@C/C was approximately 5.9 nm, and the growth of the particle size was inhibited by approximately 42.4% compared to PtNi/C_700°C without a carbon layer on the surface, which meant that the stability of the PtNi nanoparticles was improved by the dopamine-derived carbon layer on the surface. These results are also revealed in the TEM images of Figures 1C, D, and E (see Figure S2 for high-magnification TEM images of each catalyst). In all three prepared catalysts, PtNi nanoparticles were evenly distributed on carbon support. However, considering that the magnifications of the three TEM images are the same, a difference in the size of the nanoparticles can be clearly observed. The PtNi/C_700°C had a non-uniform particle size, with abnormally large nanoparticles. In contrast, the PtNi nanoparticles of the PtNi@C/C catalyst had a relatively uniform size distribution and small size. To accurately estimate the size of the nanoparticles, the size distribution was obtained for approximately 100 nanoparticles in the TEM image of each catalyst, as shown in Figure S3. The average sizes of the PtNi nanoparticles of the PtNi/C_Dopa, PtNi/C_700°C, and PtNi@C/C catalysts were 2.25, 8.1, and 6.09 nm, respectively, which were similar to the crystallite size obtained from the XRD results. The crystal and nanoparticle sizes obtained by the XRD and TEM results confirmed that the aggregation of nanoparticles during the heat treatment process could be prevented by the carbon layer formed on PtNi@C/C. In addition to the PtNi peak in the XRD pattern of PtNi/C_700°C, a separate peak corresponding to Pt was observed. This was probably due to the segregation ascribed to the difference in the affinity to the supplied gas between the Pt and Ni, or the difference in their bonding strengths, which depended on the type of metal atom during annealing in a hydrogen atmosphere at 700°C.22 This segregation should be avoided because it may inhibit uniform alloy formation and may also lead to the formation of isolated Pt nanoparticles. Interestingly, no isolated XRD peaks were observed for PtNi@C/C. In other words, the formed carbon layer prevented the separation of Pt by segregation. Therefore, the dopamine-derived carbon layer suppressed the agglomeration and segregation of PtNi nanoparticles during high-temperature annealing. Hence, the PtNi nanoparticles of the PtNi@C/C catalyst had a relatively small and uniform distribution, as well as a high alloying degree.
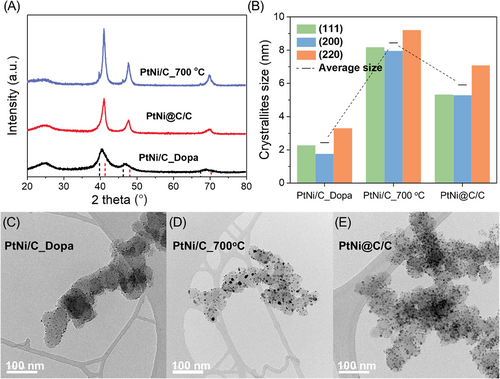
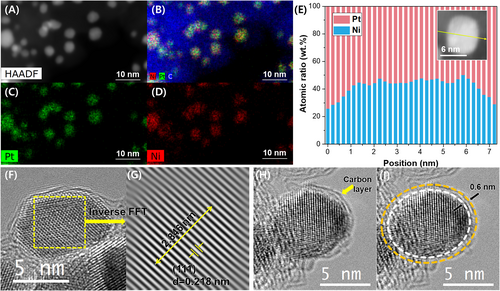
Figure 2A-D shows the results of a TEM-EDS mapping analysis of the PtNi@C/C catalyst. The bright dots in Figure 2A, green dots in Figure 2C, and red dots in Figure 2D indicate the high-mass metal particles, Pt, and Ni, respectively. The yellow dots in Figure 2B were obtained by superimposing Pt and Ni particles. The points in each TEM-EDS mapping image were obtained at the same locations. Therefore, Pt and Ni existed simultaneously in one nanoparticle, confirming the presence of the PtNi alloy. Figure 2E is an EDS line profile result showing the distribution of Pt and Ni in a single nanoparticle, confirming that Pt and Ni existed in an elemental ratio of approximately 1:1 in the particle. Interestingly, the Pt content on the surface of the nanoparticles slightly increased, which was probably due to the segregation of Pt during heat treatment in a hydrogen atmosphere.22 Figure 2F,G are a single high-resolution TEM (HR-TEM) image of a PtNi nanoparticle and its pattern obtained using an inverse FFT process, respectively. The (111) interplanar distance, d-spacing, of the synthesized PtNi nanoparticles was approximately 2.18 Å, which was close to that of the Pt1Ni1 alloy (2.17 Å), confirming the formation of a PtNi alloy with a uniform composition. Polydopamine is one of the commonly used precursors for the insitu formation of N-doped carbon shells.23-25 The thickness of the N-doped carbon shell formed on a PtNi nanoparticle could be precisely controlled by varying the polydopamine coating time during the synthesis process.26 The HR-TEM images seen in Figures 2H and I confirm the existence of a carbon layer with a thickness of 1 nm or less surrounding the PtNi nanoparticles. The additional HR-TEM images (Figure S4) show the presence of a carbon layer on the surfaces of multiple nanoparticles. Data on the presence and bonding state of nitrogen elements in the prepared catalysts were obtained using an XPS analysis of the 1s orbital of nitrogen (Figure S5). Nitrogen was found only within the dopamine, and its presence demonstrated the presence of dopamine or dopamine-derived carbon layers. The N 1s XPS signal of PtNi/C_Dopa had a single peak at approximately 399 eV, which indicated an NC or NH bond, confirming the presence of polydopamine-coated nanoparticles. The N1s XPS spectrum of the PtNi@C/C catalyst after annealing at 700°C in a hydrogen atmosphere, unlike before, had two peak shapes, which could be deconvoluted into peaks for pyridinic (N 1s-399 eV), pyrrolic (N 1s-400 eV), and graphitic (N 1s-401 eV) nitrogen. These are nitrogen species commonly found in nitrogen-containing carbon, which means the dopamine was converted into a nitrogen-doped carbon layer during the high-temperature heat treatment.26 Figure S6 shows the TEM-EDS mapping results for carbon and nitrogen in PtNi@C/C. The distributions of carbon and nitrogen were exactly the same, which meant the carbon layer of the dopamine coating was not selectively formed on the surface of the PtNi nanoparticles, but was instead evenly formed throughout the catalyst. In contrast, no nitrogen was detected in the PtNi/C_700°C catalyst, which was heat-treated without a dopamine coating. The Pt 4f XPS signals shown in Figure S7a indicate that the binding energy of the PtNi alloy catalyst was positively shifted by approximately 0.1 eV compared to that of the Pt catalyst (commercial Pt/C, JM). This is a generally accepted result due to the d-band downshift of Pt upon alloying with Ni.27-29 However, Figure S7b confirms a slight negative shift in the Pt 4f binding energy due to the influence of the N-C layer. This indicates that the electronic structure of the nanoparticles was modified by the N element contained in the carbon layer formed on the PtNi NPs surface,30, 31 which was closely related to the oxygen reduction activity.
3.2 Electrochemical analysis of PtNi nanocatalysts
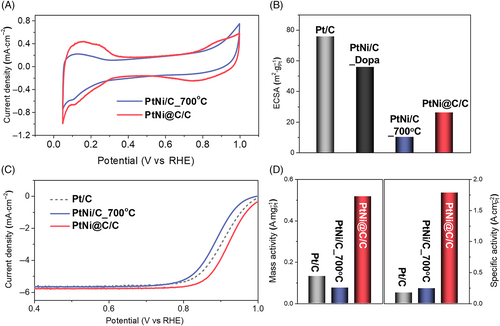
The electrochemical properties of the prepared catalysts were investigated by CV and LSV using a RDE in a 0.1 M HClO4 electrolyte. Figure 3A shows the CV curves of PtNi@C/C and PtNi/C_700°C, which were typical Pt-based catalysts. These show a hydrogen adsorption/desorption peak in the range of 0.05 VRHE to 0.4 VRHE, an electrochemical double layer current of 0.4 VRHE to 0.7 VRHE, and a peak ascribed to the surface redox of the Pt catalyst above 0.7 VRHE. The area of the hydrogen adsorption/desorption peak was an important factor for estimating the electrochemically active surface area (ECSA) of each catalyst. Figure 3B shows a comparison of the ECSA values obtained from the hydrogen adsorption and desorption peaks. The ECSA values of the commercial Pt/C and PtNi/C_Dopa were 75.8 m2/gPt and 55.6 m2/gPt, respectively. The ECSA of PtNi/C_Dopa was less than that of the commercial Pt/C, probably because the dopamine on the particle surface blocked the active sites of the PtNi catalyst. The ECSA values of the two catalysts (PtNi/C_700°C and PtNi@C/C) that were subjected to heat treatment at 700°C, showed significant differences. The ECSA values of PtNi/C_700°C and PtNi@C/C decreased by approximately 82% and 53%, respectively, compared with that before heat treatment, which further supports the notion that the dopamine-derived carbon layer prevented the agglomeration of PtNi nanoparticles. To investigate the effect of the dopamine-formed carbon layer on the ECSA of the catalyst, the change in the ECSA with respect to the dopamine coating time was observed (Figure S8). The catalyst coated with dopamine for 15 minutes had the highest ECSA, indicating that the dopamine coating was effective in preventing the agglomeration of nanoparticles during heat treatment for up to 15 minutes. However, the application of the dopamine coating for more than 15 minutes decreased the ECSA. The carbon layer, which became too thick as a result of the increase in dopamine, may have blocked the nanoparticle surface of the catalyst from the reactants and electrolyte. Therefore, an appropriate amount of dopamine coating and the formation of a carbon layer with an appropriate thickness are important factors in determining the optimal point between the agglomeration of nanoparticles and blocking of the nanoparticle surface. Figure 3C shows the polarization curves of the prepared catalysts during the electrochemical ORR, with derived mass activity and specific activity shown in Figure 3D. Although PtNi/C_700°C was a PtNi alloy nanocatalyst, it had a lower half-wave potential and mass activity than the commercial Pt/C. Considering the superior specific activity of PtNi/C_700°C compared to the commercial Pt/C, its inferior mass activity stemmed from its excessively small ECSA. The PtNi@C/C catalyst exhibited the highest ORR activity. The mass activity of PtNi@C/C was four and seven times greater than those of Pt/C and PtNi/C_700°C, respectively, while the specific activity was increased by 10 and 7 times, respectively. The superior ORR activity of PtNi@C/C was attributed to the resistance to the agglomeration of the nanoparticles by the carbon layer, along with the high PtNi alloying degree. The effect of the dopamine coating time on the ORR activity was investigated. Figure S9 shows the polarization curve for the ORR activity according to the dopamine coating time, with Figure S10 showing the derived specific activity and mass activity. The specific activity and mass activity increased for up to 15 minutes of dopamine coating, but after coating for more than 15 minutes, the ORR activity tended to decrease. The thickness of the carbon layer and prevention of nanoparticle aggregation were directly proportional, but the permeability of the oxygen reactant was inversely proportional; therefore, an optimum point existed somewhere in the middle. Similar to the cause of the change in the ECSA, the catalyst coated with dopamine for 15 minutes showed the highest ORR activity. To measure the number of electron transfers in the ORR of PtNi@C/C with an optimized carbon layer, additional polarization curves at 400, 800, 1200, and 2000 rpm were obtained, and Koutecky-Levich (K-L) plots derived from these polarization curves and the calculated electron transfer numbers are shown in Figure S11. A good linear relationship for the K-L plots is clearly observed in Figure S11b, revealing first-order kinetics toward the oxygen concentration. The electron transfer numbers over the entire potential range and their average value (3.94) were close to the theoretical value of 4, indicating that the ORR on the PtNi@C/C catalyst proceeded via an efficient four-electron transfer pathway, demonstrating the complete reduction of oxygen to water. Furthermore, compared with other Pt and Pt-based alloys entrapped or wrapped in carbon layers reported in the recent literature, the PtNi@C/C catalysts exhibited superior ORR activity (Table S1).
To further investigate the durability of the catalyst, we performed a stability test of the ORR activity of the commercial Pt/C and synthesized PtNi@C/C catalysts, as shown in Figure S12. The PtNi/C catalyst without a carbon layer showed lower long-term stability than the Pt/C because of the vulnerability to the leaching of Ni in an acidic atmosphere, which was demonstrated in a single-cell test, as discussed in the next section. Therefore, the stability of the PtNi@C/C catalyst surpassed that of the Pt/C. Figure S12a shows the ECSA values before and after the 10 K repetitive potential cycling of each catalyst. The ECSA changes after the ADTs were approximately −50.6% and −9.7% for Pt/C and PtNi@C/C, respectively. The decrease in the ECSA of the catalyst was due to the high instability of the nanoparticles. Specifically, considering the occurrence of nanoparticle migration, aggregation, and desorption, it could be concluded that the PtNi nanoparticles covered with the carbon layer of the PtNi@C/C catalyst had significantly higher stability than bare Pt nanoparticles. This could also be observed in the ORR activity changes, as shown in Figure S12b. The half-wave potential changes before and after the ADTs were 27 and 16 mV for Pt/C and PtNi@C/C, respectively. In other words, the ECSA and ORR activities were maintained compared to those of the Pt/C, owing to the high stability of the PtNi nanoparticles induced by the carbon layer.
3.3 Single-cell application and stability evaluation of PtNi@C/C catalyst
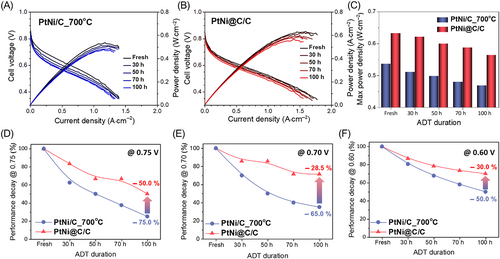
To evaluate the long-term catalyst stability under fuel cell driving conditions, MEAs coated with the commercial Pt/C, synthesized PtNi/C_700°C, and PtNi@C/C catalysts were fabricated. The MEAs were operated for 100 hours under the same conditions, and the performance curves and maximum power densities over time for the synthesized PtNi/C_700°C, and PtNi@C/C catalysts are shown in Figures 4A-C, with those for the Pt/C shown in Figure S13a. The MEA to which the PtNi@C/C catalyst was applied exhibited a higher performance than the MEA with PtNi/C_700°C. A decrease in the performance over time was observed in all the MEAs, but the MEA with the PtNi@C/C catalyst showed the highest stability. This decrease in performance may be attributed to the deterioration and corrosion of various components, including the catalyst. Therefore, to evaluate the degree of degradation of the catalyst alone, it was reasonable to investigate the performance change in the low-current region (high-voltage region), where catalyst degradation mainly occurs.32 In the low-current region, the influence of the ohmic resistance and mass transfer resistance could be excluded. Figures 4D-F and S13B-D show the current changes in the high-voltage range. As expected, the PtNi/C catalyst showed lower stability than Pt/C during the long-term operation of the fuel cell. This was because of the loss of PtNi catalytic reactivity by Ni leaching, which is a serious disadvantage of alloy catalysts containing TMs. The degradation of PtNi@C/C was dramatically mitigated at all three voltages, which was confirmed by the consistent dispersion and size of the PtNi nanoparticles in the TEM images of PtNi@C/C (Figure S14).
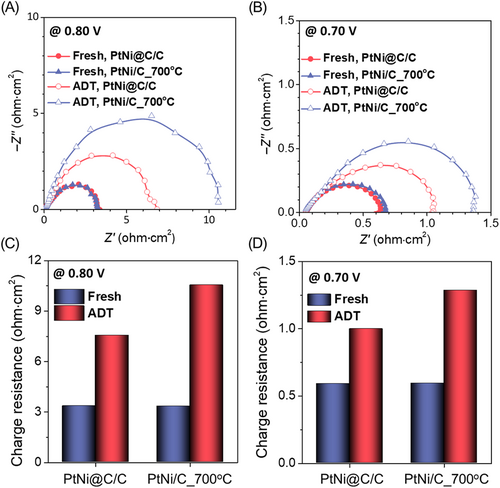
To further investigate the catalyst degradation effect, EIS was performed at a high voltage to determine the change in the charge transfer resistance due to the catalyst (Figure 5). The charge resistances of the first two catalysts were similar, but after 100 hours of stability testing, the charge resistance of PtNi@C/C was smaller than that of PtNi/C_700°C. The increase in charge resistance after the stability test was small for PtNi@C/C compared to PtNi/C_700°C, which indicated that the PtNi@C/C catalyst was more stable than PtNi/C_700°C under the long-term operation of the fuel cell. The dopamine-derived carbon layer was effective even under fuel-cell driving conditions, demonstrating that a fuel cell that used the PtNi@C/C catalyst would be guaranteed high performance and long-term stability.
4 CONCLUSION
In summary, we developed PtNi nanocatalysts with excellent stability and a high alloying degree. This was achieved by introducing a carbon layer surrounding the PtNi nanoparticles. This carbon layer was formed by inducing the carbonization of dopamine through a high-temperature treatment. The thickness of the carbon layer was controlled by altering the dopamine coating time. In this process, maintaining an optimized thickness for the carbon layer was important to improve the stability of the nanoparticles and prevent oxygen permeation as a catalyst reactant. The PtNi alloy nanocatalyst with a carbon layer significantly reduced the aggregation of the nanoparticles during high-temperature treatment so that a sufficient ECSA could be maintained. Therefore, the high degree of alloying and ECSA were attributed to the excellent activity of the electrochemical ORR. Additionally, even in a fuel cell long-term driving environment, the developed PtNi alloy nanocatalyst showed high performance and excellent stability, demonstrating the effectiveness of the carbon layer strategy in improving fuel cell performance. Therefore, encapsulating nanoparticles with a carbon layer is a reliable strategy to improve the activity and stability of alloy nanoparticle catalysts. In the future, the introduction of a carbon layer in multicomponent alloy nanostructures or intermetallic structures that require high-temperature heat treatment should be investigated.
ACKNOWLEDGEMENTS
I. Jang and S. Lee contributed equally to this work. This work was supported by the National Research Foundation of Korea (NRF) grant funded by the Korean government (2021M3H4A1A02042948, 2021M3H4A3A02086681). This work was also supported by the Korea Institute of Science and Technology Institutional Program.


