The importance of discriminative power rather than significance when evaluating potential clinical biomarkers in epilepsy research
UMC Utrecht Brain Center: Member of ERN EpiCARE.
Abstract
Objective
The quest for epilepsy biomarkers is on the rise. Variables with statistically significant group-level differences are often misinterpreted as biomarkers with sufficient discriminative power. This study aimed to demonstrate the relationship between significant group-level differences and a variable's power to discriminate between individuals.
Methods
We simulated normal-distributed datasets from hypothetical populations with varying sample sizes (25–800), effect sizes (Cohen's d: .25–2.50), and variability (standard deviation: 10–35) to assess the impact of these parameters on significance and discriminative power. The simulation data were illustrated by assessing the discriminative power of a potential real-case biomarker—the EEG beta band power—to diagnose generalized epilepsy, using data from 66 children with generalized epilepsy and 385 controls. Additionally, we evaluated recently reported epilepsy biomarkers by comparing their effect sizes to our simulation-derived effect size criterion.
Results
Group size affects significance but not discriminative power. Discriminative power is much more related to variability and effect size. Our real data example supported these simulation results by demonstrating that group-level significance does not translate, one to one, into discriminative power. Although we found a significant difference in the beta band power between children with and without epilepsy, the discriminative power was poor due to a small effect size. A Cohen's d of at least 1.25 is required to reach good discriminative power in univariable prediction modeling. Slightly over 60% of the biomarkers in our literature search met this criterion.
Significance
Rather than statistical significance of group-level differences, effect size should be used as an indicator of a variable's biomarker potential. The minimal required effects size for individual biomarkers—a Cohen's d of 1.25—is large. This calls for multivariable approaches, in which combining multiple variables with smaller effect sizes could increase the overall effect size and discriminative power.
Key Points
- The quest for epilepsy biomarkers is on the rise as they play an important role in the evolution of precision medicine.
- Statistical significance of mean group differences is a poor indicator of the individual-level discriminative power of a variable.
- Rather than significance, effect size has a strong relationship with discriminative power.
- Individual variables need extremely large effect sizes to have good discriminative power; we should, therefore, focus on combining variables.
- Widespread methodological knowledge of biomarker evaluation among researchers and clinicians might contribute to the further evolution of precision medicine.
1 INTRODUCTION
Proper diagnosis of epilepsy and prediction of its course are essential for effective management and patient counseling. Diagnostic and prognostic studies, therefore, aim to identify markers that can support these processes.1 Estimates of these markers are conventionally reported at the group level and used to infer population-wide conclusions. The emerging field of personalized medicine, however, targets the search for individualized markers—so-called biomarkers2—rather than group-averaged differences.
Biomarkers may have different applications but are generally defined as “characteristics that are measured as indicators of physiological processes, pathogenic processes, or biological responses to an exposure or intervention, including therapeutic interventions”.3 In the epilepsy field, quite some progress has been made in the discovery of both diagnostic and prognostic biomarkers.4 Besides epileptiform EEG activity as an important, but not entirely accurate, biomarker used in the diagnosis of epilepsy,5, 6 various microRNAs,7-9 proteins,10, 11 metabolites,12 and immune system components13, 14 have been proposed as biomarkers for the diagnosis of seizures and epilepsy subtypes. MRI markers, mainly network connectivity measures15, 16 and specific EEG (network) features17-20 have diagnostic value as well and seem to be able to predict epilepsy severity and refractoriness. Genetic markers, including polygenic risk scores (PRS),21 are also receiving growing interest as biomarkers of epileptogenesis and epilepsy risk, diagnosis, and prognosis (for overviews, see: Refs 22, 23).
Despite the large expansion in publications reporting potential biomarkers in the epilepsy field—and beyond—very few biomarkers have yet found their way to clinical practice. Specific disease-related challenges, such as seizures near the time of biomarker sampling and the use of anti-seizure medications (ASMs), might play a role in this, as they can have a direct effect on biomarker levels (e.g., miRNA)24 and thus distort measurements. Another important contributing factor is that statistical significance is still often incorrectly interpreted as the power to identify personal traits, resulting in low discriminative power.25 Group-level significance is based on average rather than individual differences, whereas the performance of a biomarker is defined by both the difference and the variation between individuals. Therefore, new markers should be evaluated on their discriminative performance rather than on statistically significant group differences before labelling them as biomarkers.26
This study aimed to reinforce the idea that caution is needed in identifying and reporting differences in markers at the group level as biomarkers that can discriminate between subjects at the individual level. We do not claim that this idea is new,25 but merely wish to illustrate the importance of this concept for the interpretation and potential usage of epilepsy biomarkers. Therefore, we first assessed the relationship between significant group-level differences and a marker's power to discriminate between individuals in a simulated setting. Secondly, we provide a real data example evaluating a potential biomarker—EEG beta power oscillations—for diagnosing generalized epilepsy in children previously, as published in Epilepsia.27 Thirdly, we evaluated the recent scientific literature on new potential biomarkers in epilepsy.
2 MATERIALS AND METHODS
2.1 Data simulation
Biomarkers may quantify different types of outcomes: binary, continuous, or correlational (Figure 1). The logarithmic (log) transformed odds ratio from binary data, as well as Pearson's correlation coefficient (r) from correlational data, is convertible into the same standardized mean difference (SMD) obtained from continuous data. The SMD, also named Cohen's d, is one of the most commonly used effect size measures, indicating how many standard deviations (SDs) two group means differ.28 Hence, we restricted our simulations to Cohen's d outcome.

We performed two different sets of simulations. The first set was used to evaluate the impact of both sample size and effect size on discriminative power. We generated multiple normally distributed datasets sampled from hypothetical populations, reflecting outcomes in a patient and control group (control mean: 100; standard deviation: 15), with varying sample sizes (25–800) and effect sizes (.25–2.50). Equally sized datasets with similar parameters were generated and used as independent validation data to evaluate the discriminative power. The second set of simulations, used to evaluate the relationship between variability and discriminative power, was based on similarly generated datasets but with a fixed mean of the control and patient group (100 and 115, respectively), a fixed sample size (400 subjects per group), and varying SDs (10–35). The simulation code is available via the Zenodo platform (DOI: 10.5281/zenodo.7095386).29
We evaluated the group-level differences in outcome between the patient and control groups using the Z value. The discriminative power of the simulated biomarkers was evaluated using receiver operating characteristic (ROC) curve analysis30 (Box 1, Figure 2).
BOX 1. Z value and ROC analysis
Evaluation of statistical significance
The Z value can be used to characterize the difference between two groups. With a significance level of .05 and the corresponding 95% confidence interval (CI), Z values smaller than −1.96 and greater than1.96 will yield significant results.31
Evaluation of predictive power
The receiver operating characteristic (ROC) curve analysis can be used to evaluate discriminative power.30 An ROC curve is a graphical representation of the true-positive rate (TPR; i.e., sensitivity) against the false-positive rate (FPR; i.e., 1-specificity). The TPR represents the proportion of study subjects correctly classified as patients (TP) out of the total number of patients (TP + FN). Similarly, the FPR is the proportion of subjects incorrectly classified as patients (FP) out of all control subjects (TN + FP). The TPR and FPR can be calculated for every possible threshold value of a biomarker or test. An ROC curve is generated by plotting the TPR and FPR across varying thresholds (Figure 2).32 The area under the curve (AUC) summarizes the area underneath the entire ROC curve across all possible thresholds and thus provides an overall and combined measure of sensitivity and specificity. The AUC ranges between 0 and 1, where .5 indicates that the model does not perform better than chance. The closer the AUC comes to 1.0, the better a biomarker can discriminate between patients and controls.30, 32
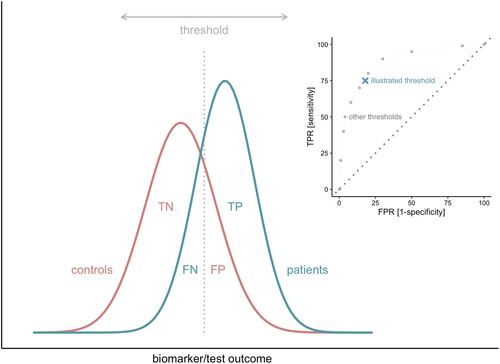
2.2 Example: EEG beta band power in generalized epilepsy
To illustrate the simulations with real research data, we evaluated a potential epilepsy biomarker derived from one of our group's recently published research projects.27 This project demonstrated a significant genetic relationship between generalized epilepsy (GE) and background beta power oscillations on resting-state EEG. As this points to a shared biological mechanism underlying background EEG beta band oscillations and the susceptibility for or development of generalized seizures, we hypothesized that altered background beta power oscillations might indicate a prodromal state or be a feature of GE and thus could potentially be a diagnostic GE biomarker.27 Therefore, we investigated the difference in beta power oscillations in children with GE compared to children without epilepsy, and the accuracy of the beta power oscillations for diagnosing GE.
2.2.1 Study cohort and EEG data collection
We retrospectively reviewed children (0–18 years) referred to the outpatient First Seizure Clinic (FSC) of the Wilhelmina Children's Hospital, Utrecht, the Netherlands, between January 2008 and May 2018, after a suspected first seizure. Diagnoses were made, directly after the FSC evaluation or after additional investigations if needed, by an experienced pediatric neurologist according to the epilepsy definition and classification of the International League Against Epilepsy (ILAE).33, 34 For the analyses, we only included children diagnosed with GE (cases) and children in whom the epilepsy diagnosis was discarded (controls).
For each child, we collected demographic data, including sex, age at EEG recording, seizure history (defined as a history of febrile seizures, neonatal convulsions, or acute symptomatic seizures), and other neurological history (defined as a history of or the presence of perinatal asphyxia, congenital or acquired brain lesions, head trauma, central nervous system infections, or migraine). We also collected the raw data of the first routinely performed EEG. All EEGs were recorded with at least 21 scalp electrodes, arranged according to the international 10–20 system (SystemPLUS Evolution; Micromed). Sampling frequency varied between 256 and 2048 Hz. EEGs were exported as raw TRC files and, in case of a higher sampling frequency, down-sampled to 256 Hz. From each EEG, we selected one 15-s eyes-closed resting-state epoch without epileptiform discharges, nonspecific abnormalities, or artifacts. Epoch data were filtered into the beta (13–30 Hz) band. We computed the beta band signal power for the vertex electrode (Cz) according to Smit et al.35 and Stevelink et al.27
The institutional review board approved using the retrospective data for research purposes without explicit informed consent (project numbers 09-353/K and 18-354/C).
2.2.2 Statistical analysis
We applied a logarithmic transformation to the Cz signal beta power data, referring to it as simply the Cz power. Group differences in the Cz power were assessed using the Mann–Whitney–Wilcoxon test for independent samples. We fitted both univariable and multivariable logistic regression models to evaluate the ability of the Cz power to discriminate between children with GE and children without epilepsy. The multivariable model included the Cz power and four demographic variables—sex, neurological history, age at EEG, and seizure history—of which the first two are known predictors of the diagnosis of pediatric epilepsy.36 Model predictions were normalized. ROC curve analysis (Box 1, Figure 2) was used for model evaluation. Because of the solely explanatory nature of the data example, we did not perform internal and external model validation.
All analyses were performed in R statistical software37 using the psd package (version 2.1.0)38 and pROC package (version 1.18.0).39
2.3 Effect sizes reported in the literature
To get a sense of biomarker effect sizes obtained in the epilepsy field, we searched PubMed for recent (2019–2021) publications reporting novel individual biomarkers across all areas of epilepsy research. We compared the biomarkers' effect sizes to our simulation-derived effect size criterion. We used the following query: “epilepsy[tiab] AND biomarker[tiab] AND Humans[MESH] AND English[LANG] NOT (meta-analysis[tiab] OR review[tiab]) AND 2019/01/01:2021/12/31[DP]” and only included entries with an abstract and a free full-text document (i.e., open access). We extracted the biomarker type, sample size, effect size, and AUC data from each publication. We calculated the effect size in case it was not explicitly given. From publications reporting multiple biomarkers or one biomarker for various subgroups, we extracted the largest effect size. All effect sizes were converted to Cohen's d and absolutized. We characterized the distribution of both the reported effect sizes and sample sizes.
3 RESULTS
3.1 Data simulation
3.1.1 Sample size
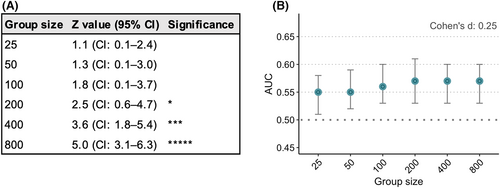
Sample size has a strong relationship with group-level significance, as an increase in sample size directly increases the Z value. Therefore, large sample sizes give significant differences at the group level, even with a small effect size of Cohen's d .25 (Figure 3A). By contrast, sample size hardly has any effect on discriminative power, expressed as the AUC. In the case of an effect size of Cohen's d .25, the AUC was .55 (95% CI: .51–.58) with 25 subjects per group and increased to .57 (95% CI: .53–.61) with 200 subjects per group (Figure 3B, Table S1).
3.1.2 Effect size
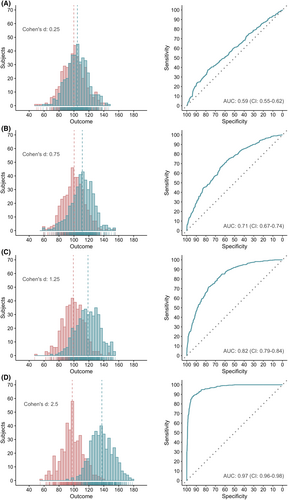
In contrast to the sample size, the effect size strongly affects the AUC. The greater the effect size of a biomarker, the better its discriminative power (Figure 4). A single, normally distributed biomarker requires a Cohen's d of at least 1.25 to reach an AUC of .80 (Figure 4C), considered as the lower limit of good discrimination.32, 40 Biomarkers with both a sensitivity and specificity of .8 or 80%—instead of combined in the AUC—require an even greater effect size, namely a Cohen's d of 1.66 (Figure S1). Effect sizes of 1.25 and 1.66 correspond to odds ratios (OR) of 9.65 (Table S2) and 20.31, respectively. The combined impact of sample size and effect size on the AUC is shown in Figure S2.
3.1.3 Data variability
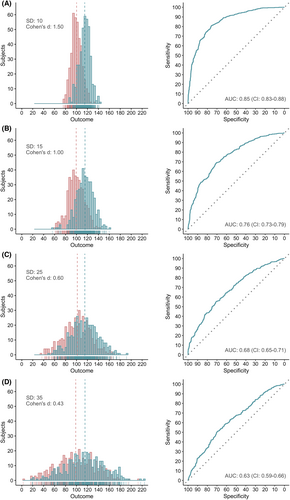
The AUC is also highly dependent on data variability, expressed as SD. Since Cohen's d is calculated by subtracting the means of the control group and patient group, divided by the pooled SD, an increase of the SD directly leads to a decrease in Cohen's d. This translates, as shown in Figure 4, into a decreased AUC (Figure 5).
3.2 Example: EEG beta band power in generalized epilepsy
A total of 587 children (54.9% boys), with a mean age of 8.8 ± 4.2 years at the first EEG recording, were evaluated at the FSC. Previous seizures (other than in the context of epilepsy) occurred in 97 children (16.5%), and 110 children (18.7%) had other neurological problems in their medical history. Of the 587 children, 136 (23.2%) were diagnosed with focal epilepsy and 66 (11.2%) with generalized epilepsy. The remaining 385 (65.6%) children did not have epilepsy and served as controls. For analysis, we only included the controls and children with generalized epilepsy.
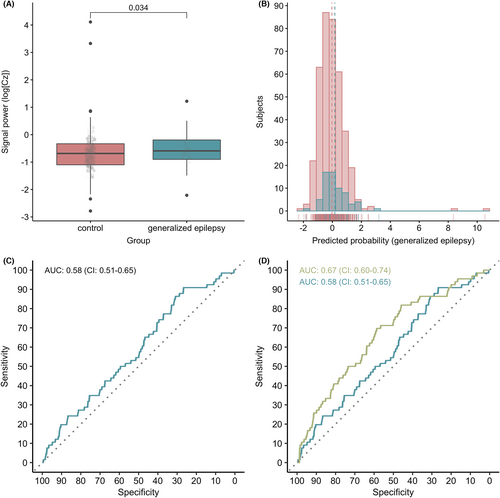
The beta band Cz power was significantly higher in children with generalized epilepsy than in children without epilepsy, with a median difference of −.075 (CI: −.14 to −.0064; p = .034) (Figure 6A). However, univariable model predictions, with the Cz power as the sole predictor, for the presence of generalized epilepsy had poor discriminative power, with an AUC of .58 (CI: .51–.65) (Figure 6B,C). Adding the variables, sex, seizure history, age at EEG recording, and neurological history to the model, improved the overall performance to an AUC of .67 (CI: .60–.74) (Figure 6C,D).
3.3 Effect sizes reported in the literature
The PubMed search yielded 123 results on April 08, 2022. A total of 91 publications were excluded for the following reasons: no report of a new single biomarker (n = 25), reported data not useful for analysis (n = 24), research not primarily focused on epilepsy (n = 17), no report of human data (n = 12), no original research (n = 10), case studies (n = 3). Of the 32 included publications, 13 reported a neurophysiological biomarker, while nine reported a molecular and eight an imaging biomarker. The two remaining studies presented a genetic biomarker and a biomarker which did not fit in one of the categories mentioned above. The references and categorization of the publications can be found in Appendix S3. In all publications, the described findings were explicitly labeled as “biomarkers,” though in most cases with caution, expressed with terms such as “potential” and “may be.”
Of all included publications, 62.5% reported effect sizes for their biomarkers equal to or greater than the proposed minimal Cohen's d of 1.25 (Figure S3A). Since we only extracted the largest effect size from each publication, these numbers represent the best-case scenario. A total of 12 publications reported AUC data for (one of) the individual biomarkers presented (Figure 3B). Sample sizes were generally smaller than 50 subjects per subgroup (i.e., control or patient group) (Figure 3C).
4 DISCUSSION
This study demonstrates the discrepancy between group-level significance and the individual-level discriminative power of potential biomarkers. In contrast to what is often implied when significant group differences are put into perspective, the statistical significance of mean group differences is a very poor indicator of the utility of a variable as an individual biomarker. Rather than significance, the effect size directly impacts discriminative power and is thus more suitable for evaluating a variable's biomarker potential.
Are group-level differences not important at all? The importance of one (group-level) or the other (individual-level) outcome depends on the research question and the stage of the research. In fact, most biomarker research starts with the search for group-level differences, as this is the basis for estimating the effect size. Therefore, also sample size matters. Although sample size does, as shown, not affect discriminative power, effect size estimates can only be precise and accurate with an appropriate sample size.41 Both underestimates and overestimates of the effect size can result in a distorted view of a variable's potential to be a biomarker.
Based on the required effect size, many individual variables will probably not qualify as good biomarkers. Moderate to even large effect sizes, traditionally defined as Cohen's d's of .5–1.0,42 do not translate into sufficient discriminative power if tested in isolation. Our results show that an effect size of 1.25, corresponding to an OR of almost 10, is needed for a variable to reach an AUC value of at least .8. Biomarkers with both a sensitivity and specificity of .8 require an even larger Cohen's d of 1.66, which corresponds to an OR greater than 20. We found a relatively large number of biomarkers with a large effect size in our concise literature search. This number might be inflated as we only reviewed publications explicitly reporting a “biomarker” in the title or abstract. Nonetheless, 37.5% of the studies reported a biomarker with an effect size smaller than a Cohen's d of 1.25. The minimal required effect size for individual biomarkers promotes the use of multivariable approaches. As illustrated in our data example, combining multiple (clinical) variables with smaller effect sizes could increase the overall effect size and discriminative power. Multivariable approaches also better suit the complexity of the pathophysiology of epilepsy.
Our study has limitations. We only simulated normally distributed data, whereas typical epilepsy outcomes are often distributed according to more complex patterns. Moreover, our simulated training (i.e., the original) and validation datasets had the same distribution parameters, while in a real-case scenario, those datasets are likely to differ—at least to some extent—in distribution as they are collected from independent populations. Hence, our simulation results might be too optimistic. Secondly, we collected our example data retrospectively, which is generally regarded as a suboptimal approach for evaluating a diagnostic biomarker.30 Nevertheless, we best approximated a prospective study by sampling patients and controls from a suspected, not yet diagnosed population. Additionally, to keep our example as clear as possible, we quantified the discriminative ability of the EEG data models using the same data from which the models were developed.43 Model validation on independent data most likely would have yielded even worse discriminative power, strengthening our general message to be careful with p values and focus on sensitivity, specificity, and the AUC. Lastly, besides traditional ROC analysis, other biomarker evaluation methods exist,44, 45 particularly for assessing a biomarker's added value, clinical utility, or healthcare impact. Although we did not cover these methods here, we are aware that discovering biomarkers with sufficient discriminative power is the first rather than the last step of the biomarker evaluation process, as discriminative power does not necessarily translate into added value in clinical practice or improved outcomes for the patient or healthcare system.46
We do not intend to present a pessimistic view of biomarker discovery efforts, as we believe biomarkers will have an invaluable role in personalized medicine in epilepsy.47 Instead, we aim to promote the use of appropriate biomarker selection methods and increase methodological knowledge. This study might aid with translating published effect sizes into hypothetical AUC values. In line with this, we recommend researchers to always report effect sizes instead of only p values.48 Moreover, we call for the objective reporting of study results without unsupported or unjustified claims on biomarker potential. Growing knowledge and awareness of the methodology of biomarker research on both the authors' and interpreters' side will help move the field in the right direction and contribute to the further evolution of precision medicine.
ACKNOWLEDGMENTS
GS was supported by the Friends UMC Utrecht/MING Fund and a Research Fellowship from the Brain Center Rudolf Magnus (current name: UMC Utrecht Brain Center). RS was supported by the Friends UMC Utrecht/MING Fund. EvD was supported by a Clinical Research Fellowship from the UMC Utrecht.
CONFLICT OF INTEREST STATEMENT
None of the authors have any conflicts of interest to disclose. We confirm that we have read the journal's position on issues involved in ethical publication and that this report is consistent with those guidelines.
Open Research
DATA AVAILABILITY STATEMENT
Simulation data scripts are publicly available via the Zenodo platform: https://zenodo.org/record/7095386#.ZBM5iS2iFpQ. Deidentified data may be obtained from a third party and are not publicly available. Request via the corresponding author.
REFERENCES
Test yourself
-
What is true about the relationship between sample size and discriminative power?
- The larger the sample size, the better the discriminative power
- The larger the sample size, the worse the discriminative power
- Sample size only impacts discriminative power in cases with small sample size
- Sample size does not have an impact on discriminative power
-
How does data variability (e.g., the standard deviation) impact effect size?
- Data variability does not have an impact on effect size
- An increase of the data variability leads to a decrease of the effect size
- A decrease of the data variability leads to a decrease of the effect size
-
Suppose you have found a new variable Y that might aid in discriminating epileptic seizures from vasovagal events. Its discriminative power, expressed as AUC, however, is only 0.62. What might help best to increase the AUC?
- Test the performance of variable Y in another, independent population
- Combine variable Y with other variables in a multivariable model
- Make sure you enter an equal number of seizures and vasovagal events in your analyses
Answers may be found in the supporting information.


