Quality Assurance for Flexible Stack Assembly of Lithium-Ion Cells
Abstract
The development and scale-up of lithium-ion battery (LIB) production for a sustainable energy supply is advancing very rapidly and in versatile directions. Manufacturing processes and production steps are constantly developed and optimized to improve production efficiency. To integrate new machinery into a production line while conforming to the DIN EN ISO 9001 standards of certification, it is necessary to define the procedures for assuring product quality. Herein, a quality assurance concept is designed for an innovative flexible stacking process currently under development. Critical sources of errors are identified by employing the failure process matrix approach. On this basis, it is described how these errors are either avoided by suitable design of the machine components and its control or by which inspection technology is integrated to detect defective intermediate products. In the resulting quality assurance concept, a digital twin of the stacking machine is employed to constantly surveil process and product properties and also to facilitate the change of the produced products on the machine. Evaluating the quality management already in the design phase of the machine saves resources and enables a deeper understanding of the stacking process.
1 Introduction
Due to the transition toward a more sustainable energy usage, the demand for lithium-ion batteries (LIB) has been growing continuously and is predicted to further increase in the future.[1, 2] The materials and compositions of electrodes and separators are being developed constantly and used to further improve the cell performance, e.g., regarding energy density.[3] Also, the production processes and machines are continuously improved to achieve higher efficiency. Therefore, there is a need to scale up new or adapted components and production technology in LIB production to fulfill customer requirements. However, information in the industrial sector on how to handle these scale-up processes is scarce. Many production processes are being scaled-up before the underlying process behavior has been fully understood and controlled.[4, 5] This leads to substantial scrap rates during ramp-up by searching for suitable process parameters and therefore increases manufacturing costs. This highlights the importance of fully understanding and controlling the processes before they are transferred to an industrial scale.[6]
A significant number of production companies have quality management systems certified according to the requirements of the German industrial standard DIN EN ISO 9001. To conform with this standard, it is necessary to define in detail how the quality of the products is assured in each process step.[7] Therefore, to integrate new machinery into an industrial production plant also the quality assurance measures to be executed have to be planned.
Quality management measures are defined to detect possible failure modes in the process causing compromised product quality. For setting up these measures, quality features corresponding to the failure modes are derived and suitable measurement equipment to monitor these are identified. While there are several approaches described in the literature on how to identify these possible failure modes, only Kölmel[8] suggested a comprehensive procedure for all of these steps. In his work, the failure process matrix (FPM) is used to derive the quality features to be measured in a structured process, followed by attributing suitable equipment, like camera systems or sensors, for the measurement procedures.[8] The FPM builds upon the standardized failure modes and effects analysis (DIN EN 60 812[9, 10] and is adapted to individual use cases.[8] Another method for identifying influencing variables in cross-process production chains like battery cell production focuses on adding the tacit knowledge of experienced employees to the existing explicit knowledge.[11] Westermeier[12, 13] described a method to identify cause–effect relationships in complex process chains like battery cell production using a combination of multiple domain matrices and a modified FMEA. This method can already be applied in the early design stages of the product and production processes to identify failure modes and quality features.[12] Another expert-based approach emphasizes the importance of defining process and product parameters and cause–effect relationships to plan the data acquisition and the measurement technology needed for quality management.[14] The previously described expert-based approaches to identify cause–effect relationships are complemented with data-driven ones, like process capability indices.[15]
During the start-up and also in the running production, data-driven approaches can be used in the context of quality management to reduce rejection rates in cell production, leading to more efficient production processes.[16] Besides the established method of statistical process control,[17] i.e., using quality control charts, recent approaches use data mining[18] and the combination of expert knowledge and data analysis to improve production quality and detect failures.[19] Also, establishing quality gates in the cell production line is currently under investigation.[20] The previously described approaches are all applied to a variety of different production scenarios and exemplary processes in LIB production. To the best knowledge of the authors, there is no publication in which the complete process from the identification of failure modes to choosing measurement equipment to finally deriving a quality management concept for production is outlined in full detail.
A way to accelerate the start-up of large-scale machinery and simultaneously reduce waste is the modeling of the process or the employed machine's functionality during its development phase in the form of a digital twin.[21] In LIB production, digital twins were implemented for various applications;[22] examples were the simulation of the calendering process using the discrete element method[23, 24] or surveilling the electrode extrusion.[22]
Regarding the acquisition of data on the process behavior and product quality, soft sensoring can be a useful approach to gain data for non-measurable parameters or if the number of hardware sensors placeable in a machine is limited. Here, the analysis of the data registered with different hardware sensors is combined with a software to gain insights into the non-measurable parameters.[25]
Using digital twins, a part of the optimization of the machine functions during production start-up can be performed in a virtual environment, which reduces material scrap during the ramp-up phase. Also here, there is no publication known showing how the functionality of the digital twin is used in the context of quality management measures applied in production processes.
In this article, a quality assurance concept for an innovative machine concept for flexible stacking of LIB is derived comprising data analysis from hardware sensors, simulations in a digital twin of the machine, statistical process control, and checks on intermediate product samples. The focused machine was designed to quickly adapt to changing material properties of the processed electrodes, e.g. higher or lower coating thicknesses and Young's modulus, while at the same time also allowing for a flexible selection of the manufactured cell formats.[26, 27] The latter is changed by varying the dimensions of the electrode sheets. By doing so, different sizes of cells can be produced using one single stacking machine without having to undergo time-consuming adjustments or recalibrations. The lot sizes of the manufactured LIB can be reduced and adaptations of the finished cell to customer requirements are therefore made economically feasible for small and medium volume production. The developed quality assurance concept has to support this flexibility in changing cell formats and materials.
This article starts by introducing the new flexible stacking machine. Afterward, we outline the process of identifying and ranking probable failure modes using the FPM, deriving the quality features to be monitored during production and the necessary sensors, data analysis, and quality assurance procedures to do so. Finally, the resulting measures and simulated processes are experimentally validated.
2 The Flexible Cell Stacking Process
Within state-of-the-art cell manufacturing operations, the cell stacking process represents the transition from a continuous roll-to-roll electrode production to discrete process steps for battery cell assembly. Due to the physical limitations which exist when gripping and handling individual electrode sheets during stacking, this process is often a limiting factor when optimizing the factory throughput. For example, a format change in conventional z-stack processes results in an increased effort. The mechanical components of the machine and the control program have to be adapted and replaced. This results in manufacturing downtimes.
By combining the stacking operation with the upstream cutting process, Weinmann et al.[27] introduced the “Coil2Stack” concept, by which the creation of cell stacks in a continuous production workflow was made possible. This concept will be referred to as Gen. 1 in the course of this article. It allows for the fast change of electrode dimensions within the ongoing manufacturing process. It, therefore, represents a machine concept, which is both flexible and continuous.
Figure 1 displays the machine in the context of the entire battery cell production.
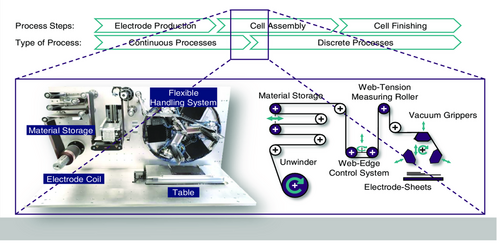
The machine uses a coiled electrode web as input material for the process. It is fed through numerous rollers, the horizontally moveable ones of which act as a material storage, before passing a web edge control system and a web tension measuring roller. The web tension represents an important machine parameter during production and is controlled by the pressure within the material storage system and the speed of the unwinder for the electrode coil. Finally, vacuum grippers are used to secure the web, while individual sheets are being cut. The electrode sheets are then immediately placed on the growing electrode stack, without having to be palletized or otherwise stored in between. This decreases the amount of handling operations and allows for fast operation with high precision. Different size electrodes can be cut by adjusting the position of the vacuum grippers in an axial direction, thus creating a flexible system. It can be used in both high throughput use cases, but also when smaller lot sizes need to be manufactured.
A digital twin of the machine has been introduced by Husseini et al.[26] to simulate the behavior of the equipment before starting the actual operation. This allows for the early optimization of different machine parameters and thus an even faster change of the processed materials and the different electrode sizes.
Based on the results and learnings from Gen. 1, its successor is currently under development. It will be referred to as Gen. 2 in this article. The aim is to produce an entire electrode compound with the Gen. 2 machine by doubling the machine components of Gen. 1 for electrode handling and cutting and including an additional system for the continuous transport of the separator. Especially due to the limited possibilities to integrate hardware sensors into the Gen. 1 demonstrator, some of the quality measures and measurement technology identified for the quality assurance concept are shown for Gen. 2.
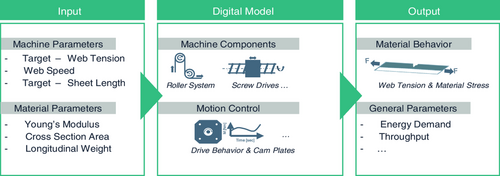
Figure 2 illustrates the concept of the digital twin for the Gen.1 machine. The digital twin consists of a system simulation of the machine behavior. Here, the corresponding machine components and the motion control are represented via physical relationships. Inputs to the model are the machine parameters and material parameters that can be set on the real machine. Outputs of the model are primarily values for the web tension occurring in the machine and other general parameters, such as the energy requirement and throughput. With the help of the digital twin, it is possible to quantify values that cannot be measured (virtual sensing). For example, the web tension of the electrode can be determined at any position in the machine via virtual sensors. In the main, the calculations are based on differential equations. For the calculation of the web tension, relations to the conservation of mass are used. The corresponding relationships are described in ref. [28]
3 Objective and Approach for Quality Planning
To integrate the new flexible stacking process into a production line while conforming to the DIN EN ISO 9001 standards of certification, a quality assurance concept for its use in production is necessary. Due to the frequent changes in the product properties in the flexible assembly process focused in this article, the production resembles a constant ramp-up process resulting in small data sets on identical products. Thus, the quality measures employed for such a process have to be appropriate to the planned production scenarios and suitable for the properties of the data available. Here, standard quality management methods like statistical process control are limited, as they require relatively high amounts of data.
Furthermore, to assure a quick ramp-up of cell variants in terms of format and material with a low scrap rate while meeting the quality requirements, the fitting process parameters have to be found quickly. To the best of the authors’ knowledge, there is no approach described in the literature that extensively describes the process of designing a quality assurance system for a highly product-flexible process in the context of battery cell production.
For planning the quality assurance system, a three-step approach was pursued (cf. Figure 3). The first two steps are adapted from the method presented by[8] offering a sequence of methods from structure analysis to choice of measurement equipment. As an extensive catalog of suitable equipment is not available from the literature for the functionalities realized in the flexible stacking machine, the second step of the method was altered for an expert-based choice of measurement equipment. Based on the results of step 2, the assurance procedures were defined while considering the focused production scenarios of material change and altering the format of the sheets to be confectioned.

In the following, the results of the described steps are outlined in detail.
4 Results
To be able to showcase that the planned assurance measures are usable in the production process, the main focus was set on Gen. 1 of the machine. This is true for both the application of the methods and the results shown. Where reasonable, the analysis was extended to the broader functionality of Gen. 2.
The first two steps of the applied procedure (cf. Figure 3) were performed in workshops with the experts involved in the development of Gen. 1 and 2. The workshops were held in several online conferences of a maximum of 1.5 h moderated by the expert on quality management. During the sessions, the three development experts systematically filled out prepared forms for the two steps.
4.1 Definition of Features for Quality Assurance
For planning the inspection processes for a product to be tested, it is necessary to identify and precisely describe its features.[8] Therefore, the spectrum and structure of processable materials and intermediate products were analyzed using a morphological box (cf. Table A1). For the analysis shown in this article, the intermediate products electrode web, cut electrode sheet, and stacked electrode sheet were chosen as these correspond to the functionality realized in the demonstrator Gen. 1 on which the experiments were carried out (cf. Chapter 5).
From the identified structure of product properties with subfunctions, quality features, and properties to be tested were derived. To gain a deeper understanding of the functionality of the system, also the subprocesses of the flexible stacking processes were depicted in a structure analysis (cf. Table 1).
| Subprocesses | Specification | |
|---|---|---|
| Cutting of electrode sheets | Unwinding electrode web | Setting via rotational speed of the unwinder motor |
| Web guidance of electrode web | Adjustment of the unwinder in the y-direction (coarse adjustment), use of rotating frame (fine adjustment), guidance via deflection rollers | |
| Gripping and winding the electrode web | Gripping by vacuum elements, switching on vacuum, setting via rotational speed of the rewinder motor | |
| Cutting the electrode web to length | Shear cutting process, Switching on the compressed air causes cylinder movement | |
| Depositing of electrode sheet | Depositing the electrode sheet | Switching off the vacuum and blowing off the electrode sheet |
| Fixation of the deposited electrode sheet | Gripping the electrode sheet on a vacuum table | |
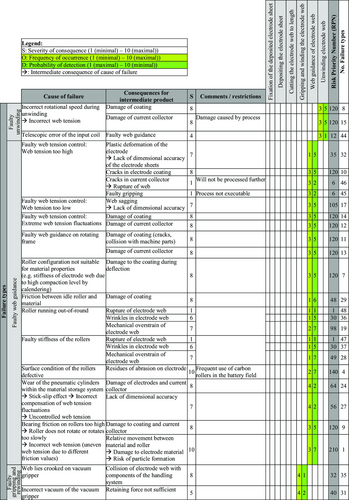
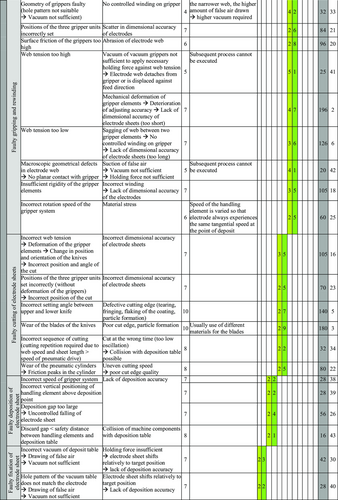
Those failure types with the highest RPN scores are prioritized to either being avoided by means of process control, system design, or—if that is not possible—quality assurance measures employing tests during production. Figure 4 shows the failure types ranked by their RPN for the flexible stacking machine (Gen. 1) together with the cumulated share of RPN. For reasons of clarity, only the failure types with an RPN higher than 100 are displayed. The comprehensive table of failure types with failure causes and consequences, ranked for the RPN, can be found in the supplementary material (cf. Table S1, Supporting Information).
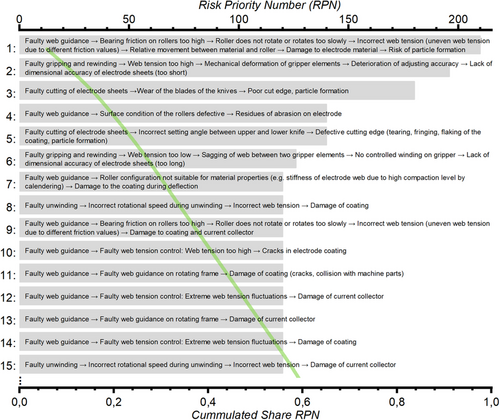
An incorrect web guidance, especially an unsuitable web tension, is a major risk of damage to the produced electrodes. Also, those failure types including the risk of particle formation are ranked high (Severity = 10). This can be attributed to the high risk of internal short circuits in the battery cell if particles are enclosed.[29]
4.2 Selection of Measurement Equipment for Quality Assurance
From the potential failures identified in each subprocess, the quality features of the intermediate products are derived. As Gen. 1 is a demonstrator for the processes on one electrode, not all technical design solutions and sensors could be integrated into it to assure all mentioned quality features. Therefore, the solutions that will be integrated into the second-generation demonstrator (Gen. 2) are also mentioned in the tables (cf. Table A2-A4–A5).
First, it is analyzed if the quality can be assured by suitably designing the machine's functionality, components, and process control (cf. Table A5). If not, technically suitable measurement and testing equipment and procedures are attributed to the quality features (cf. Table A4).
It is also necessary to assure that the incoming electrode coils are intact (i.e., no cracks, wrinkles, camber effect, etc.) and that their material properties are suitable to be processed on the flexible stacking machine. Therefore, visual inspections and measurements of these properties are either performed during electrode production (cf. Table A3) or just before the flexible stacking process (cf. Table A2).
Nevertheless, while prioritizing the testing equipment and procedures it was made sure that measures are taken to prevent those failure types attributed with the highest RPN values (cf. second columns of Table A2–A5).
4.3 Scenario-Based Concept for Quality Assurance of a Format-Flexible Stacking Process
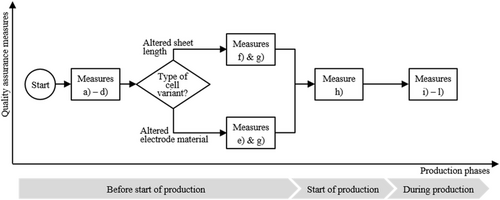
The measures for surveilling the production processes and inspecting the intermediate products are specified in a quality assurance concept (QAC, cf. Figure 5 and Table 3) in which the previously defined equipment is employed to avoid the failure types (cf. Chapter 4.1 and Chapter 4.2). The production scenario assumed is a three-shift production in which the machine is running for 24 h a day, except for setup times (e.g., for changing the electrode and separator coils) or planned downtimes for maintenance. In flexible cell production, the main changes considered in this article influencing the continuous stacking process are either changes to the format of the electrode sheets, i.e., the sheet length to be cut, or changes to the electrode material, leading to different material properties (cf. Chapter 2).
| Before start of production |
a) Checks on input material in upstream processes: a) Check for correct coil diameter for mandrel holder; b) Uniform thickness of the electrode coating; c) Absence of geometrical defects from upstream processes (e.g., camber effect, corrugation) |
|
b) Visual inspections on input material in the stacking process: a) Straightness of the coil winding (no telescopic error, for each new coil); b) Uniformity of coating width and position of coating on current collector; c) Absence of geometrical defects from upstream processes (e.g., camber effect, corrugation) |
|
|
c) Experimental determination: a) Optimal gap distance between gripper wheel and vacuum table to reach deposition accuracy and meet safe distance between machine components |
|
|
d) Maintenance operations: a) Periodical inspection of pneumatic cylinders and rollers for wear and tear; b) Periodical inspection of the cutting blades |
|
|
e) Changing the electrode sheet length: a) Simulation of web tension and maximal acceptable web tension; b) Simulation of the gripper element positions for the chosen sheet length; c) Simulation of the rotational speed for chosen sheet length; d) Simulation of the sequence for rotation, cutting and deposition for safe operation of the machine |
|
|
f) Change of electrode material sampling: a) Measurement of Young's modulus and bending stiffness of the electrode (cantilever bending test bench); b) Simulation of web tension and maximal acceptable web tension |
|
|
g) Simulation of the pre-run to determine the tolerance limits for the control chart(s) |
|
| Start of production |
h) Pre-run for the definition of tolerance limits for quality control charts (j) |
| During production |
i) Visual inspections: a) Correct contact of electrode web on the grippers and vacuum elements; b) Damage on electrode coating and current collector (all subprocesses); c) Abrasion of the electrode and particles or wrinkles (all subprocesses) |
|
j) Continuous monitoring using quality control charts: a) Monitoring of the web tension recorded by measurement roller with integrated force sensor; intervention when tolerances are exceeded (lower limit: relative movement between gripper and electrode; upper limit: damage of the electrode material or foil, deformation of the grippers); b) Monitoring of the length accuracy: i) Simulation of the length accuracy of the cut sheets to be expected at web speed chosen and measured during the process; ii) Additional surveillance of the theoretical and actual material consumption (calculated from rotational speed read from PLC of unwinder) →Measuring physical sheet length initiated (sampling) if simulated accuracy tolerances are exceeded |
|
|
k) Integrated testing using simulation and physical measurements: a) For each coil: Simulation of the theoretical web tension corresponding to the web tension measured during production at measurement points → control on further measurement points (where physical measurement is not possible) in the model if web tension tolerances are likely to be exceeded during production |
|
|
l) Sampling: a) Measurement of the dimensional and stacking accuracy (length, angles, position on table), no wrinkles, areal contact with vacuum table and its repeatability using a 3D measuring system; b) Visual inspection of the cutting edge and electrode sheet surface for particles; c) Inspection of the cutting edge using SEM |
- a) Additional quality assurance measures might be required due to quality management standards in the respective plant.
In the concept, the quality assurance measures to be performed are grouped along the phases of production. The operations at the start of production and during production are identical for all product variants produced on the flexible stacking machine.
Before the start of production, it has to be assured in the prior calendering process that the winding cores of the incoming electrodes have a fitting coil diameter for the mandrel holder in the flexible stacking machine (cf. Table 3a). The electrode material is checked for a uniform coating thickness (cf. Table 3ab). Also, it should be flat both in conveying direction and crosswise to it to ensure a full-surface contact with the handling elements of the machine (relevant geometrical defects induced by calendaring, e.g., the camber effect, corrugation, or foil embossing, have been classified by[30]) (cf. Table 3ac). For the latter properties, the necessary data about the material is expected to be gathered during the calendering or the slitting process.
If the data is not available from predecessor processes or is incomplete, these properties are checked visually before the coil is set into the stacking machine.[5, 30] Also, the electrode must be wound straight on the coil (no telescopic error) and have a uniform coating width and position on the current collector (cf. Table 3b).
The gap width between the winding and cutting reel and the vacuum table has to be adjusted to allow for a high deposition accuracy of the cut electrode sheets onto the table. This is necessary for laminating the electrode in the accurate position on the separator in Gen. 2. For each electrode material with altered properties, the optimal gap distance must be determined experimentally (cf. Table 3c), see also[31]).
To assure the correct functioning of the machine, maintenance operations have to be performed periodically. While the check for wear and tear of the pneumatic cylinders and rollers can be set to time intervals of about weeks or months, the cutting blades should be checked for sharpness and changed if the visual inspection of the electrode sheets cut during the previous operation of the machine (cf. Table 3ic) indicated abrasion or imprecisions on the cutting edges (cf. Table 3d).
The described standard operations before the start of production are complemented by variant-specific ones. When the electrode sheet length is changed to a different length, several machine parameters have to be adjusted (cf. Table 3e). These are the position of the three elements of the gripper to cut the new electrode length and the corresponding rotational speed to be set for the machine components. Here, the digital twin of the machine is used for two aspects: On the one hand, the sequence for rotation, cutting, and sheet deposition resulting from the set parameters is simulated to assure that the machine runs safely and without collisions of machine components. Furthermore, it is controlled in the simulation that the web tension never exceeds the maximal acceptable value for the respective electrode material, possibly leading to material damage. Here, the digital twin allows for also checking the web tension at positions where no physical web tension sensors can be integrated into the machine.
When changing the electrode material (cf. Table 3f), Young's modulus (elongation and yield strength) of the electrode compound (coating and collector foil) must be determined using samples of the electrode web. This value is inserted in the digital twin to correctly simulate the material behavior during processing. Additionally, the bending stiffness of the material should be controlled using a bending test bench to assure that the electrode is processable on the machine's rollers. Also, for changing the electrode material, it must be controlled in the simulation so that the web tension occurring when the material is conveyed through the machine does not exceed the maximal acceptable value, hence the electrode's Young's modulus.
During production, the web tension of the electrode is measured using integrated force sensors and continuously monitored using automatically plotted quality control charts (cf. Table 3ja). To set the limits for warning and intervention, a pre-run of the machine has to be done with the previously chosen parameters. Here, the pre-run is done in the simulation first to set the limits of intervention for the quality control chart (cf. Table 3g,[17]). The validity of the chosen limits is checked in a physical pre-run at the start of production (cf. Table 3h). Throughout production, it is checked by visual inspection that the electrode web has full-surface contact with the grippers and vacuum elements. Also, it is surveilled if damages or wrinkles on the electrode or current collector occur or particles are produced by the subprocesses (cf. Table 3i).
In the continuous process, the length of the cut sheets can vary with the actual web tension occurring in the process. As the accuracy of the length is an important quality feature, it should be monitored throughout the process (cf. Table 3jb). A continuous visual inspection of the actual cut sheet length using camera systems is possible but complicated at high process speeds. A parallel simulation of the expected length accuracy at the web speed that is measured during the process allows for determining if the sheet length tolerances are likely to be exceeded. Additionally, the actual material consumption, calculated from the rotational speed provided by the PLC of the unwinder can be compared with the expected theoretical value for the number of cut sheets. If discrepancies are detected, the sheet length should be measured on samples.
Even if no damages on the electrodes and current collectors are detected by visual inspection during the process, it would be possible that the electrode has micro damages non-visible to the human eye. Similar to the simulations for determining the web tension in the first place and added to the web tension monitoring throughout production, the simulation could be run once again after the production of a batch or in parallel with the measured values for web tension as input factors (cf. Table 3k). By analyzing a higher number of measurement points throughout the web guidance in the machine, it can be controlled that the maximum acceptable web tension was not exceeded throughout production at any point.
Finally, the product characteristics, especially the geometrical accuracy of the cut sheets as well as the cutting edges should be regularly controlled (for every new coil as well after material or sheet length changes). This could be performed using a 3D measuring system, e.g., Carl Zeiss GOM Metrology GmbH, or a scanning electron microscope (SEM) (cf. Table 3l).
5 Proof of Concept, Implementation, and Validation of the Quality Assurance Measures
In the following section, aspects of data generation for the quality assurance measures presented are described using the example of the “Coil2Stack” machine (Gen. 1) for flexible and continuous cell stack assembly. The different data sets are generated by experiments on the aforementioned machine as well as by its digital twin of it.
For the analysis, two different electrode types (anode and cathode) and two different machine setups are being considered. Table 4 presents the determined material parameters and the parameters of the two machine setups. The anode is processed with machine setups 1 (referred to as “Anode Setup 1”) and 2 (referred to as “Anode Setup 2”). The cathode is processed with machine setup 1 (referred to as “Cathode Setup 1”). In addition to quantifying the necessary material parameters correctly as described in the following section (cf. QAC j in Table 3), several visual inspections of the material (cf. QAC b in Table 3) were performed before the start of the experimental validation.
| Material Parameter | Machine Setup | ||||
|---|---|---|---|---|---|
| Anode | Cathode | Setup 1 | Setup 2 | ||
| Young's modulus [GPa] | 54.6 | 56.7 | Target sheet length [mm] | 160 | 200 |
| Foil thickness [μm] | 10 | 19 | Target web tension [N] | 10 | 15 |
| Coating thickness [μm] (single side) | 73.5 | 64.5 | Web speed [mm s−1] | 8 | 12 |
| Total electrode width [mm] | 200 | 200 | |||
| Coating width [mm] | 148 | 156 | |||
| Foil grammage [mg mm−2] | 0.09 | 0.05 | |||
| Coating grammage [mg mm−2] | 0.07 | 0.14 | |||
5.1 Experimental Data Generation
For the experimental data generation, aspects of the intermediate products are measured, as well as machine data from the control system is recorded (cf. Table 5).
| Before starting the experiment | Determination of the Young’[s] modulus of both materials (QAC f) | |
|---|---|---|
| Checking whether the electrode material is suitable for wrapping on deflection rollers (QAC a) | ||
| Visual inspection of the electrode material on the coil (incoming inspection) (QAC b) | ||
| Experiments at the Gen. 1 machine (each per material/setup combination): | Cutting the electrode sheets (while maintaining their sequence on the coil) | |
| Data recording: | Speed and torques of the servo motors (Goal: Drawing conclusions on the correct unwinding of the coil) | |
| Vertical position, speed, and torque of the flexible handling system from the control system | ||
| Position of the delivery table (Goal: Determining the deposition gap between the table and handling system and matching it with deposition accuracy, QAC j) | ||
| Web tension via measuring roller (QAC j) | ||
| Intermediate product testing (after confectioning): | Deposition accuracy and dimensional accuracy (with GOM; 10 sheets per combination of material and machine setup) (QAC l) | |
| Sheet length (with GOM, measurement accuracy of 0.1-mm for all sheets) (QAC l) | ||
The determined data refers to the measured web tension at the handling system of the Gen. 1 machine, the measured vertical position of the handling element, the stacking accuracy of the machine, and the dimensional accuracy of the separated electrode sheets. The acquired measurements are shown in Figure 6.
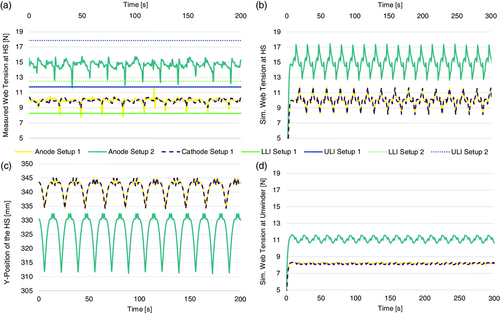
Figure 6c shows the measured position of the handling system in the vertical direction. It can be seen that the deflections and repetition frequency of the first machine setup are smaller than those of the second setup.
| Simulation for parameter determination before and at the start of experiments: | Definition of web tensions for all combinations of material and sheet length (QAC e and f) |
| Simulation of the stability of compliance with these web tensions (QAC e) | |
| Simulation of the pre-runs for the sheet length values (scatter of the dimensional accuracy of the electrodes as a function of the web tension) to determine the intervention and tolerance limits of the quality control charts (QAC [h]) | |
| Simulations for data collection in the cutting process (before or after experiments) | Position of all elements of the system (QAC e) |
| Web tension at each point in the system (QAC k) | |
| Quantification of the unwound material (QAC jbii.) | |
| Scattering of the dimensional accuracy of the electrode as a function of the web tension (QAC l) |
First of all, it can be seen that there are deviations in the set target web tension for both machine setups and the different materials. Overall, a greater fluctuation can be observed with the second setup as the machine operates at higher speeds where the web tension control is more difficult. Furthermore, the fluctuations are slightly smaller for the cathode. This is caused by different coefficients of friction between the surface of the electrode materials and the rollers of the machine.
Figure 7a illustrates the measured positional accuracy of individual electrode sheets, expressed by the deviation from the mean placement position of all electrodes. Here, single electrode sheets were deposited and then examined using a 3D measuring system (Company: Carl Zeiss GOM Metrology GmbH). The 3D measurement makes it possible to measure the distance of curved electrode sheets as well. The machine operation had to be interrupted after each deposited sheet, to allow for the measurements. For positioning accuracy, the distance between a point on the edge of the electrode sheet and a fixed point on the table was measured.

Figure 7b shows the measured deviation of the sheet lengths. Machine operation was not interrupted during the separation of these electrode sheets. The last two measurements correspond to QAC l).
5.2 Simulation
The following chapter shows the data sets that were generated with the digital twin of the Gen. 1 machine (cf. Table 6).
First, the web tension at the handling element of the machine was simulated for comparison with the measured data. In addition, these measurements were also used to determine the necessary limits of intervention for the physical measurement, in accordance with QAC e) and j) in Table 3. Figure 6b illustrates the simulated data. It can also be seen here that the deviation from the target web tension is higher with the second machine setup than with the first setup. There are only very slight differences in terms of the materials processed.
Simulating the data at the exact points in the digital twin, where the physical measurement points are, allows for a direct comparison with experimentally measured values. Additionally to that, further data was simulated that cannot be physically measured in the machine. These are, for example, the web tension at the unwinder and information about the processed material quantity.
Figure 6d shows the simulated web tension of the electrode materials at the unwinder of the machine. It can be seen that the fluctuation as well as the average web tension is lower compared to the values at the handling system.
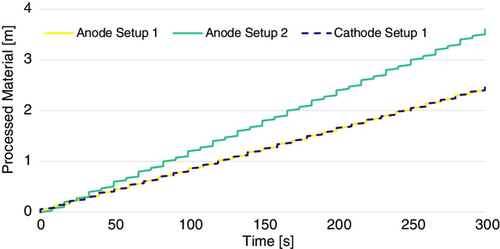
Figure 8 describes the amount of material processed in the machine. The processing of the material in the second setup is also faster due to the higher web speed. Furthermore, it can be seen that the amount of material processed does not increase exactly linearly. This is mainly due to the movement profile of the machine.
5.3 Evaluation and Interpretation
When comparing the measured values, such as the web tension at the handling system, with the simulated values, it can be seen that the different material properties are currently not adequately represented within the digital twin (cf. Figure 9). Therefore, the different machine setups will be compared with each other primarily. Nevertheless, the change in the standard deviations for the simulated and measured web tension follows the same trends. This indicates that the digital twin represents the machine's general functionality, even if the calculated parameters of the simulation are not identical to the physically measured ones.
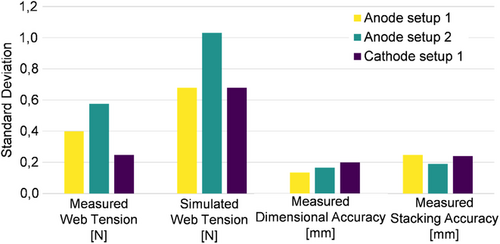
The limits for intervention for the quality control chart (cf. Figure 5a) were calculated in a simulated pre-run (cf. QAC g in Table 3). It can be seen that these limits are generally in the same range of values as the measured ones. However, the values for the simulated web tensions are generally higher than the web tensions on the physical machine. This results in web tensions exceeding the LLI. It can be concluded that, on the one hand, the digital twin should be further improved to better represent the nominal values of the machine's parameters. On the other hand, a pre-run on the physical machine (cf. QAC h in Table 3) should be performed after every change of product properties, to validate the limits drawn from the simulation.
The dimensional accuracy was tested to measure the length of the electrode sheets as an indicator of the final product quality. It was shown to correspond with the accuracy of the controlled web tension of the machine (QAC l in Table 3, cf. Figure 9). The second indicator for identifying deviations of the sheet length from the target value was thought to be the comparison between the simulated material consumption during production (cf. Figure 8 and QAC jbii in Table 3) and the unwound material actually used on the machine. This could not be performed due to the small sample number of cut electrode sheets and the intermitted machine operation during the experiments.
For the stacking accuracy (position of the sheet on the table) this interpretation cannot be drawn. This is primarily due to the necessity to bring the machine operation to a complete stop to perform each measurement of the deposition accuracy with the 3D measurement system in Gen. 1. It is, therefore, not possible to run the demonstrator continuously and as a result, the web tension of the process differs from the one during continuous operation. This step of the QAC should be tested for Gen. 2, in which the stacking accuracy will be surveilled using an integrated camera system.
In the presented experiments on Gen. 1, the incoming material controls were performed by visual inspection (QAC l in Table 3). This can be assumed to be sufficient to determine the processability of the electrode material used on the demonstrator. Nevertheless, the applicability of the QAC a) (cf. Table 3) should be validated in the course of realization of the Gen. 2 demonstrator, by analyzing the data from the incoming materials from the upstream processes.
6 Conclusion and Outlook
In this article, we demonstrated the development of a quality assurance concept based on Kölmel et al.[8] for two developmental generations of a flexible stacking machine for LIB manufacturing. In the concept, statistical process controls using quality function charts are combined with the simulation using a digital twin of the machine. This is carried out before the actual startup of a production step and also includes visual inspections and sampling.
The choice of measurement equipment was expert based. In further research, a methodological and literature-based approach to choosing inspection technology should be followed.
The applicability of the concept was tested exemplarily for the two production scenarios of changing the electrode material and altering the sheet format to be produced. The data was acquired both from experiments with the demonstrator and simulated with the corresponding digital twin.
The results showed that the identified tests in the concept are generally applicable to the demonstrator. Further work will be done to assure a higher conformity of the machine parameters, simulated via the digital twin, with the measured ones at the machine. This will also allow for the sensitivity of the quality measures of the QAC to detect failures during production in more detail.
Furthermore, the explicit implementation of the complete concept, i.e., maintenance and inspections intervals, are still dependent on the specific, final machine and its integration into a running production line.
Using the presented concept to start up a LIB production enables us to form a deeper understanding of process-specific interactions, e.g., the role of the web tension in the format of flexible stacking. Additionally, the early assessment of the quality can steer the development in an economically feasible direction, also by reducing iterations during the design phase of the machine, which is important for the volatile development in LIB production. The implemented quality measures of the concept together with employing the digital twin are expected to foster an efficient ramp-up of cell variants on the flexible stacking machine at a low scrap rate.
Acknowledgements
The presented research is funded by the German Federal Ministry of Education and Research (BMBF) under the funding code 03XP0252 (Project: E-Qual), the Center for Electrochemical Energy Storage Ulm Karlsruhe (CELEST), and the Battery Technology Center of KIT. The authors would like to thank the BMBF and the Project Management Organisation Jülich (PTJ) for their support and trusting cooperation.
Open Access funding enabled and organized by Projekt DEAL.
Conflict of Interest
The authors declare no conflict of interest.
Appendix
| Partial functions | Specification (exemplary) | ||||
|---|---|---|---|---|---|
| Electrode web | Width [mm] | 200 | 210 | … | |
| Coating width [mm] | 147 | 156 | … | ||
| Coating thickness [μm] | 65 | 74 | … | ||
| Thickness of current collector [μm] | 10 | 19 | … | ||
| Foil grammage [mg mm−2] | 0.05 | 0.09 | … | ||
| Coating grammage [mg mm−2] | 0.07 | 0.14 | … | ||
| Coating type | continuous | intermitted | … | ||
| Type of collector | notched | unnotched | … | ||
| Coating active material | Graphite | NMC622 | … | ||
| Material of current collector | Copper | Aluminum | … | ||
| Porosity [%] | – | – | |||
| Diameter of the coil [mm] | 600 | … | |||
| Compaction of material | Calendered | Not calendered | |||
| Cut electrode sheet | Length [mm] | 135 | 250 | … | |
| Width [mm] | 80 | 210 | … | ||
| Geometry of coating [mm] | – | ||||
| Geometry of collector [mm] | – | ||||
| Position of collector | Along web direction | ||||
| Coating grammage [mg mm−2] | 0.236 | … | |||
| Coating thickness [μm] | 108 | … | |||
| Foil grammage [mg mm−2] | 0.098 | … | |||
| Cutting technology | Shear cutting | ||||
| Coating active material | Graphite | NMC622 | … | … | |
| Material of current collector | Copper | Aluminum | |||
| Stacked electrode sheets | Technology for fixing electrode sheets on stack | Clamping in workpiece carrier | Palletized | Taped stack | Wrapping with separator |
| Number of layers | 20 | 80 | … | ||
| Alignment of electrode sheets/stacking accuracy [mm] | ≈0.2 | ||||
| Maximum height of stack | Dependent on the traverse depth of the stacking table | ||||
| Sub-process | No. Failure types | Quality features of input material | Measuring/Testing System (Gen. 1) | Measuring/Testing System (Gen. 2) |
|---|---|---|---|---|
| Incoming material inspection | 44 | Dimensional accuracy of the coil winding | Visual inspection | Web edge control after unwinder before pivoting frame: Shifting the coil in y-axis direction via actuator; Web edge control after pivoting frame: fine adjustment of web position via pivoting frame |
| Alignment of the coating (uniformity of the coating width and position of the coating on current collector foil) | Detection of coating edge via web edge control; Uniformity to be checked in pre-process | |||
| 9 | Stiffness of the electrode (degree of calendering) | Determination of bending stiffness per material (offline test, cantilever bending test rig), ensuring that limit value match the fixed roll diameter | ||
| 42 | Absence of macroscopic geometrical defects from upstream processes (flat electrode) | Visual inspection | Measurement during upstream processes (e.g., calendaring, slitting) via laser measuring system |
| Sub-process | No. Failure types | Quality features of input material | Measuring/Testing System |
|---|---|---|---|
| Incoming material inspection | Correct winding diameter for mandrel | Measurement via line laser after calendering process | |
| Uniform thickness of the electrode coating | To be checked in pre-processes | ||
| 42 | Absence of macroscopic geometrical defects from upstream processes (flat electrode) | Visual inspection |
| Sub-process | No. Failure types | Quality features of intermediate product | Measuring/Testing System (Gen. 1) | Measuring/Testing System (Gen. 2) | Comment |
|---|---|---|---|---|---|
| Unwinding electrode web | 10, 15 | Web speed suitable for material removal | Determination via rotational speed of the drives | ||
| 10, 15 | No damages to electrode and current collector foils (cracks, folds, etc.) | Visual inspection | Detection of web breaks analogous to coating and calendering; detection of damages via camera system | ||
| 1, 4, 7, 11, 14, 17, 19, 24, 27, 36, 48 | Constant web tension of the electrode in the web direction (no sagging, no wrinkling, rollers not out-of-round) | Monitoring web tension via measuring deflection rollers with integrated force sensor; Periodical inspection of pneumatic cylinders and rollers | Correct design of the rollers for material spectrum | ||
| 7, 8, 12, 14, 28, 32, 46, 47 | Electrode stress below yield strength and yield point | Offline: Determination of yield point and yield strength; digital twin: Determination of maximum allowable web tension; analysis of expected web tension during production | Web tension within min./max. range; Design of stiffness of the rollers | ||
| 1, 4, 7, 8, 29 | Intact electrode (no particle formation) | Visual inspection | Suction of particles after application of the sheets | ||
| 1, 4, 29 | No relative movement between electrode and deflection rollers | Monitoring web tension by measuring deflection rollers | Suitable system design | ||
| Gripping and winding the electrode web | 42 | Full-surface contact of the electrode on the gripper element (no major geometrical defects) | Alignment of web edge by rotating frame | Web edge control and analysis of the resulting data (read-out) | |
| 20 | Absence of damage to the electrode and current collector (no abrasion of the coating, no damage, no wrinkling) | Visual inspection | Detection of web breaks analogous to coating and calendering; detection of damages via a camera system | ||
| 31, 33, 41, 45 | No relative movement between gripper and electrode (due to insufficient holding force) | Monitoring web tension with measuring deflection rollers | Suitable design of the vacuum gripper elements | ||
| 2, 6, 16, 18, 25 | Constant web tension in web direction (no plastic deformation of the grippers and the electrode web, no sagging, suitable speed of the gripper elements) | Sensor: Monitoring web tension via measuring rollers; Simulation: web tension at points where not possible in physical machine; Determination of deposition accuracy via analyzing web tension fluctuation, determination of the required machine speed | |||
| Cutting the electrode web to length | 16, 23 | Dimensional accuracy of the electrode (length of electrode, straightness of the cut edge, perpendicularity to coating edge) | Simulation: required position of the three gripper elements: Offline: measuring dimensional accuracy via 3D measuring system; | Detection via camera system | |
| 3, 5, 22 | Cut edge quality (no burrs, no fringing, no tearing) | After deposition: visual inspection; Periodical inspection and maintenance of blades and pneumatic cylinders | Analysis with REM possible | ||
| 3, 5 | Absence of particles (no flaking of the coating at the cutting edge or electrode surface) | After deposition: visual inspection; Periodical inspection and maintenance of blades and pneumatic cylinders | Suction of particles | Analysis with REM possible | |
| Depositing the electrode sheet | 26, 27, 32, 38, 39 | Deposition accuracy, dimensional accuracy, repeatability) | Offline: 3D measuring system; Experimental determination of the optimal gap distance, Simulation: Determination of the correct rotational speed | Detection via camera system | Other options: Tactile measuring machine; CT; |
| No damages: no wrinkles | Visual inspection | Camera-based inspection | |||
| 34, 43 | No collision of the preceding electrode sheet with the subsequent cutting unit and machine components | Simulation: determination of the correct working sequence; Experiment: Determination of the gap distance | |||
| Fixation of the deposited electrode sheet | 30, 40 | Full-surface contact of the electrode to the vacuum table | Offline: 3D measuring system | Camera-based inspection system: Detection of edge of the deposited sheet on separator and feedback to control of actuators of unwinder | Designing matching hole pattern for the vacuum table |
| Deposition accuracy | |||||
| 40 | No damages: no wrinkles | Offline: 3D measuring system |
| Sub-process | No. Failure types | Quality features of intermediate product | System design solution (Gen. 1) | System design solution (Gen. 2) | Comment |
|---|---|---|---|---|---|
| Web guidance of electrode web | 8, 13 | Constant position of web edge | Rotating frame with web edge sensor (stand-alone, not connected to PLC) | Web edge control has an analog output (not stand-alone, data read-out possible) | |
| 11, 12, 14 | Constant web tension of the electrode transverse to the movement direction of the web | Measuring rollers with mounting transverse to the web direction | |||
| 21, 35 | Correct alignment of the electrode web/web edge on the gripper element | Alignment of the web edge by rotating frame; Simulation of the necessary position of the gripper elements for a target length |
Open Research
Data Availability Statement
The data that support the findings of this study are available from the corresponding author upon reasonable request.


