Simplified Electrochemical Approaches for Quality Determination of the Wetting Process in Lithium-Ion Cell Production
Abstract
Electrolyte filling and wetting are safety-relevant and time- and cost-intensive processes in lithium-ion cell production, and are hence critical process steps. Currently, only limited measurement technologies are available that would be suitable for inline monitoring and quality assurance of these process sequences. Herein, two promising electrochemical approaches for monitoring electrolyte wetting are presented, which can be utilized in low-cost measurement devices. Starting from the introduction of a simplified impedance approach with a straightforward data evaluation, a direct current-based method is introduced that does not require impedance equipment, and can thus be performed with standard battery cyclers. First, the extended applicability of the simplified impedance measurement is demonstrated by examining the dependence of experimental impedance results on varying electrolyte volumes, also including insufficient amounts. Subsequently, the impedance approach is transferred into the direct current method. The latter mimics impedance signals by utilizing repetitive direct current charge and discharge pulses, which are used to determine the batteries’ internal resistance during the electrolyte wetting. Both introduced approaches yield comparable results and allow the inline monitoring of the electrolyte wetting with basic equipment and with no need for demanding data evaluation.
1 Introduction
The production of lithium-ion cells is a combination of several consecutive process steps, which are each connected to certain costs, process times, and inevitable quality standards. Next to material expenses, the overall costs for battery cells are determined by the single production stages. Here, electrolyte filling plays a crucial role and is often accompanied by high costs and long production times.[1] The electrolyte filling can be further divided into two successive steps. First, the dosing of the electrolyte into the battery cell, and second, the following wetting of the battery components. The latter step comprises the wetting of the porous electrodes and the separator and must be sufficient to prevent quality and safety issues within the later battery life.[2-4]
Before starting the initial charging of the freshly produced batteries within the formation procedure, the wetting step must be completed to ensure the establishment of a stable and homogeneous solid electrolyte interface (SEI).[1] As a consequence, long waiting times of up to 24 h are common here, which accordingly come along with high production costs.[1]
Different approaches to decrease these wetting times have been investigated and tested;[1, 5] and models to describe analytically the wetting process have been elaborated.[3, 6, 7] However, the practical monitoring of the wetting progress is highly beneficial as well because the successful distribution of the electrolyte inside the electrodes and the separator is a quality and safety-critical step. Besides ensuring sufficient wetting times, the precise electrolyte amount needs to be dosed. Deviations within the filling process (i.e., nonsufficient electrolyte amounts) can lead to a decreased performance of the produced battery cells.[8, 9]
Several experimental techniques have been tested to study the wetting behavior of the separator and the electrodes during and after electrolyte filling, including radiographic approaches,[5, 10, 11] ultrasound,[12] and infrared thermography.[2] However, most of these approaches cannot be used in line with the cell production. Inline monitoring would be, nevertheless, beneficial as it could help to guarantee quality standards or to determine the completed wetting of individual cells, which would lead to decreased wetting times and accordingly to cost savings.
A straightforward and cost-effective approach to observing the wetting of the separator and electrodes in single battery cells is provided by electrochemical impedance spectroscopy (EIS). Impedance spectroscopy has already proven to be an important method for the characterization and quality assurance in the field of lithium-ion batteries in various ways.[13] This method has also been applied frequently for the monitoring and investigation of wetting processes in battery cell production.[14-17] Here, different approaches can be distinguished regarding the interpretation of the experimental impedance data. In[16, 17] the high-frequency resistance (HFR) is determined to describe the wetting over time. This parameter has recently been used as one of the multiple input parameters in an artificial neural network to predict the cycle life of battery cells with varying electrolyte filling.[18] In,[14] impedance spectra were measured and the value at a measurement frequency of 1 Hz was used for the monitoring of the electrolyte wetting. Still, the different EIS-based methods have the measurement of the impedance at quite high frequencies exclusively in common. This is also to ensure that the measurement has no influence on the subsequent cell performance, and thus, noninvasive monitoring of the wetting is possible. This way, EIS is also suitable as a standard method for quality assurance in battery cell production and can be used as an inline method.
The use of impedance techniques, however, has inherent drawbacks. Potentiostats equipped with a frequency response analyzer (FRA) are needed, for instance. Since these devices are expensive, they have so far only limited use in battery production. In addition, parallel measurements on several test channels are often not possible due to the use of multiplexer technology, and the frequency range of more economic devices is limited to a smaller, comparatively low-frequency range. Especially for the determination of the HFR via interpolation, as shown in previous articles,[16, 18, 19] not only is a frequency response analyzer necessary. Also, a sufficiently high-measurement frequency is crucial to find an intersection of the measured data points with the axis representing the real impedance part. A determination via an equivalent circuit fit of the dataset would be possible as an alternative. However, this method is considerably more complex and demanding to automate.
A straightforward solution to circumvent the technical requirements of an impedance measurement is to adapt the measurement method to basic cyclers, which are already available in battery cell production due to the need for the formation of the manufactured battery cells. Here, the sinusoidal excitation signal of impedance spectroscopy can be mimicked by current pulses. However, sufficiently high frequencies to determine the HFR are impossible to achieve with these devices and this approach.
Impedance measurements at a frequency of 1 Hz indicated great potential for investigating electrolyte wetting.[14] In theory, the impedance value at 1 Hz also contains additional information compared to the HFR, which describes only the pure ohmic resistance of the measured battery cells. The charge-transfer transition in the active material as well as the migration and diffusion of lithium ions within the porous electrode composites are also electrolyte-dependent processes. Because of the higher time constants, these processes are excited only at lower frequencies.[20, 21] Even if the measurement at only one frequency does not allow separation of the different processes contributing to the measured impedance, these processes are taken into account in the obtained parameter. In contrast, the HFR contains only the ohmic resistance and the measurement time needed for a full spectrum can be considerably longer than for only one frequency. The choice of 1 Hz as measurement frequency is a compromise between additional information due to the excitation of further processes and sufficiently short measurement time. The latter increases with decreasing frequency and thereby reduces the temporal resolution of the monitoring of the wetting. Besides, this frequency lies within a timescale which can easily be reproduced by conventional battery cyclers.
Nevertheless, it has not yet been investigated whether comparable impedance results can be obtained by 1 Hz measurements for varying electrolyte volumes as with a full spectrum measurement and analyzing the HFR. Hence, this work first shows the applicability of the simplified impedance measurement (using only the 1 Hz signal) for identifying different electrolyte quantities within the filling and wetting process. For this purpose, the impedance behavior of pouch cells was monitored directly after the electrolyte filling. Different amounts of electrolyte (including insufficient quantities) have been used within the filling process and the influence of the electrolyte volume on the respective EIS outcome was studied. Subsequently, the impedance approach is transferred to a direct current (DC) pulse technique, which can be utilized with basic battery cyclers. Here, DC signals were designed that mimic the 1 Hz impedance signal and lead to comparable resistance values which can be used to monitor the electrolyte wetting over time or to identify insufficient electrolyte amounts.
2 Experimental Section
2.1 Materials
Single-layer pouch cells of a special design have been used for the electrochemical investigations. The Battery LabFactory Braunschweig (BLB) manufactured lithium-ion cells sealed only on three sides, leaving one side open for investigations on electrolyte filling later on.
The used electrode materials were obtained by the BLB. The double-sided coating of the cathodes on 20-μm-thick aluminum foil consisted of 93 wt% LiNi0.6Mn0.2Co0.2O2 (NMC 622, BASF), 2 wt% carbon black (C65, Imerys), and 1 wt% graphite (SFG6L, Imerys) as conductive additives, and 4 wt% polyvinylidene fluoride (PVDF, Solvay) as a binder. The porosity after calendering was 25%, the electrodes’ thickness 157 μm, and the mass loading 15.5 mg cm−2. This resulted in a capacity 2.4 of mAh cm−2. The anode consisted of 10 μm copper foil double-sided coated with a composite layer of 93 wt% graphite active material (SMG-A5, Hitachi Chemical), 2.7 wt% styrene–butadiene–rubber +1.3 wt% carboxymethylcellulose binder and 1 wt% conducting agent (C65, Imerys). The porosity of the electrode after calendering was 36%, the electrodes’ thickness was 127 μm, and the mass loading was 9 mg cm−2. This resulted in a capacity of 3 mAh cm−2.
The electrodes were then cut using an automatic laser with a wavelength of 1062 nm to dimensions of 45 × 65 mm2 for the cathodes and 50 × 70 mm2 for the anodes. For the cell preparation, a 23 μm- thick polyester monolayer separator of 78 × 60 mm2 with a ceramic coating (FS 3002-23, Freudenberg) was used. A 1M solution of LiPF6 in ethylene carbonate (EC) and ethyl methyl carbonate (EMC) (mass ratio EC:EMC 3:7) with 2 wt% vinylene carbonate (VC) as an additive was used as electrolyte for all experiments.
2.2 Methods
2.2.1 Experiments with Different Electrolyte Volumes
The measurement setup used for all experiments is shown in Figure 1. The pouch cells were placed between two layers of foam to apply a reproducible pressure to the battery cell, comparable to a vacuum-sealed cell. Inside a glovebox at room temperature with an argon atmosphere containing less than 0.1 ppm water and oxygen, the cells were connected to a VMP3 potentiostat (Biologic SAS), prior to the electrolyte filling process. About five different volumes of electrolyte (0.6, 0.7, 0.8, 1.0, and 1.2 mL) were each injected into a new cell. The injection was performed at the edge on the side where the arrester lugs were attached using a syringe and a cannula since preliminary investigations have shown a superior reproducibility of the results than an injection in the middle (cf. Figure 1).
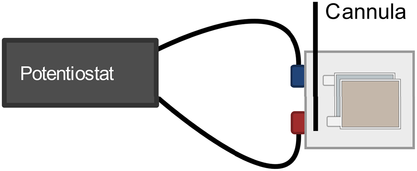
Within a few seconds after the electrolyte dosing, electrochemical impedance measurements were started. In our previous work,[14] it has been shown that the wetting process can be followed by measuring the modulus of the impedance of a single excitation frequency without losing relevant information, but shortening the measurement and data evaluation effort considerably. Thus, the impedance was measured in potentiostatic mode at a frequency of 1 Hz every 10 s. The frequency of 1 Hz was chosen according to,[14] as it is considered to cover the main impedance features (pure ohmic contributions and charge transfer processes) of the investigated cells. However, this value cannot be utilized in a generalized fashion for different cell sizes, cell formats, or cell chemistries. Therefore, for deviating battery cells, complete impedance spectra should first be examined to determine which measurement frequency fulfills these requirements.
For each electrolyte quantity investigated, five replicates were measured.
2.2.2 Pulsed Current Technique
For this experimental part, the same setup mentioned in Section 2.1.1 was used. In contrast to the sinusoidal alternating current (AC) signal of impedance spectroscopy, the excitation signal in this part of the experiment consisted of a series of alternating positive and negative direct current pulses with an amplitude of ±1 mA. The pulse length was 0.5 s followed by a 4.5-s-long period after each pulse, where the open-circuit voltage (OCV) was obtained. This way, a full cycle took 10 s in total and the temporal data point density of the impedance approach can be maintained, allowing the monitoring of the investigated wetting behavior over time. The shape of the excitation signal is shown in Figure 5 in Section 3.1. The parameters for the current pulses (amplitude, duration) were adapted to the AC voltage signals of the impedance method. Here, the discharge and charge pulse together (if the OCV phases are not taken into account) result in an absolute time of 1 s, which corresponds to the period of the 1 Hz impedance signal. The amplitude of the pulses was chosen to correspond in its magnitude to the current amplitude resulting from the impedance signals.
Again, an electrolyte volume of 1 mL was injected the same way as before and the measurement was started a few seconds afterward. The voltage was recorded with a high sampling rate of 0.001 s.
3 Results
3.1 Investigation of the Effects of Various Electrolyte Volumes Using a Simplified Impedance Approach
Figure 2a shows the evolution of the modulus of the impedance with time after electrolyte filling in dependence on the injected electrolyte volume. For the sake of clarity, not all investigated electrolyte quantities are shown here and for the electrolyte volume of 0.7 mL only the replicates leading to a stable low equilibrium value are represented—indicated by the label “low.” An overview of all curves can be found in Figure 4. As to be expected, a steep drop of the impedance is apparent directly after the electrolyte filling. Considering small deviations in the time between filling and the start of the measurement, no clear dependence between the initial impedance values and the electrolyte volume used can be seen. Here, the impedance is dominated by the electrolyte being distributed mainly within the separator[22] and wetting of the electrodes’ surfaces and superficial, larger pores resulting in a well primarily wetted area.[19, 23]
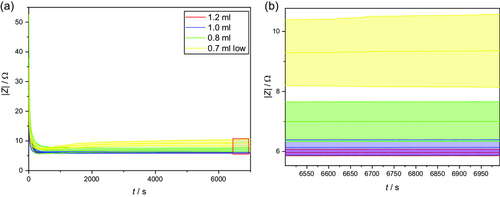
As the primary wetted area continues to expand and the wetting degree of the pores increases, the curve becomes much flatter, passes through a minimum that decreases with increasing electrolyte volume, and approaches a constant value after wetting is complete after a few minutes.[14] The slopes of the courses for different electrolyte volumes are similar and also the times in which the minimum is reached differ only slightly. It can, therefore, be assumed that the influence of the electrolyte volume on the wetting time is rather small.
With increasing electrolyte volume, the minimum of 6.86 Ω for 0.8 mL, over 6.09 Ω for 1.0 mL, is increasingly less pronounced, until the plateau is reached without a minimum for 1.2 mL. This progression can be explained by two competing mechanisms: on the one hand, the drop in impedance because of the increasing primary wetted area and, on the other hand, a decrease in the wetting quality of the already wetted area due to the further distribution of the electrolyte to previously unwetted areas. As no subsequent decrease of the impedance, even after some hours, is visible, the secondary wetting (the distribution of the electrolyte in the smaller pores of the electrode caused by capillary forces)[22] seems to occur simultaneously mainly with the primary wetting or plays a minor role regarding the overall impedance and cannot be differentiated with the used approach.
After reaching the stable equilibrium state, the impedance values of the different electrolyte volumes differ significantly, as shown in Figure 2b. This observation is consistent with the theory of incomplete wetting, according to which an equilibrium of electrolyte and gas-filled pores is reached over time.[6] It can be assumed that the equilibrium condition depends not only on the electrolyte and pore properties, but also on the amount of electrolyte available. Larger electrolyte volumes lead to smaller impedance values and a lower standard deviation. For a better comparison, the absolute values at the end of the measurement are displayed in Figure 3 and Table 1. For 0.7 mL, only the replicates leading to a stable low equilibrium value were included.
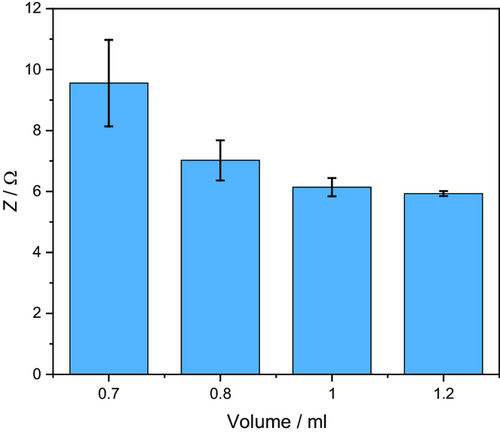
| 0.7 mL low | 0.8 mL | 1.0 mL | 1.2 mL | |
|---|---|---|---|---|
| |Z|/Ω | 9.56 | 7.02 | 6.14 | 5.93 |
| σ(|Z|)/Ω | 1.42 | 0.66 | 0.30 | 0.08 |
In Figure 3, a sharp decline can be seen for the impedance with increasing electrolyte amounts for the lower electrolyte volumes. This decrease is, however, quite small between the 1.0 and 1.2 mL volumes, indicating an approach to an optimum value where additional electrolyte no longer has a positive effect on the impedance. Accordingly, no improvement in the later battery performance is to be expected when adding more electrolytes. In addition, a significant reduction in standard deviations with increasing electrolyte volume can be observed, which proves a much more homogeneous wetting. For an industrial application of this measurement technique, a limit value of the impedance could be defined at which optimal wetting can be guaranteed, while higher values predict defective cells due to insufficient electrolyte amounts or deficient wetting, or cells with limited electrochemical performance, respectively. However, due to the asymptotic behavior of measured impedances, the measurement method does not allow the detection of overfilling.
Looking in particular at the low electrolyte volumes of 0.7 and 0.6 mL, a clearly deviating behavior can be seen, as shown in Figure 4. The progression of the curves initially resembles those in Figure 2 and can also be explained by the two competing mechanisms discussed earlier. However, due to the low electrolyte volume, the process of further electrolyte distribution and thereby lowering the initial wetting quality gets more dominant over time and the impedance values keep rising. As time progresses, less and less electrolyte is available for further distribution and the process becomes slower and slower, so that equilibrium is not reached within the time period under consideration and high impedance results.
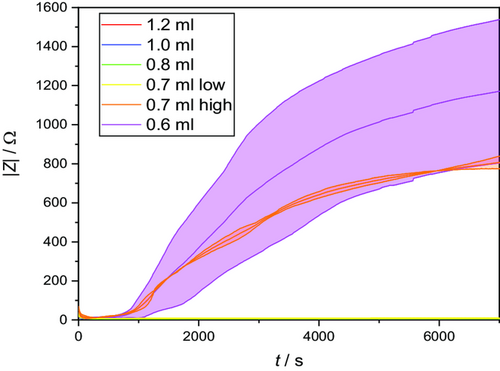
The lowest amount of electrolyte used (0.6 mL) results in a minimum value of 11.06 Ω, 3 min after filling followed by a continuous increase of the impedance to over 1400 Ω until the end of the measurement time, indicating nonfunctional cells because of insufficient wetting. The increasingly high scatter of the measured values is remarkable, as it shows that the comparatively small deviations of a semi-industrial battery production can have strong effects on the wetting properties represented by the huge differences in impedance values. This becomes even more obvious with the electrolyte volume of 0.7 mL. Two replicates behave similarly to 0.6 mL, with a lower final value of about 900 Ω (indicated as “0.7 mL high”). Three other replicates behave completely differently by passing through a minimum of 7.29 Ω after 380 s and then approaching an equilibrium value of only about 9.5 Ω within ≈30 min (cf. Figure 2a—0.7 mL low). The latter cells can be probably initially charged within the formation. For a subsequent usage, however, deteriorated electrochemical properties are to be expected.[19]
3.2 Pulsed Current Technique
The measurement of impedance spectra or single impedance values at selected frequencies requires the usage of frequency response analyzers, which are an integral part of impedance measurement devices. However, these components are expensive, and are hence rarely installed in conventional battery cyclers. Even if FRAs are used here, multiplexers are usually operated, so that several measurement channels share one device for recording impedance spectra. Parallel impedance measurements on all channels are not possible in this case. Thus, the use of the previously presented method (cf. Section 2.2.1) as a standardized method for quality assurance in battery cell production is generally prohibited for technical and economic reasons. To overcome these problems, therefore, a new method based on direct current pulses for the monitoring of the wetting process has been tested. The use of impedance spectroscopy is dispensed here, so that this method can be carried out with standard cyclers.
Instead of sinus signals, alternating direct pulses of a small amplitude are applied to the tested cell. By utilizing alternating charge and discharge pulses, a constant state of charge of the measured battery cells is ensured. From the resulting current–voltage behavior of the batteries, resistance values (similar to the previously used impedances) can be determined. Therefore, with this method, a temporal behavior of the wetting should be observable as well. The pulses are kept as short as possible (cf. Section 2.2.2) and repeated over a longer period. To determine the resistances, the current pulses are followed by short waiting times during which the system can relax briefly.
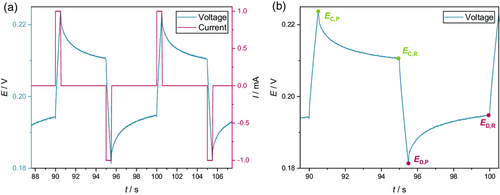
As the current pulses are repeated several times, the resistances estimated from these can be considered a function of time. The constant alternation between charge and discharge current ensures a constant state of charge of the cell under investigation. Furthermore, the pulse durations and intensities were selected to be low to exclude the premature formation of the cells. Thus, the investigated cells can be regarded as temporally stable and, as already shown for impedance spectroscopy, it is to be expected that a temporal change in the resistance depends on the wetting degree of the electrodes and the separator. This assumption is further supported by a closer look at the OCV curve of the investigated cells as a function of the total measurement time or the number of applied pulses, respectively. In Figure S1, Supporting Information, in the Supporting Information, the results indicate that the individual DC pulses have no negative effect on the OCV of the investigated cells. An increase in the OCV which would point to a premature cell formation is not apparent.
Figure 6a depicts the resistance values determined by the DC pulse method over time after electrolyte filling (red line). Furthermore, the corresponding results of the previously presented EIS measurements are shown here for comparison. For both test methods, an electrolyte filling with 1 mL electrolyte was performed, and the measurements were started immediately afterward (cf. Section 2.2). The data show the averaged results of five replicates, respectively. For both methods, a qualitatively equal trend can be seen for the resistance values over time. Moreover, both data sets show reasonable standard deviations (red and blue shade).
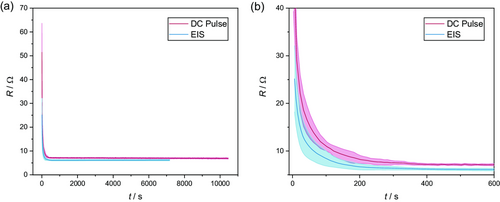
Directly after the beginning of the measurement, the resistance decreases sharply. This course is degressive so that after a short time (≈400 s) a plateau of low resistance values is reached. The absolute resistances estimated with both methods in the plateau differ by only about 1 Ω (≈15%). Figure 6b shows the degressive behavior within the first time intervals in detail. From this representation, it is evident that both curves (estimated using EIS and the DC pulse method) reach the plateau at almost the same time after electrolyte filling.
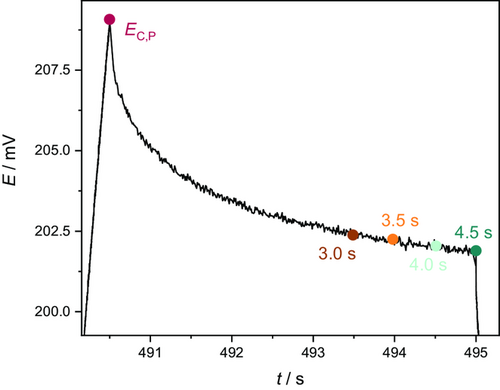
These findings are in good agreement with the results presented in ref. 25 which show that pulsed DC techniques and EIS measurements show similar results for general investigations of lithium-ion batteries as long as both methods are conducted within the same timescales. The measurements presented in this work also fulfill this prerequisite—a frequency of 1 Hz was chosen for the impedance measurements and the charge and discharge pulses have a combined duration of 1 s which resembles 1 Hz in the frequency domain. However, the absolute values of both methods differ slightly, showing lower resistances for the EIS method. Here, it must be considered that the voltage relaxation after the current pulses is not completed (still minor changes in the voltage at the end of the relaxation steps—cf. Figure 5). The short relaxation times were chosen in favor of a higher resolution of the wetting effects in time. Hence, this tradeoff could be a reason for the slight deviation between the resistance values of the EIS measurements and those of the pulse method.
An OCV time of 4.5 s was considered being sufficiently short. However, within this time period, the investigated system cannot fully relax, as can be seen in Figure 7. Here, the relaxation of the cell voltage after a charge pulse is shown. After reaching a maximum of around 209 mV, the voltage declines exponentially for 4.5 s. This course is followed by a sharp voltage drop due to the onset of the discharge pulse. However, even at the end of the OCV step, the cell voltage is not fully stable over time. To investigate how the necessary shortening of the OCV step affects the results of the pulse technique, the relaxation time of 4.5 s was artificially reduced to values of 4.0, 3.5, and 3.0 s. Accordingly, the respective measurement points for the determination of the resistances were chosen as shown in Figure 7. The cell voltage at 4.5, 4.0, 3.5, and 3.0 s relaxation time was determined for the charge and the discharge pulses, respectively. The resulting cell voltages were then used to compute the time-dependent cell resistance using Equation (2)–(6). Here, the measured data of only one of the investigated cells was included in the examination.
The resulting wetting curves are shown in Figure 8. For all utilized relaxation times, a qualitatively consistent trend can be found. With increasing wetting time, the resulting resistances are exponentially decreasing (cf. Figure 8a). At around 400 s, stable resistance values result in all four curves in a plateau (cf. Figure 8b). While the duration of the relaxation period does not show an apparent influence on the qualitative course of the resistance values with the wetting time, slight quantitative deviations occur in the region of the plateaus. Thereby, the average absolute resistances slightly increase with higher relaxation times from 6.65 Ω determined at 3.0 s relaxation time toward 7.22 for a relaxation time of 4.5 s. These deviations are only marginal (≈8%) and, accordingly, the influence of different relaxation times in the investigated range can be considered almost negligible. However, it must be noted that these deviations would increase progressively with even further decreasing relaxation times according to the OCV curve in Figure 7. Accordingly, the relaxation times for the determination of the resistances should be chosen as large as necessary and as small as possible for the highest possible temporal resolution.
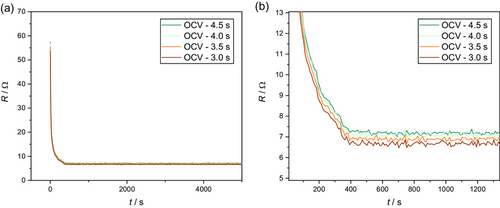
The influence of the chosen relaxation times on the resulting resistance values, however, is rather small, as can be seen in Figure S3, Supporting Information, in the supporting information. Here, different relaxation times after the charge and discharge pulses ranging from 3.0 to 4.5 s were used. For all utilized relaxation durations, qualitatively similar wetting curves can be generated. Furthermore, the quantitative deviation in the plateaus (completed wetting) is only about 8%.
Besides the OCV duration, the relaxation steps itself after each pulse could be a reason for the deviations in the experimental results. The relaxation steps, which are needed for the computation of resistances, let the signals of the DC approach clearly deviate from the shape of the AC impedance signals. However, potential difficulties due to the smaller deviations between the absolute resistance values determined by both methods could be resolved, for example, by suitable calibration. In a nutshell, the pulse method introduced here provides qualitatively as well as quantitatively comparable results to the EIS measurements. Therefore, the electrochemical monitoring of the electrolyte wetting by means of repeated DC pulses seems to be feasible. This way, the wetting process of battery cells after electrolyte filling can be observed with low effort and expense and without the need for special measurement hardware. Thus, the pulse method can also be used as a standard method for quality assurance or for reducing waiting times during the wetting process in battery cell production.
4 Conclusion and Outlook
In this work, the suitability of a simplified method of EIS for monitoring the wetting process and assessing the wetting quality of lithium-ion batteries has been demonstrated. The applicability of this method has been proven by investigating the effects of different amounts of electrolyte on the impedance of single-layer pouch cells. Significant differences in the resulting impedance values after completed wetting with different electrolyte volumes were found with high reproducibility and comparatively low effort. For increasing electrolyte volumes, the impedance seems to approach an optimal minimum value, while electrolyte quantities that are too low lead to impedance values that are several hundred times higher. In addition, it was shown that the amount of electrolyte used has comparatively little influence on the wetting time, but leads to different impedances after the completion of wetting.
Based on the simplified impedance approach, a measurement technique utilizing low-amplitude DC pulses has furthermore been developed. This new method mimics impedance measurement, but can be used on conventional potentiostats and battery cyclers widely used in industrial applications without any adaptations. Using the example of the electrolyte quantity of 1 mL, the applicability of this pulse method has been shown as it achieves very similar results to the impedance measurement, both qualitatively and quantitatively. Further improvements and refinements of the quantitative results generated by the pulse technique could be performed by calibration. The small deviations between the experimental results of the impedance measurement and the newly introduced pulse technique will be further studied in future work. Here, the influence of the implemented relaxation times, needed within the pulse technique, on the resulting resistances should be tested more in detail.
Further studies should also investigate the relationship between the impedance values after completion of wetting with different electrolyte volumes and the electrochemical performance (e.g., cyclization) of the respective batteries using vacuum-welded and degassed cells. In particular, possible differences from large-format multilayer cells should be investigated. Additionally, these measurements should exclude any negative influence of the presented measurement methods on the electrochemical properties of the cells. For further verification, the findings should be confirmed by additional measurement methods, such as neutron radiography. Also, different cell types as prismatic or cylindrical cells should be tested using the introduced approaches.
Acknowledgements
The authors gratefully thank the Institute of Machine Tools and Production Technology, Technische Universität Braunschweig, for manufacturing the cells used. The authors thank Tobias Bergmann for helping with automated data preparation and Jana Mrowetz for designing Figure 1. The authors gratefully acknowledge the Federal Ministry for Economic Affairs and Energy of Germany for the funding of the project DaLion 4.0 (grant number 03ETE017A).
Open Access funding enabled and organized by Projekt DEAL.
Conflict of Interest
The authors declare no conflict of interest.
Open Research
Data Availability Statement
The data that support the findings of this study are available from the corresponding author upon reasonable request.


