Simulation of the Calendering Process of NMC-622 Cathodes for Lithium-Ion Batteries
Abstract
Calendering is the final step in electrode production during the manufacturing of lithium-ion batteries. It is a crucial process that significantly influences the electrodes’ mechanical and electrochemical properties and is decisive in defining their volumetric energy density and performance. Herein, a discrete element method modeling approach is proposed to predict the process parameters of the calendering process. In particular, the roll gap width is required for a given target porosity. For this purpose, a particle bed of 9 mm in length is compacted using a roll section enabling a deeper look into the compaction behavior of the microstructure. Six NMC-622 electrodes with different thicknesses are produced and compacted to different porosities. In the experimental investigation, the roll gap width is set and measured allowing a simulative replica of the process. With the process simulation, the force propagation within the electrode can be observed on a particle level. Furthermore, nanoindentation measurements with NMC-622 cathodes provide information on the densification behavior of cathodes and support the parameterization of the particle bed. The particle-based simulation of the compaction process is experimentally validated using nanoindentation measurements on NMC-622 cathodes.
1 Introduction
High-performance and low-cost batteries have become a key feature in various applications, critical for reaching climate protection goals. The battery production requires significant improvements in lithium-ion batteries to achieve energy density and cost targets.[1] The battery production process chain comprises many consecutive process steps, significantly influenced by the material properties and electrode compositions. Therefore, it is crucial to deeply understand how the production processes affect the battery cell and determine what special requirements the battery production processes must fulfill.[2]
The calendering process is one of the last steps in electrode production and significantly influences the electrodes’ electrical, mechanical, and electrochemical properties.[3] During calendering, a composite coating on a thin (6–20 μm) metallic foil is compacted between two (heated) rolls at speeds up to 100 m min−1.[2]
Depending on the battery's application and composition, the electrodes are calendered from an initial porosity of 45–60% to 18–35%.[2, 4-6] Meyer et al.[7] investigated the correlation between electrode density and applied line load for the compaction of lithium–nickel–mangan–cobalt–oxide (NMC) and graphite electrodes. Among other things, the compaction behavior of cathodes and anodes differs due to the different crystalline densities of the particles. For example, NMC-622 particles (BASF, 4.74 g cm−3) have twice the initial density of graphite particles (SGL Carbon, 2.26 g cm−3). Therefore, cathodes have greater resistance to compaction because more force is required for the densification process in which particle rearrangements occur due to friction between particles within the electrodes. Furthermore, bulk materials such as binders and conductive additives influence the calendering process.[7]
In situ nanocomputer tomography (nano-CT) recordings illustrate the evolution of the densification process for uniaxially compressed electrodes.[8] The investigation of the uniaxial compaction showed that the electrode's particle morphology and local heterogeneity influence the densification process: the narrower the particle size distribution, the more homogeneous the compression. At the same time, microstructural heterogeneity in the electrode structure leads to structural rearrangement of the particles.[9]
Duquesnoy et al.[10] presented data-driven evaluation of the electrode calendering process through a combination of experimental results, generated electrode mesostructures, and machine learning.[10] A lower mass fraction of the NMC active material (AM) results in higher electrode densities[10, 11] as binders and conductive additives are interstitially located between the bigger AM particles.[7] In general, the relationship between electrode density and the required line load can be described as an exponential function.[7] Friction, mainly affected by the particle size distribution and particle surface area, decisively influences the necessary line load for the compaction of electrodes with spherical particles (mainly cathode). The application of various active materials in battery production leads to varying interparticulate friction during rearrangement in the early compaction state.[12]
Günther et al.[13] described three compaction phases starting from the initial state of the electrode: particle rearrangement to the maximum packing density, plastic deformation of the particles, and finally particle fragmentation.[13] Diener et al.[14] investigated experimentally the deformation behavior of NMC-622 cathodes through direct-gap measurement. The results show that cathodes with higher mass loadings have a lower springback due to more space for particle rearrangement. Cathodes with higher binder content lead to higher plastic deformation resulting in a lower springback.[14]
Experiments with different roll diameters and roll temperatures show that both parameters influence the adhesion strength of electrodes.[15, 16] An increase in roll temperature from 23 to 40 °C decreases the required line load. A further rise in temperature of the rolls from 40 to 90 °C results in a decreased line load reduction for the same target density.[16]
A shift toward smaller pore sizes and specific volumes can be observed comparing compressed versus uncompressed electrodes using mercury porosimetry measurements and scanning electron microscope (SEM) images.[17] The shift explains the increasing interparticular resistance to compaction with increasing densification.[7]Moderate compaction strongly influences pores belonging to the larger size range of pores.[18] The resulting pore structure of the electrode determines the electrochemical performance of battery cells.[12] Cycle stability is increased by compaction of NMC-111 cathodes[19] and moderate compaction of graphite anodes.[20] Due to calendering, the enhanced contact between the carbon black binder matrix and the active material particles increases the electrical conductivity of cathodes.[18]
Sangrós et al.[21] investigated the thermal behavior of electrodes using discrete element method (DEM) by studying the influence of porosity, particle size, and electrode thickness of spherical graphite particles. Results show that the electrodes heat up more quickly with lower porosity, larger particles, and thinner coating thicknesses.[21] The graphite electrodes’ microstructural and mechanical properties are reproduced in the simulation by a developed bond-contact model based on the Hertz contact model. Comparing the force–displacement curve of experimental and modeled nanoindentation shows promising results.[22] Sangrós et al.[23] stated that the calendering roll could be represented in a DEM simulation as a horizontal plate because the biggest force between the electrode and the roll surface for the investigated electrode thicknesses, the deployed roll diameter, and the applied compaction speed is in the vertical direction. In a follow-up publication, different electrode densities were conducted regarding the influence of density on the mechanical, electrical, and ionic properties of NMC electrodes.[24] Ngandjong et al.[25] investigated the structural and electrochemical effects of uniaxial compaction to compare the particle rearrangement, the pore size distribution, and the electrodes’ tortuosity in both, experiment and DEM simulation. In addition, the authors investigated the drying process of the slurry using a coarse-grained molecular dynamic approach.[25]
As indicated by the literature, previous studies focus on the mechanical and structural properties of lithium-ion electrodes and their impact on the performance of the battery during operation. Several researchers have investigated the calendering process thoroughly. In the existing publications, uniaxial compaction is assumed instead of the calendering process, and in most research, the particle size distribution is simplified using selected representative particle sizes. The present article merges the preliminary work by Schreiner et al.[26] in the concept of modeling the calendering process and the precalibration of the electrode model[26] with comprehensive sensitivity analysis to identify the relevant model parameters.[27] To the best of our knowledge, this simulation predicts for the first time the particle-based behavior and the resulting electrode thickness for the calendering process. This allows an in-depth understanding of the compaction process and reduces the time to adjust the calendering parameters. In the following section, the findings and results are discussed and summarized. Subsequently, the experimental and computational investigations are described in detail.
2 Results and Discussion
2.1 Overview/Procedure
Figure 1 provides an overview of the procedure for the simulation-based prediction of the calendering process. The procedure is a kind of a V-model, with the experimental investigations (left part) and the simulation (right part). The level of detail increases from the top (electrode coating/virtual electrode microstructure) to the bottom with the validation of the process model and the prediction of the parameter roll gap width. The generation of the virtual electrode structure has already been described by Schreiner et al.[26] and includes the two contact models, Bonding and Edinburgh Elasto-Plastic Adhesion (EEPA), to represent the interactions within the DEM model. In a follow-up publication, Schreiner et al.[27] identified nine relevant model parameters on the compaction behavior through a sensitivity study. Furthermore, an iterative approach to parameterize and subsequently optimize the mechanical behavior of the electrode coating based on nanoindentation measurements is presented.[27]
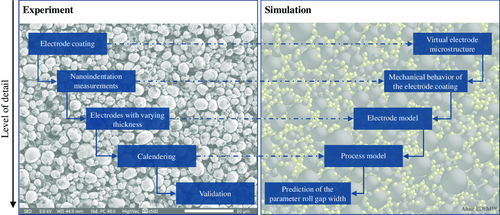
In the present article, further nanoindentation measurements were performed at different coating thicknesses to verify the proposed approach and extend the electrode model to different electrode thicknesses and compaction rates. Each indentation depth was indented at least 100 times to obtain statistically relevant results. The electrode properties determined in the electrode model are transferred to the process model by extending the particle bed length to 9 mm. For the purpose and comparability, the roll segment in the simulation has a diameter of 400 mm, the same as in the used physical calendering machine EA 102 (Coatema, Germany). In the validation, the predicted electrode thickness is compared with experimental results of the physical calender (EA 102) for different mass loadings and coating thicknesses of NMC-622 cathodes produced on the pilot-scale production line[28] at the Institute for Machine Tools and Industrial Management (iwb) of the Technical University of Munich (TUM).
2.2 Electrode Model
In this article, as suggested by Sangrós et al.,[22] a flat cylinder head with a diameter of 100 μm is used for nanoindentation. Figure 2 shows the indentation location of a nanoindentation measurement.
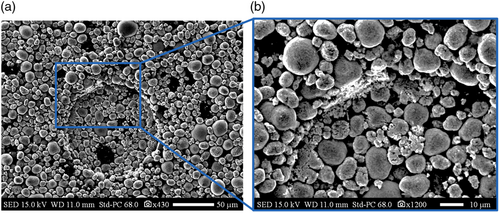
Figure 2a displays that the indentation head is sufficiently large to capture multiple particles and thus press the coating structure over a large area. The black areas in Figure 2 are probably due to insufficiently deagglomerated carbon black but are negligible for the subsequent studies of the compaction behavior. Concurrently, Figure 2b shows that the particles are plastically deformed and fractured by the rim of the indentation cylinder. Based on the experimental results, the influence of the coating thickness on the simulation results is analyzed.
For all clusters (electrode thicknesses of 64, 86, 87, 109, 117, and 130 μm), the uniaxial compression is simulated with the initial parameters (Table 6–9) proposed by Schreiner et al.[27] Figure 3 compares the resulting compression pressure and indentation depth curve of the experiment and the simulation with the initial values of the vertical compaction.
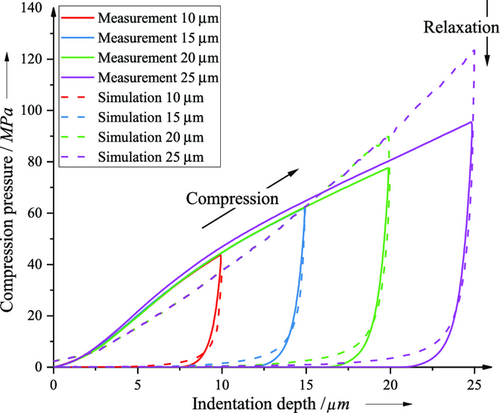
The dashed line represents the simulation result and the solid line the result of the experiment. The results show that simulation is close to the measured values for indentation depths up to 15 μm. The best agreement in the maximum required that compression pressure exist for an indentation depth of 15 μm. For indentation depths <15 μm, the required compression pressure is underestimated. For compaction depths >20 μm, the required compression pressure is overestimated. The slight deviation between simulation and experimental results, especially for higher compression depths, is caused by the change of the curve gradient of the measured data. The experimental results show an initially progressively increasing curve, which has the maximum slope at a compaction of about 5 μm and then takes a degressive slope course. This change in the slope of the curve cannot be replicated with the used EEPA and bonding model. The springback of the electrode with decreasing compression pressure is close for all indentation depths between experiment and simulation. Thus, the electrode behavior between experiment and simulation is accurately represented by the model. For indentation depths >20 μm, the model overestimates the necessary compression force of the nanoindenter.
When comparing the nanoindentation measurements across all investigated coating thicknesses, the required compression force decreases with increasing layer thickness, which is explained by the fact that the compaction rate decreases with increasing layer thickness for the investigated indentation depths. A difference can be seen in the shape of the curve at different coating thicknesses. By quantifying the accuracy of the simulation, the difference between the measurement and the simulation results is calculated for each saved simulation time step. Considering the time step and the compaction speed, the error integral takes the unit MPa μm. Minimizing this error integral through an optimization algorithm (Global Response Search Method Algorithm) increases the accuracy of the simulation by fitting the nine relevant model parameters to the measured data.
Afterward, the optimization algorithm adjusts the proposed nine relevant model parameters (static friction µs for Binder–NMC and NMC–NMC, plasticity ratio λp for NMC–NMC, for Foil–NMC, and Roll/Plate–NMC, as well as the bonding parameters normal and tangential stiffness kn and kt, critical normal stress σmax, and critical shear stress τmax for NMC–NMC) from Schreiner et al.[27] This procedure verifies the applicability of the previous parameterization[27] and the suitability of the optimization to different particle bed thicknesses and compression depths. In principle, the improvement of the simulation results increases with a higher number of iteration steps. In this article, the optimization for each particle bed comprises 50 simulation runs, which turns out to be a good compromise between simulation time and result accuracy. Table 1 lists the results of the initial calculation and the improvement by the optimization algorithm for all compaction depths and coating thicknesses. The optimized parameters can be found in Supporting Information (Table SA1–SA6).
| Electrode thickness [μm] | Error integral [MPa μm] | Indentation depth [μm] | |||
|---|---|---|---|---|---|
| 10 | 15 | 20 | 25 | ||
| 64 | E 0 a) | 78.38 | 310.53 | 887.12 | 2459.54 |
| E opt b) | 33.65 | 107.69 | 518.53 | 1350.38 | |
| 86 | E 0 a) | 63.00 | 183.85 | 401.08 | 905.47 |
| E opt b) | 39.56 | 76.34 | 198.50 | 528.25 | |
| 97 | E 0 a) | 52.49 | 76.42 | 234.39 | 491.77 |
| E opt b) | 47.75 | 76.11 | 217.62 | 374.57 | |
| 109 | E 0 a) | 52.99 | 78.30 | 166.44 | 396.77 |
| E opt b) | 51.87 | 78.30 | 153.97 | 261.64 | |
| 117 | E 0 a) | 43.56 | 122.49 | 328.64 | 662.22 |
| E opt b) | 39.18 | 70.67 | 152.73 | 341.98 | |
| 130 | E 0 a) | 62.00 | 96.96 | 151.24 | 280.19 |
| E opt b) | 57.67 | 93.71 | 151.24 | 280.19 | |
- a) E0: error integral with initial parameters;
- b) Eopt: error integral with optimized parameters.
The error integral values in Table 1 show that the simulation error for the initial parameterization and the deviations of the optimized simulations increase with increasing compression depth. These results confirm the observation from Figure 3 for the 130 μm electrode. With increasing indentation depth, the accuracy of the start parameterization decreases, resulting in rising error values with increasing compression depth. If the initial integral error value and the integral error value of the optimized parameters are the same, the initial parameterization already provides the lowest error value. This was the case for the indentation depths 20 and 25 μm of the thickest particle bed (130 μm electrode thickness) as well as for an indentation depth of 15 μm for an electrode thickness of 109 μm. The results show that the initial parameters already provide good agreement between experiment and simulation. However, almost all indentation depths for the optimized simulation have been improved.
The optimization was performed for each coating thickness, and therefore, depending on the coating thickness, the values of the nine relevant parameters vary slightly. In general, the larger the coating thickness, the lower the error value of the initial parameterization. In summary, the results show that the initial values for all coating thicknesses already provide a sufficient approximation. Therefore, in the process simulation, the initial parameters from Table 6–9 (Computational Section) were used as global parameter sets, with a few parameters (see Table 7 and 8) slightly adjusted to counteract the tangential forces introduced by the roll (see the following section) and the elastoplastic behavior.
2.3 Process Model
Analogous to the electrode model, the process simulation consists of a compaction geometry and the electrode coating particle bed. While the parameters in the electrode model are set based on uniaxial compression by a plate, the compaction geometry in the process simulation corresponds to the dimensions of the real calender roll at the iwb. Therefore, the length of the particle bed had to be increased from 250 μm to 9 mm to have a representative volume element for the compaction process (see Computational Section).
Due to the tangential force introduced into the coating by the rotational motion of the roll, the force flow of the process simulation differs from the uniaxial simulation. Analogous to the electrode model of uniaxial compression, compression begins with forces being transferred from the compression geometry to the larger NMC-622 particles. Figure 4 shows the particle bed in the three phases of roll engagement: 1) the particle bed before roll engagement; 2) the particle bed at the start of roll engagement; and 3) the particle bed at complete engagement length with the hidden roll. As Figure 4a shows, the NMC-622 particles have almost no compression forces before the roll engagement.
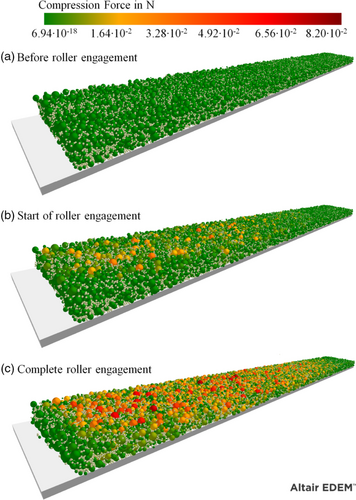
In the beginning of roll engagement, individual NMC–622 particles are loaded and transmit contact forces to other NMC–622 particles in a network-like manner, as already experimentally shown in literature for uniaxial compression.[9, 29] In contrast to uniaxial compression, further compaction through the roll section increases the force per particle geometry contact and the compaction area of the roll, as shown in Figure 4b. Accordingly, the force on the compression geometry increases due to larger contact forces and the increasing area of compaction. Figure 4c shows the particle bed under complete roll engagement. As there is hardly any reddish coloring (compression force) in the beginning and end of the particle bed, the particle bed length of 9 mm is sufficient to investigate the compaction behavior through a 400 mm roller segment. In addition, the coloring of the particles allows the course of the compression force during the rolling process to be observed. Therefore, the process simulation allows a deeper look into the compaction process itself.
Figure 5 illustrates the simulative particle forces after, in, and before the smallest roll gap width. Thereby 175 μm of the 250 μm simulated electrode width was clipped off in the figure to visualize the particle forces within the electrode.
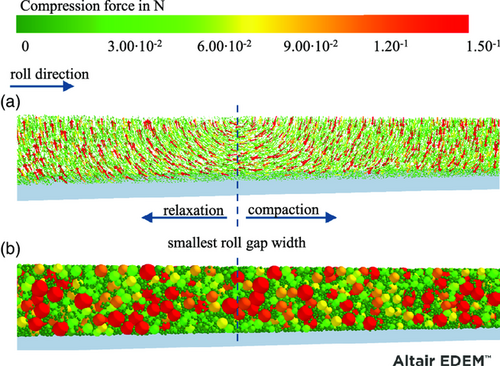
Figure 5a shows the simulative compression forces during roll engagement. The arrow sizes represent the particle diameter, and the color represents the compressive force. Through the process model, the stress–strain within the electrode can be observed in the granularity of the particles. The discrete approach enables the determination of the forces of each particle. In addition, the rotational energy introduced into the particle bed by the calendering process can be monitored, and the force direction within the electrode can be visualized at particle level. To the best of our knowledge, this is the first time in literature visualizing the occurring compression forces during the calendering process. After passing the narrowest roll gap width, the particles undergo springback, and relaxation occurs with particle forces against the compaction direction. As a result, an elastic springback of the coating is observed (relaxation area), and the direction of the particle forces reverses. The elastic springback is defined as the ratio between the narrowest roll gap width, which results in the smallest electrode thickness, and the resulting electrode thickness after calendering. The elastic springback of the compressed material occurs mainly due to the redeformation of the elastically deformed particles and by the expansion of the compressed air in the closed pores.[30]
Up to the smallest roll gap width, the particle bed is compressed and possesses particle forces in the compaction direction (compaction area). During compaction, the particles are pressed by the calender roll in the direction of the substrate foil. In the smallest roll gap width, the particles have the highest tangential forces because the compressive stress within the coating increases until this point and relaxes after the smallest roll gap width, resulting in a change of force direction. After passing through the smallest roll gap width, the particles no longer experience a compression force through the roll and, due to relaxation, have forces against the compaction direction. This behavior results in the vortex structure of the particle forces, marked with smallest roll gap width. By considering the stress–strain states in the different phases of compaction, it might be possible to provide a stress–strain-induced approach to explain the occurring electrode defects introduced by Günther et al.[13]
Figure 5b shows the same position of the particle bed at the same time step with the representation of the particle forces by coloring the particles. The color represents the compression force of the respective particle. The forces applied by the roll are mainly transmitted in a network-like structure in between NMC-622 particles. In contrast to NMC-622 particles, the small carbon black particles experience smaller compression forces.
Figure 6 compares the results obtained from the process simulation concerning the electrode thicknesses at the adjusted roll gap width with the electrode thicknesses from the experiment for the same roll gap width. For the experimental results, the mean and standard deviation are presented for both the electrode thickness after calendering and the roll gap width. The individual colors in the graph reflect the initial thicknesses of the electrodes in the experiment (hExperiment) and the simulation (hSimulation). The unfilled shapes represent the values of the electrode thickness and the roll gap width in the simulation. The filled shapes represent the values of electrode thickness and roll gap width in the experiment.
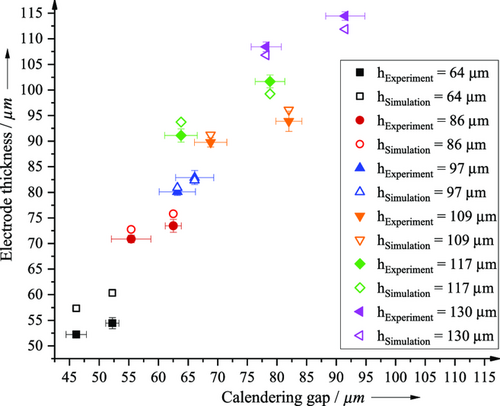
As shown in Figure 6, the deviation of the resulting electrode thickness and the roll gap width for simulation and experiment is small for the investigated electrode thicknesses (see Table 2). Thus, the introduced process simulation reproduces the resulting electrode thickness at the selected roll gap width to achieve the desired target electrode thickness or target density almost precisely enough to achieve the required thickness tolerance of ±2 μm[2] during calendering. Only the lowest electrode thickness of 64 μm (black) results in a 6 μm larger electrode thickness after calendering at low compaction. Higher values in the simulation compared with the experiment can be attributed either to an underestimated plasticity ratio in the simulation or a slightly thicker initial (uncompressed) electrode.
| Electrode thickness [μm] | Roll gap width [μm] | Initial porosity [%] | |||||
|---|---|---|---|---|---|---|---|
| Sim.a) before | Exp.b) before | Sim.a) after | Exp.b) after | Sim.a) | Exp.b) | Sim.a) | Exp.b) |
| 64 | 61.44 ± 3.69 | 60.32 | 54.44 ± 1.10 | 52.23 | 52.23 ± 1.10 | 43 | 42.71 |
| 64 | 65.78 ± 1.93 | 57.32 | 52.23 ± 0.63 | 46.14 | 46.14 ± 1.73 | 43 | 43.68 |
| 86 | 84.89 ± 1.73 | 75.78 | 73.44 ± 1.26 | 62.51 | 62.51 ± 1.34 | 43 | 43.89 |
| 86 | 86.11 ± 1.10 | 72.73 | 70.89 ± 0.74 | 55.40 | 55.40 ± 3.33 | 43 | 43.93 |
| 97 | 94.67 ± 1.70 | 82.36 | 82.89 ± 1.37 | 66.11 | 66.11 ± 3.21 | 43 | 42.79 |
| 97 | 98.56 ± 1.71 | 80.89 | 80.11 ± 0.74 | 63.19 | 63.19 ± 3.07 | 43 | 43.31 |
| 109 | 108.89 ± 2.08 | 96.09 | 93.83 ± 1.97 | 82.00 | 82.00 ± 2.18 | 43 | 42.17 |
| 109 | 109.00 ± 2.67 | 91.25 | 89.78 ± 0.92 | 68.81 | 68.81 ± 2.74 | 43 | 42.89 |
| 117 | 118.11 ± 2.33 | 99.25 | 101.67 ± 1.25 | 78.81 | 78.81 ± 2.50 | 43 | 43.11 |
| 117 | 113.11 ± 2.38 | 93.75 | 91.11 ± 1.29 | 63.81 | 63.81 ± 2.76 | 43 | 43.60 |
| 130 | 130.00 ± 2.00 | 111.87 | 114.44 ± 0.83 | 91.51 | 91.51 ± 3.29 | 43 | 42.14 |
| 130 | 130.00 ± 2.00 | 106.8 | 108.44 ± 0.96 | 78.18 | 78.18 ± 2.55 | 43 | 42.14 |
- a) Sim.: Simulation;
- b) Exp.: Experiment.
Table 2 summarizes the measured and simulated electrode thicknesses before and after calendering, the roll gap width, and the springback of the electrodes. For the experimental electrode thickness before and after calendering and the roll gap width, the mean value and the standard deviation are given.
The mean value of the measured initial electrode thickness before calendering and the mean value of the roll gap width were used as the roll gap width and initial electrode thickness for the simulation (see Experimental Section). The electrode thickness in the experiment is determined by 9 measuring points over the electrode length of ≈300 mm, as presented in the Experimental Section. The resulting electrode thickness of the simulation was evaluated with python according to the methodology shown in Figure 7. The springback of the electrodes in the experiment is between ≈4% and ≈30%. The springback of the electrodes in the simulation is between ≈8% and ≈32%. Thus, the percentage values of the springback are in good agreement with the values of the springback for NMC-622 cathodes of 4–37% in literature for comparable compaction rates.[14]
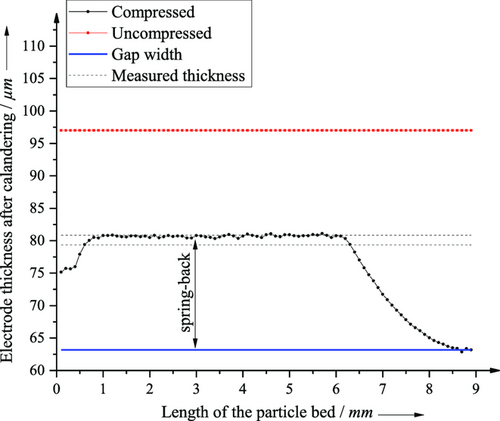
In general, the mean thickness deviation of the electrodes after calendering is ±2.88 μm comparing the electrode thickness of the simulation and the experiment. The porosity of the particle bed of the simulation before calendering was set to 43%, whereas the porosity of the electrode coated in the laboratory ranged from 42.17% to 43.93%. The evaluation of the electrode thickness after calendering is done as outlined using python (see Computational Section).
The evaluation of the electrode length from 1–6 mm is possible for all investigated electrode thicknesses and densities. In the first millimeter of the virtual electrode bed, 1 mm electrode length, periodic boundary conditions in the simulation affect the electrode thickness; consequently, this area is not suitable for determining the electrode thickness. Above 6 mm electrode length, the elastic re-deformation of the particle bed is not yet complete. This is particularly visible in the electrode thicknesses shown between 6 and 9 mm, where the roll is still in roll engagement. Close to 9 mm, the electrode thickness corresponds to the set roll gap width (blue line) since this is the narrowest roll gap width. The area between the dotted black lines displays the resulting thickness of the compacted electrode from the experiment. The red dashed line indicates the electrode thickness before compaction (uncompressed electrode).
3 Conclusion
In this work, the electrode model is converted into a process model. For this purpose, the nine sensitive model parameters were optimized using the Global Response Search Method Algorithm. The optimization results of the electrode model were investigated for coating thicknesses ranging from 49 to 115 μm concerning the compaction behavior at four indentation depths (10, 15, 20, and 25 μm) and compared with the experimentally generated force–displacement curves of nanoindentation measurements. The results show that the initial parameter values of the electrode model represent the compaction behavior sufficiently accurately and can be transferred to the process model.
The process model contains a roll segment with the diameter of the iwb calender roll (400 mm) and a coating particle bed of 9 mm length. For the experimental validation of the process model, the existing calender was extended by a real gap measurement using capacitive sensors. The prediction of the roll gap width in the process model is experimentally validated for different electrode thicknesses and densities. The mean thickness deviation of the resulting electrode thickness and equal roll gap width is within a mean deviation of ±2.88 μm for the investigated electrode thicknesses of 49–115 μm in both simulation and experiment. Excluding the smallest electrode thickness of 64 μm in the evaluation, the mean deviation of the electrode thickness is ±1.97 μm. Thus, presented the process simulation reproduces the resulting electrode thickness at the selected roll gap width for achieving the desired target electrode thickness or target density accurately enough to achieve the required thickness tolerance of ±2 μm proposed in literature[2] for calendering. In addition, the process model can visualize the force paths and compaction phases during the compaction process and thus provide an in-depth understanding of the calendering process.
According to the current research, the developed process simulation represents the first simulation of the calendering process of electrodes on a real scale. Therefore, it serves as the basis for further research. In addition to the advantages of parallelizing experiments, the economic benefits, and the knowledge gained from the process simulation, refining the bonding contact model and extending the process simulation to other materials is crucial. As the used bonding model is purely elastic, an increased plasticity ratio in the EEPA is necessary. An elastoplastic bonding model might result in decreased plasticity ratios and therefore higher Rayleigh time steps, leading to a shorter simulation time. Moreover, the process model should extend to particle fragmentation from high compression forces and temperature-controlled calender rolls. The obtained results lead to an in-depth understanding of the calendering process, reducing the time to adjust the main calendering parameter.
4 Experimental Section
The Experimental Section describes the production of the cathodes and the experimental calendering. Furthermore, the nanoindentation measurements are presented.
4.1 Cathode Production and Calendering
The cathodes were produced on the pilot-scale production line[17, 28] at the iwb of the Technical University of Munich (TUM). The slurry for cathode electrode consisted of 95.5 wt% cathode active material (NMC-622, BASF, Germany, with a bulk density of ρNMC–622 = 4.74 g cm−3), 2.25 wt% polyvinylidene–fluoride binder (PVdF, Solef 5130, Solvay, Belgium, with a bulk density of ρPVdF = 1.76 g cm−3), 1.50 wt% conductive carbon black (Super-C65, Timcal, Switzerland, with a bulk density of ρCB = 2.0 g cm−3), and 0.75 wt% conductive graphite (SFG6L, Imerys Graphite & Carbon, Switzerland, with a bulk density of ρSFG6L = 2.33 g cm−3). This work defines a cathode as the electrode layer composed of active material, binder, and conductive additives onto the current collector foil.
The dry mixing process was carried out with the Speedmixer DAC 3000.1 HP (Hauschild & Co, Germany). Afterward, the powder mixture was dispersed using a dissolver (Dispermat FM10, VMA Getzmann, Germany) and degassed. The rheological properties of the slurries were determined with the Kinexus pro rheometer (Malvern Panalytical, Germany) using a cone-plate configuration (with a diameter of 40 mm and an opening angle of 4°) and a test procedure that measured the viscosity versus the shear rate. At a shear rate of 100 s−1, the viscosity of the NMC-622 slurry for 78% solid content was 4.34 Pa s, and the viscosity for 79% solid content was 4.48 Pa s.
The cathodes were coated on an aluminum collector foil (15 μm, type 1100/H19, Hydro Aluminium Rolled Products, Germany) at a speed of 0.3 m min−1 using a doctor blade with the loadings of ≈33.1, ≈29.5, ≈27.9, ≈24.7, ≈21.8, and ≈16.4 mg cm−2, which corresponded to coating thicknesses of ≈115, ≈102, ≈94, ≈82, ≈71, and ≈49 μm respectively. The drying temperatures for the three 1 m infrared dryers were set to 70, 85, and 100 °C. Overall, ≈60 m of NMC–622 coating were produced with the specified mass loadings. Before calendering, the cathodes were classified into 300 mm electrode sections each by measuring the cathode thickness and mass loading, analogous to the procedure in Figure 8.
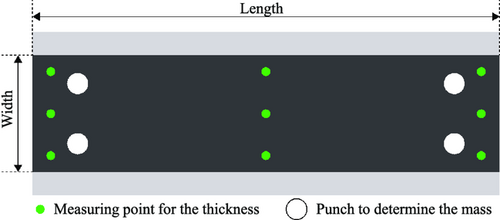
As illustrated in Figure 8, the thickness of the cathode was determined at nine homogeneously distributed measuring points along the length of the calendering sheet and the width of the calendering sheet, using a tactile gauge (40 EWRi, Mahr, Germany). The mass determination of the coating (AX 26/M Comparator, Mettler Toledo, Switzerland) to calculate the porosity was performed by weighing four punches with a diameter of 15 mm for each electrode section individually.
The porosity of the generated cathodes in the simulation was 43%. Therefore only cathodes in a porosity range between 42% and 44% were selected from the experimental electrode sheets. The cathodes were divided into six clusters based on the measured electrode thicknesses, the mass loading, and the resulting porosity (Figure 9).
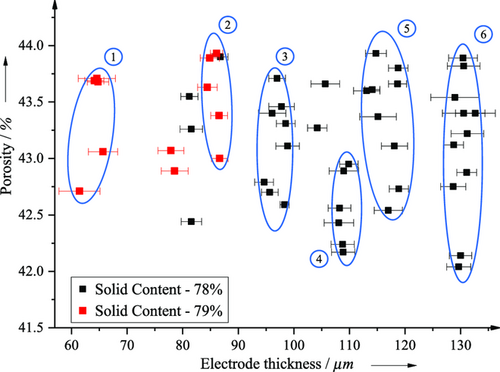
Each square in Figure 9 represents the mean value of porosity on the y-axis, the mean value of electrode thickness on the x-axis, and the standard deviation (error bars). The error bars mapped the variance of the coating thickness within the electrode sheet. Electrode sheets outside the porosity range of 42–44% were not considered within the scope of this work. In addition, the standard deviation of the electrode thickness within the cluster was set smaller than the maximum standard deviation of the electrode thickness of an electrode sheet to consider the electrodes in a cluster with the same compaction properties.
Table 3 lists the mean value, the standard deviation, and the assumed electrode thickness of the respective clusters in the experiment from Figure 9. The assumed cathode thickness was rounded to the nearest micrometer based on the mean values. The assumed cathode thicknesses in the following table refer to the electrode thickness, and the substrate foil thickness of 15 μm was assumed to be constant. The assumed thickness values were taken for the following simulations.
| Description | MVa) [μm] | SDb) [μm] | Assumed thickness [μm] |
|---|---|---|---|
| Cluster 1 | 64.11 | 1.43 | 64 |
| Cluster 2 | 85.91 | 0.91 | 86 |
| Cluster 3 | 97.125 | 1.43 | 97 |
| Cluster 4 | 108.81 | 0.58 | 109 |
| Cluster 5 | 116.51 | 2.12 | 117 |
| Cluster 6 | 130.24 | 1.14 | 130 |
- a) MV: mean value;
- b) SD: standard deviation.
In Table 4, the mean value, the standard deviation of the measured coating mass loading of the individual clusters from Figure 9, and the assumed porosity are displayed. The mean value and standard deviation were calculated from the mass loading within a cluster. Individual electrode sheets outside the tolerance do not help to compare simulation and experiment results and were therefore not considered in the analysis of mass loading.
| Description | MVa) [mg cm−2] | SDb) [mg cm−2] | Assumed porosity [%] |
|---|---|---|---|
| Cluster 1 | 16.42 | 0.32 | 43 |
| Cluster 2 | 21.78 | 0.28 | 43 |
| Cluster 3 | 24.74 | 0.36 | 43 |
| Cluster 4 | 27.92 | 0.13 | 43 |
| Cluster 5 | 29.50 | 0.63 | 43 |
| Cluster 6 | 33.06 | 0.35 | 43 |
- a) MV: mean value;
- b) SD: standard deviation.
The specified standard deviations in Table 3 and 4 confirm the assumption that the compaction properties of the electrodes within a cluster could be assumed to be the same. Consequently, the assumption that the compaction properties of the electrodes within the cluster was almost identical is confirmed. The calender used for compaction was EA 102 (Coatema, Germany) with a roll diameter of 400 mm and a maximal line load of 1000 N mm−1 at a constant speed of 0.5 m min−1. The calendering process was executed gap controlled, with the actual gap measured by four capacitive measuring sensors (CSH2FL-CRm1.4, Micro-Epsilon, Germany) inserted in the turned roll gap. For this purpose, the length of the roll body was shortened from 400 to 350 mm, to insert a shaft shoulder with a depth of 11 mm and a width of 25 mm on each side of the roll to integrate the sensors directly in the roll gap. The current gap value for each side was calculated by adding the top and bottom sensor values and subtracting an empirically determined correction factor. The correction factor for the left side was 1,790 μm and the one for the right side was 1,836 μm.
4.2 Nanoindentation Measurements
The mechanical compression behavior of the electrodes was measured using nanoindentation (Nanoindenter UNAT from Asmec). As indenter head, a flat punch with a diameter of 100 μm and an opening angle of 60° ± 5° was used. The measurements included four indentation depths (10, 15, 20, and 25 μm) per electrode thickness. Each indentation depth was executed at least 100 times to account for statistical irregularities such as the distribution of NMC-622 particles. Outliers were detected and rejected by analyzing the compression force and depth with a boxplot.[31] The measurement points per compression depth were set with a constant spacing of 300 μm and an indentation velocity of 0.15 μm s−1. The indentation speed was selected analogous to Sangrós Giménez et al.[22] After outlier detection, an averaged force–displacement curve was obtained, which described the mechanical behavior under uniaxial compression depending on the electrode thickness and compaction depth. Figure 10 shows 94 μm coating thickness (109 μm electrode thickness, cluster 4) as an example.
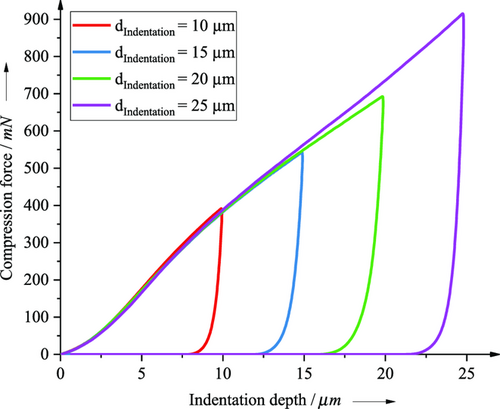
The curve progression was similar for the different indentation depths within coating thickness, with deeper indentation depth increasing the force proportionally. For the depicted coating thickness of 115 μm, a degressive curve progression resulted, and the slope decreased progressively with increasing penetration depth.
5 Computational Section
In this section, the simulative approach is described. The simulations are divided into the simulation of the nanoindentation (electrode model) and the simulation of the calendering process (process model). The simulation for the electrode and process model is performed using the software Altair EDEM.
5.1 Electrode Model
The simulation of the electrode model was executed analogously to Schreiner et al.[26] and Schreiner et al.[27] on a 250 μm × 250 μm control volume with the respective coating thickness of the six clusters (see Table 3). Analogously to Ngandjong et al.[25] and Sangrós et al.[23, 24] the particle beds are compressed with a compression plate with the footprint dimensions of the particle bed, whereas Sangrós et al.[22] used a smaller compaction geometry. The compression velocity is adopted from Schreiner et al.[26] and is 1.5 m s−1. Periodic boundaries in x- and y-direction are set for the boundary conditions. The selected material parameters, such as Young's modulus of the NMC-622 particles, the conductive additive–binder matrix (CABM), the substrate foil, the plate/roll, the respective Poisson's ratio, and densities, are shown in Table 5.
| Poisson's ratio ν | Density ρ [g cm−3] | Young's modulus [Pa] | |
|---|---|---|---|
| NMCa) | 0.30 | 4.74 | 9.94 × 10⁸ |
| CABMb) | 0.30 | 1.70 | 2.84 × 10⁹ |
| SFc) | 0.34 | 2.70 | 70 × 109 |
| P/Rd) | 0.28 | 7.85 | 210 × 109 |
- a) NMC: NMC-622;
- b) CABM: Conductive additive–binder matrix;
- c) SF: Substrate foil;
- d) P/R: Plate/Roll.
The particle size distribution measured by static light scattering (SLS) is used for determining the active material particle size distribution to make the simulation as realistic as possible. The largest NMC-622 particles have a diameter of 20 μm, the smallest one of 3.4 μm. In contrast to the NMC–622 particles, the particle size of the conductive additive–binder particle is constant with a diameter of 3.4 μm. For easier readability, the CABM is named in the article as Binder. The model parameters are determined based on the study by Schreiner et al.[27] Table 6 lists the initial values for particle–particle interaction parameters.
| Particle–particle interaction | Static friction coefficient μs | Rolling friction μR | Restitution coefficient e |
|---|---|---|---|
| BBa) | 1.5 | 0.01 | 0.5 |
| BNb) | 0.3817 | 0.01 | 0.2 |
| NNc) | 0.4374 | 0.01 | 0.5 |
| BFd) | 1.5 | 0.01 | 0.5 |
| BP/Re) | 0.2 | 0.01 | 0.2 |
| NFf) | 1.5 | 0.01 | 0.5 |
| NP/Rg) | 0.2 | 0.01 | 0.2 |
- a) BB: Binder–Binder;
- b) BN: Binder–NMC;
- c) NN: NMC–NMC;
- d) BF: Binder–Foil;
- e) BP/R: Binder–Plate/Roll;
- f) NF: NMC–Foil;
- g) NP: NMC–Plate/Roll.
Table 7 lists the initial EEPA parameters for particle–particle interaction, whereas Table 8 shows the initial EEPA parameters for particle–geometry interaction.
| Particle–particle interaction | Pull-off force f0 in [μN] | EEPA exponent [n] | Surface energy Δγ [N m−2] | Plasticity ratio [λp] | Tensile exponent X | Tangential stiffness [ζtm] |
|---|---|---|---|---|---|---|
| BBa) | 0 | 1 | 60 | 0.985d) | 2.5 | 0.4 |
| BNb) | 0 | 1 | 20 | 0.985d) | 2.5 | 0.4 |
| NNc) | 0 | 1 | 5 | 0.9899d) | 2.5 | 0.4 |
- a) BB: Binder–Binder;
- b) BN: Binder–NMC;
- c) NN: NMC–NMC;
- d) In the process model, the particle–particle plasticity ratio is decreased to 0.5 for Binder–Binder, Binder–NMC, and NMC–NMC.
| Particle-geometry interaction | Pull-off force f0 [μN] | EEPA exponent [n] | Surface energy Δγ [N m−2] | Plasticity ratio [λp] | Tensile exponent X | Tangential stiffness [ζtm] |
|---|---|---|---|---|---|---|
| BFa) | 0E) | 1 | 20 | 0.1 | 1 | 0.4 |
| BP/Rb) | 0 | 1 | 5 | 0 | 2.5 | 0.4 |
| NFc) | 0E) | 1 | 0 | 0.9132F) | 3 | 0.4 |
| NP/Rd) | 0 | 1 | 0 | 0.9687F) | 3 | 0.4 |
- a) BF: Binder–Foil;
- b) BP/R: Binder–Plate/Roll;
- c) NF: NMC–Foil;
- d) NP/R: NMC–Plate/Roll;
- E) In the process model, the pull-off force for Binder–Foil and NMC–Foil is decreased to –75 μN;
- F) In the process model, the plasticity ratio for NMC–Foil and NMC–Roll is decreased to 0.5.
Table 9 summarizes the initial bonding parameter. The bonding parameters exist only for particle–particle interactions.
| Particle-particle interaction | Normal stiffness kn [N m−3] | Shear stiffness kt [N m−3] | Critical normal stress σmax [Pa] | Critical shear stress τmax [Pa] | Bonded disk radius Rb [μm] |
|---|---|---|---|---|---|
| BBa) | 1.00 × 10¹⁴ | 1.00 × 10¹⁴ | 1.00 × 10⁸ | 1.00 × 10⁸ | 1.50 |
| BNb) | 1.00 × 10¹⁴ | 1.00 × 10¹⁴ | 1.00 × 10⁸ | 1.00 × 10⁸ | 1.50 |
| NNc) | 1.08 × 10¹² | 4.78 × 10¹⁵ | 1.24 × 10⁹ | 5.54 × 10⁹ | 6.50 |
- a) BB: Binder–Binder;
- b) BN: Binder–NMC;
- c) NN: NMC–NMC.
In addition to the simulation with the initial parameters, the nine relevant model parameters identified by Schreiner et al.[27] were optimized by the help of the measured force–displacement curve of the nanoindentation measurements using the Global Response Search Method (GRSM) algorithm.[32, 33]
With a time step of 6.0841 × 10⁻¹¹ s (0.5% of Rayleigh time step) in the electrode model, the simulation time took ≈1–2 h using a computer with 256 GB of RAM, composed of two Intel Xeon Gold 6244 CPUs @ 3.60 GHz each with eight physical cores, and an NVIDIA QUADRO RTX 4000 with 8 GB VRAM depending on the particle bed thickness and the indentation depth. Due to the simulation time, 50 iteration steps (variation of sensitive parameters) were assumed for the optimization algorithm. The model parameter optimization, comparing experimental nanoindentation measurements and the simulation, took several days with the computers used.
Table 10 provides an overview of the different cluster thicknesses and the respective number of particles in the electrode model.
| Description | Simulative coating thickness [μm] | Number of total particles | Number of NMC-622 particles | Number of binder-particles |
|---|---|---|---|---|
| Cluster 1 | 49 | 16,241 | 3,860 | 12,381 |
| Cluster 2 | 71 | 22,813 | 5,539 | 17,274 |
| Cluster 3 | 82 | 26,126 | 6,375 | 19,751 |
| Cluster 4 | 94 | 29,701 | 7,782 | 22,419 |
| Cluster 5 | 102 | 31,939 | 7,812 | 24,127 |
| Cluster 6 | 115 | 34,356 | 8,594 | 25,762 |
The smallest coating thickness of 49 μm (Cluster 1) has a total amount of particles of 16 241 for the electrode model dimensions of 250 μm × 250 μm, of which 3,860 particles are NMC-622, and 12 381 are binder particles. The high number of binder particles is mainly due to the differences in particle size of NMC-622 and binder. The underlying composition is 95.5 wt% NMC-622 and 4.5 wt% binder. Figure 11 illustrates a simulation of the electrode model with a compression plate at the top and substrate foil at the bottom.
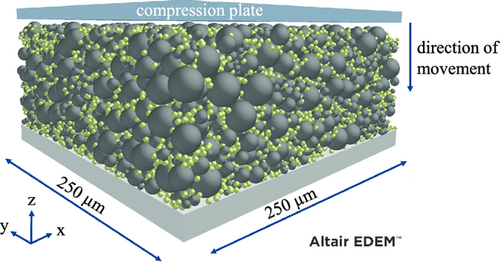
As shown in Figure 11, the material model consists of a substrate foil (aluminum), the coating bed, and the compression plate (steel). For illustration purposes, the NMC-622 particles in Figure 11 are shown in gray, whereas the CABM particles are shown in yellow. The depicted particle bed shows the electrode model after particle generation and truncation to the investigated particle bed thickness. The cutoff criterion is defined as the coating thickness being less than or equal to the height z-coordinate of the center of a particle plus half the particle's radius. As shown in the figure, the CABM particles are distributed between the NMC–622 particles and form a matrix that holds the NMC-622 particles together.
5.2 Process Model
Analogous to the material model, the process simulation consists of a compaction geometry and the particle bed representing the electrode coating. While the parameters of the particle bed are calibrated in the material model based on uniaxial compression by a plate, the compaction geometry in the process simulation corresponds to the dimensions of the real calendering line at iwb. Thus, the roll diameter is set to 400 mm. Since this is up to five orders of magnitude larger than the micrometer-sized particles, not the entire roll is simulated, but only a 9 mm-long roll segment. In addition, it is assumed that the substrate foil does not deform in the simulation. Instead, elastic and plastic overlaps represent the deformation of the particles at the interface of the substrate foil and the surface of the roll. This roll segment compresses the created particle bed, as shown in Figure 12.
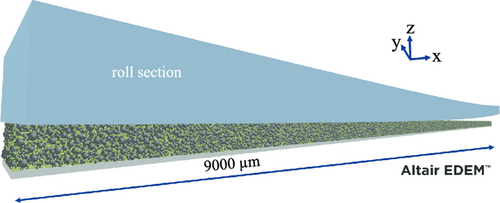
For model simplification, in contrast to reality, the roll is moved in the simulation, and thus the particle bed is compressed in the longitudinal direction. To shorten the simulation time, the calender roll segment in the process simulation moves down (z-direction) at a velocity of 1 m s−1, forward (x-direction) with 30 m s−1, and rolls over the coating with an angular velocity of 150 rad s−1. Preliminary tests showed that the increased speed in the simulation has a negligible effect on the resulting electrode thickness after calendering. For this purpose, the following forward speeds (x-direction) were investigated: 0.1, 0.5, 0.75, 1, 2, 5, 10, 15, and 30 m s−1.
In the investigations, the roll gap width within the simulation was set to the same roll gap width as used in the experiment, and the resulting electrode thickness was analyzed. The electrode thickness is evaluated with an aforementioned python script, where all coordinates for NMC-622 and binder particles (plus half of the diameter of the binder particles of 3.4 μm) are derived. This is followed by Bucketsort–Algorithm along the y-axis in 90 buckets for binder and NMC-622. Then the particles within one partition are sorted according to the z-value. The five “highest” particles are removed, and the z-height of the remaining “highest” particle is compared with the second-highest particle for binder and NMC-622. This technique guarantees that particles located above the electrode surface will not falsify the determination of the electrode thickness. In case the position of the highest, and the second-highest particle differs by a factor of 1.05, the highest particle is deleted, and the comparison is repeated. This furthermore ensures that particles above the electrode surface are not considered for the thickness determination. As the criterion is fulfilled, the average for NMC-622 and binder is calculated from the five highest remaining particles.
For all 90 buckets, the maximum z-value of binder and NMC-622 is compared. In case the determined z-value of the binder is >1.2 of the z-value of NMC-622, the NMC-622 is selected in an if-loop otherwise, the z-value of the binder is selected. This is because plastic deformation is not taken into account when specifying the particle height. For binder particles, the evaluation assumes that the highest point of the particle does not differ much due to the small particle diameter of 3.4 μm. The resulting electrode thickness of the simulation is the average of the maximum z-values of the 50 buckets in the range of 1–6 mm of the electrode length. This is because at the beginning of the particle bed in the simulation, edge effects occur, which affect the simulation result.
As shown in Figure 13a, the surface of the particle bed is rough before calendering, and some particles protrude from the surface. While before calendering mainly the larger NMC-622 particles (gray) protrude at the surface, after calendering the electrode surface is smoothed, as illustrated in Figure 13b. The previously protruding particles are pressed into the electrode. No distinction between NMC-622 and binder particles is visible. The electrode surface is equally formed by both particle types. Comparing Figure 13a,b, the compression paths of individual particles can be traced. The single particles above the electrode surface are the cause of the previously described thickness determination criteria.
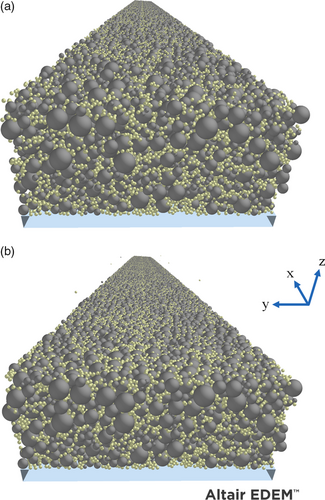
The 9 mm-long particle bed was created by generating a representative volume element of 500 μm length (250 μm width) and generating it 18 times in longitudinal direction. Due to the periodic boundary conditions in y-direction, the resulting particle forces and motions within the 9 mm-long particle bed are passed along. The corresponding coating thickness is determined analogously to the electrode model by the cutoff criterion.
Preliminary tests showed that the electrode in the process simulation was too plastic. To better reproduce the elastoplastic behavior of the electrodes after the roll gap width, the plasticity ratios in the process simulation were decreased from values >0.9–0.5 for Binder–Binder, Binder–NMC, NMC–NMC, NMC–Foil, and NMC–Roll. In addition, it was determined in preliminary tests that the constant pull-off force for Binder–Foil and NMC–Foil should be set from 0 to −75 μN to account for the tangential forces introduced by the calender roll. All other process model parameters correspond to those of the material model (compare Table 5–9).
Analogous to the material model, the particle bed of the process simulation has a width of 250 μm and exhibits periodic boundaries. This assumption of periodic boundary conditions combined with 250 μm coating width must continue to apply, since otherwise the number of particles would become too high, and thus, the simulation time would increase. Even the smallest particle bed of the process simulation, with a length of 9 mm, a width of 250 μm, and a coating thickness of 49 μm, comprises 564,138 particles, of which 428,454 are binder particles and 135,684 are NMC-622 particles. Table 11 gives an overview of the total number of particles, the number of NMC-622 particles, and the number of binder particles for all of the six investigated electrode thicknesses in the process model.
| Description | Simulative coating thickness [μm] | Number of particles | Number of NMC-622 particles | Number of Binder particles |
|---|---|---|---|---|
| Cluster 1 | 49 | 564,138 | 135,684 | 428,454 |
| Cluster 2 | 71 | 811,672 | 195,336 | 616,336 |
| Cluster 3 | 82 | 929,018 | 226,350 | 702,668 |
| Cluster 4 | 94 | 1,035,959 | 256,158 | 779,801 |
| Cluster 5 | 102 | 1,142,639 | 279,540 | 863,099 |
| Cluster 6 | 115 | 1,237,032 | 306,702 | 930,330 |
With a time step of 9.73456 × 10⁻¹¹ s (0.8% of Rayleigh time step), using a computer with 192 GB of RAM, composed of 2 Intel Xeon 5220R CPUs @ 2.20 GHz, each with 24 physical cores, and an NVIDIA QUADRO GV100 with 32 GB VRAM, the simulation time of the process model took ≈48–72 h. Since preliminary tests have shown that increasing the Rayleigh time step from 0.5% to 0.8% does not affect the resulting electrode thickness after calendering, and 0.8% Rayleigh time step was used to save computation time. This results in ≈37% shorter simulation time.
Acknowledgements
The authors extend sincere gratitude to the Federal Ministry of Education and Research (Bundesministerium für Bildung und Forschung) for funding this research. The results presented in this article have been achieved within the scope of the project “MiKal” (grant number 03XP024C). Many thanks to André Klinger for the fundamental work in developing the process simulation. Many thanks to Josef Keilhofer for mixing the slurry and Sajedeh Haghi for support during coating. Special thanks to Michael Schüßler for implementing and validating the roll gap measurement at the calendering machine. Many thanks to Zwick Roell for providing the UNAT nanoindenter from Asmec. The authors’ special gratitude for their time and valuable input go to Dr. David Curry, Stefan Pantaleev, Dr. Lewis Scott, and Dr. Carlos Labra from Altair EDEM. Many thanks to Michael Schüßler and Fabian Konwitschny for the valuable discussion and proofreading of the manuscript.
Open Access funding enabled and organized by Projekt DEAL.
Conflict of Interest
The authors declare no conflict of interest.
Open Research
Data Availability Statement
The data that support the findings of this study are available from the corresponding author upon reasonable request.


