Machine Learning-Based Failure Prediction in Concrete Slabs and Cubes Under Impact Loading
Funding: This work was supported by the King Saud University for funding this work through Researchers Supporting Project number (RSPD2025R711), King Saud University, Riyadh, Saudi Arabia.
ABSTRACT
Experts have been interested in the behavior of concrete under impact loading because of its wide range of applications in construction projects. Due to their quasi-brittle nature, failure modes related to concrete may occur without any prior warning signs of destruction, and they also expose the supporting element to the spread of damage. Finite element modeling and machine learning techniques are essential for conducting an adequate reliability investigation of the behavior of concrete samples as slabs and cubes under impact load. The research uses gradient boosting, random forest, lasso, linear regression, and support vector regression to create predictive models for the behavior of these two concrete models. The models were created by taking experimental concrete slab tests and 20 cubes into consideration. Design standards-based statistical comparisons such as coefficient of determination and root mean square error are used to assess the efficacy of the generated models. These results show that with increasing impact load intensity, displacements and failures in the slab increase significantly. Using these models allows engineers to design more resistant and optimal structures against impact loads. This research shows that machine learning models, especially random forest and gradient boosting, can provide accurate predictions of failures and cracks in concrete under impact loads and are useful tools for analyzing concrete behavior under dynamic and complex conditions. The linear regression with a coefficient of determination (R2) of 0.995 and lasso regression with RMSE of 3.9 have the lowest accuracy, while random forest and gradient boosting models with R2 of 0.9991 and 0.2, 0.991 and 0.5. respectively, showed higher accuracy in predicting concrete cracks and failures.
1 Introduction
In recent years, the study of concrete behavior under impact loading has attracted the attention of researchers due to its wide applications in different civil engineering aspects such as bridges, buildings, industrial construction, pavement, and etc. Concrete plays an important role in constructing buildings and carrying loads under static and dynamic loads. In many practical situations, concrete may be exposed to impact forces caused by bullet impacts, explosions, or earthquakes, and a detailed understanding of the failure and damage mechanisms of concrete under these conditions is essential [1-6]. Impact resistance in concrete is of great importance due to its vital role in maintaining the safety and durability of structures. Concrete is exposed to sudden forces such as impacts from heavy equipment, falling objects, or dynamic loads on roads, bridges, and industrial floors. If concrete cannot withstand these impacts, cracking, failure, or rapid erosion will occur, which not only increases maintenance costs but also threatens the safety of the structure and users. Improving impact resistance by using additives such as steel or polymer fibers, reinforced aggregates, and optimized mix design makes concrete resistant to repeated stresses and mechanical impacts. This feature is essential in high-traffic environments, earthquake-prone areas, or military structures that are prone to impact loads and helps to extend the life of the structure and reduce the risks of sudden failure [7-10].
Moreover, impact loading is a complex process that involves rapid energy transfer to the structure and the creation of intense local stresses [11]. It is of particular importance in the design of resistant structures because of its effect on the mechanical behavior of concrete. Concrete behavior under impact is influenced by multiple material characteristics [12-14]. Also, the mechanical properties of concrete are related to the dynamic strength of concrete. Some studies used fiber for reinforced concrete, and some studies used 3D printing for reinforced concrete, which improves the mechanical properties of concrete [15-17]. The impact resistance of concrete against projectiles is important because of its critical role in protecting military structures, critical infrastructure, and security facilities from high-velocity attacks (such as bullets or shrapnel). Published studies show that concrete with high impact resistance dissipates the kinetic energy of projectiles through energy absorption mechanisms (such as controlled crushing, plastic deformation, and interparticle friction), preventing sudden penetration or destruction. For example, the addition of steel fibers, polymers, or nanomaterials (such as nano silica) increases the compactness of the concrete microstructure and improves resistance to cracking and dynamic failure. It has also been proven that special concretes, such as UHPC (ultra-high-performance concrete) with high density and polymer binders, can withstand high-velocity projectile impacts due to reduced porosity and increased fracture toughness. Failure of concrete structures under impact loads can lead to catastrophic collapse. Therefore, optimizing impact resistance for defense and safety applications is an engineering priority [18-21].
Some studies attempt to reinforce concrete with fiber to improve impact resistance [22]. For example, Soe et al. [23] show that when 1.75% polyvinyl alcohol fiber and 0.58% steel fibers are added to concrete, the small ogive–nose steel projectile is shown at the impact point. Some studies show that the impact resistance of hybrid fiber-reinforced concrete is better than that of fiber-reinforced concrete with a single fiber. For example, when 0.5% of steel fiber is added, the concrete damaged zone experiences cracking, spalling, and fragmentation [24]. Meanwhile, Almusallam et al. [25] examined the effects of hybrid (plastic and steel) fibers on concrete and found better impact resistance. Other pioneering methods, such as additive manufacturing, improved the impact resistance of concrete. Xie et al. [26] analyzed auxetic cementitious cellular composites (ACCCs) against impact loading. They found that ACCC can improve impact resistance by more than 50% compared to concrete with conventional geometry.
In recent studies, the impact strength of concrete has been considered as a key indicator in the design of structures under dynamic loads. For example, Zhang et al. [27] showed that the addition of basalt-polypropylene fibers to conventional concrete increased the impact strength by 40% and limited the propagation of cracks under high-velocity impacts. Niş et al. [28] reported a 35% improvement in the energy absorption of concrete under impact loading using nano silica and steel fibers. In another study, Liu et al. [29] investigated the effect of a UHPC mix design with a compressive strength of 150 MPa and confirmed a 60% reduction in the permeability of high-velocity projectiles. Su et al. [30] measured a 50% increase in the fracture toughness of concrete in four-legged impact tests by incorporating glass fibers and modified polymers. There is a lot of research on impact resistance, but there is a need for a simple way to understand impact resistance without testing, so studying the finite element method (FEM) for impact loading with a simple method is a need.
Some studies are investigating FEM models to understand the impact of loading. For example, Yu et al. [31] overcome the limitations of traditional pre-dynamic models (BBPD and OSBPD) in simulating concrete damage under impact loads by developing the CDPM2-PD model, which integrates the concrete plasticity damage model (CDPM2) into the non-uniform state-based pre-dynamic framework (NOSBPD). The proposed model combines the effects of strain rate, strain hardening, and bond damage criterion for tensile/compressive failure and accurately simulates the dynamic cracking process. Numerical experiments show strong agreement with experimental observations in crack patterns and failure mode transitions, which provides an efficient tool for analyzing the behavior of concrete under complex impact loads. In another example, Hason and Al-Janabi [32] investigated the behavior of cementless reinforced concrete slabs under uniform (e.g., static loads) and impact (dynamic loads) loads through experimental tests and numerical simulations. The results show that cementless concrete with stable substitutes (e.g., pozzolanic materials) can perform similarly to traditional concrete in load bearing, but the failure pattern and crack distribution under impact loads show significant differences due to the heterogeneity of the materials. Chen et al. [33] analyzed geopolymer concrete under impact loading. Their experimental and numerical study investigated the behavior of steel fiber reinforced geopolymer concrete slabs under impact loading. The experimental results showed that the addition of steel fibers to geopolymer concrete increased the impact strength by up to 35% and limited the crack propagation by the energy absorption mechanism through fiber tension.
Numerical methods such as finite element analysis (FEM) known as effective methods to understand the dynamic properties of materials such as crack progression [34]. These methods allow researchers to investigate failure mechanisms and crack propagation at different scales [35]. In recent studies, combining numerical methods with machine learning models has led to more accurate predictions of concrete behavior under complex loading conditions [36]. Modeling using Python and finite element analysis has increased the ability to examine the microstructural details of concrete and the effects of various factors on its strength and energy absorption [37, 38]. One of the fundamental challenges in the analysis of concrete failure under impact loading is the accurate prediction of crack propagation paths [39]. Regression models such as linear regression, lasso, random forest, and gradient boosting play an important role in modeling concrete behavior [40]. These models can help to forecast concrete and concrete elements with high accuracy [41]. Recent studies have shown that random forest and gradient boosting have higher accuracy in predicting cracks than classical methods [39]. Machine learning can help predict impact loading for the optimization of concrete and structural elements. Energy dissipation and energy absorption by concrete are key factors in determining its resistance to impact loading. Numerical studies show that concretes reinforced with acoustic structures are able to better distribute energy and reduce stress concentration at critical points [33]. Analytical models such as the random aggregate distribution model and the exponential force decay model show the effect of non-uniform energy distribution on concrete failure mechanisms [42].
In this paper, for the first time, a combination of finite element modeling (FEM) methods and machine learning algorithms is presented to predict the behavior of concrete under impact loading. While previous studies have investigated the impact resistance of concrete using different materials, concrete mix designs, or finite numerical methods, this research goes a step further and provides a more accurate prediction of crack paths, failure zones, and deformation of concrete under impact loading by combining FEM and regression models. The proposed method involves 3D modeling of concrete with precise meshing and analysis of impact force as an exponential decay at different points. Then, using regression models such as linear regression, lasso, random forest, gradient boosting, and support vector regression (SVR), the crack paths and vulnerable points of concrete are predicted. This combination not only allows for a more accurate analysis of concrete failure mechanisms, but also provides engineers with tools to optimize the design of impact–resistant structures.
2 Materials and Methods
The models were created by taking 20 concrete cubes and slab tests into consideration. The concrete cube is a three-dimensional network of small volume segments, each of which acts as an independent part of a larger structure. This method allows us to study the effects of impact at different points and helps to simulate the behavior of concrete under the action of different forces. The thickness and concrete's compressive strength (fc) of the concrete slab sample were 0.5 m and 120 MPa, respectively, while the tensile strength (ft) and the Young's modulus of concrete (E) were 3.1 MPa and 30 GPa, respectively. In addition, Poisson's ratio (ν) of concrete was considered to be 0.2, which plays an important role in calculating the flexural stiffness of the slab (D). The dimensions of the concrete slab were also considered to be 5 × 5 m, and a mesh size of 0.001 m (1 mm) is used, which provides high accuracy in the analysis. These dimensions determine the number of pages (num_pages) and columns (num_columns) of the grid.
In this paper, the procedure for simulating the behavior of concrete under impact loading using finite element modeling (FEM) and machine learning with the help of Python is explained. The simulation makes use of a 3D mesh of cubes, each of which appears independently from the others. The mesh's material composition consists of granular, fluid, and cohesive components. The point of application of the force (impact) is precisely determined at the topmost layer of the structure, and the impact force is derived using the bullet's mass and velocity, applying the kinetic energy relation, and to better represent the impact effect, this force is increased exponentially. In the next step, the concrete is analyzed using a mesh with 20 cubes in each dimension, so that each cube can be individually affected by the impact. The impact effect is calculated at each step with an exponential decrease based on the distance from the impact point, and then the stress at each point of the concrete is checked. If the stress exceeds the allowable limit of the concrete, that point is considered a failure point and is displayed in black in the model. Otherwise, the displacement of the concrete under impact is calculated and displayed. Five steps of modeling are used to track the impact of force reduction and concrete modifications over time. At each stage, the force is reduced, and the amount of concrete failure and displacement is updated. The model is also able to analyze the effects of different impact angles, different bullet sizes, and residual stresses after impact. This method allows engineers to simulate the behavior of concrete under different impact loading conditions and use the results in the design of impact-resistant structures.
In this research, a concrete slab model is conducted in addition to the concrete cube simulation. To analyze the slab under impact load, first the physical properties of the slab such as thickness, compressive strength, tensile strength, and Young's modulus are defined. Then, the properties of the bullet such as mass, velocity, and force obtained from its kinetic energy are calculated. The slab is meshed with high precision, and various points are considered for displacement analysis. To analyze this slab, a nonlinear function is used that calculates the amount of slab displacement based on the forces acting on it and the bending stiffness of the slab. In the slab simulation, first the force is applied at a specific point of the slab, and the amount of slab displacement is calculated in five time steps. At each step, the maximum displacement is recorded, and to display the failure points, the areas where the stress exceeds the tensile strength of the concrete are indicated with the value Not a Number (NaN). This simulation helps engineers to examine the changes and failures of concrete under impact load and identify the damaged areas. Also, 3D diagrams of the slab surface at each time step are provided that clearly show the changes and failure areas. Finally, to predict the direction of major cracks, various regression models such as linear regression, lasso, random forest, gradient boosting, and SVR have been used. These models help to accurately predict the behavior of the slab under impact load, and the accuracy of the predictions is evaluated using indicators such as the coefficient of determination (R2) and root mean square error (RMSE). The results indicate that machine learning models can perform with high accuracy in predicting the behavior of concrete under impact loads.
2.1 Cube and Slab Materials and Characteristic
According to this study, the compressive and tensile strength of concrete were 120 MPa and 3.1 MPa respectively, and the Young Modulus was more than 30 GPa. Moreover, Poisson's ratio was 0.2. It should be noted that the thickness of the slab was 0.5 m and the length and width of the concrete slab were 5 m each 5 m. In addition, according to the grid settings, a grid of 1 mm was considered in order to improve maximum accuracy.
2.2 Coding Process
To simulate the behavior of concrete under impact loading, the coding process is performed in three main steps. First, the model geometry and 3D meshing of the concrete are determined. In this step, a 3D mesh of discrete cubes is constructed, with each cube behaving independently. This step involves defining the materials, including granular, fluid, and cohesive components for each cube. Then, the point of force application (impact) is precisely determined in the upper layer of the structure, and the force is calculated based on the mass of the bullet and its acceleration. To better represent the impact effect, the force is increased exponentially. Coding this step involves generating the mesh, calculating the forces, and defining the initial conditions for the simulation.
In the second step, the impact and response analysis of the concrete is performed. This step involves coding an algorithm that examines the impact effect in each cube. To do this, the impact force is calculated at each time step by exponentially decreasing based on the distance from the impact point. Then, the stress at each point is calculated, and if the stress exceeds the allowable limit of the concrete, that point is marked as a failure point and displayed in black in the model. If the stress is within the allowable limit, the displacement of the concrete under impact is calculated and displayed. This stage of coding involves using numerical methods to calculate the stress and displacement and display the results.
In the third stage, a more advanced analysis is performed to simulate the concrete slab. First, the physical properties of the slab such as thickness, compressive strength, tensile strength, and Young's modulus are defined. Then, the properties of the bullet such as mass, velocity, and force resulting from kinetic energy are calculated. In this stage, the slab is meshed with high accuracy, and various points are defined for displacement analysis. A nonlinear algorithm is coded to calculate the displacement of the slab based on the applied forces and the flexural stiffness of the slab. Also, to predict the path of the main cracks, various regression models such as linear regression, lasso, random forest, gradient boosting, and SVR are applied, and their accuracy is evaluated with indicators such as R2 and RMSE. This step involves combining FEM and machine learning methods to provide accurate and reliable results.
2.3 Bullet Behavior on the Cube and Slab
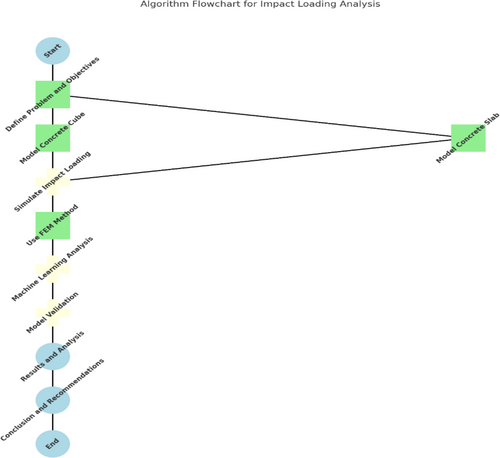
A methodical approach that starts with problem and objective definition, impact loading simulation, machine learning analysis, and model validation is used to provide an algorithmic framework for impact loading analysis, as shown in Figure 1. The algorithm predicts the behavior of concrete under impact loads by following a detailed process.
The slab is meshed with high precision, and various points are considered for displacement analysis using a two-dimensional grid. The flexural stiffness of the slab is also calculated to determine the effect of the forces applied to it. Then, a nonlinear function is designed to calculate the displacement of the slab under the influence of impact forces, which estimates the amount of deformation at each point of the slab based on the distance from the impact point. This program calculates and displays the displacement of the slab under a gradual increase in impact force in five time steps. At each step, the maximum displacement is recorded, and to display the failure points, the areas where the stress exceeds the tensile strength of the concrete are marked with the value NaN. Also, graphs are drawn to show the relationship between force and displacement at the impact point and the maximum displacement in the slab. In addition, 3D diagrams of the slab surface at each time step are provided, showing the deformation and failure zones. The program generally investigates the mechanical behavior of concrete slabs under sudden impact, allowing for visual and numerical analysis of the results.
In this study, the output map is presented to visually display the results of the mechanical analysis of concrete under impact loading. The stress and displacement at different points of the concrete are displayed using a color system, such that points with high stress or significant displacement are displayed with warm colors (red or orange) and points with lower stress or displacement are displayed with cool colors (blue or green). In addition, in areas where the applied stress exceeds the tensile strength of the concrete and failure occurs, the value NaN (not a number) is used as a failure index. This method helps in accurate identification of failure points and crack propagation analysis. Also, the modeling includes a three-dimensional display of the failure zones and deformation of the concrete surface at five different time steps, which provides useful information for analyzing the behavior of concrete under impact loading. This visual mapping system enables engineers to accurately observe the mechanical changes of concrete and improve the design of more impact-resistant structures.
2.4 Machine Learning Methods: Regressions
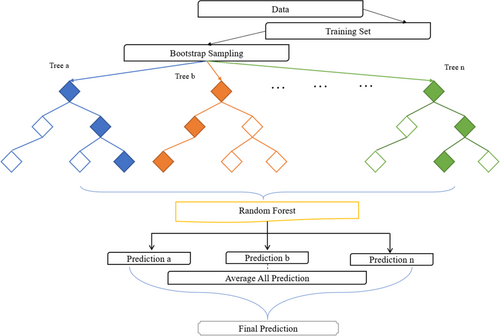
In Random Forest (RF) regression, all datasets are transferred to training data after clustering. Figure 2 shows the prediction through n trees after all the tree prediction samples are accumulated (Figure 2) [48, 49].
In the process of training the predictive models in this study, the data were first divided into two sets: 80% as training data and 20% as test data. This standard division was done in order to evaluate the model in predicting the behavior of concrete under impact loading. To increase the accuracy of the models and avoid the effects of different scales of the features, the input features were normalized using standard scaling. In this step, the mean of each feature was converted to zero and the standard deviation to one so that the models could process the features effectively. Also, to improve the performance of the machine learning models, preprocessing steps were performed including checking outliers, filling missing values, and checking the correlation between features. The data included concrete composition features (such as cement, water, sand, and aggregate proportions) and impact conditions (such as bullet mass and velocity). These data were uniformly distributed to avoid model bias and maintain prediction accuracy under different conditions. The regression models used included linear regression, lasso, random forest, gradient boosting, and SVR, each of which was evaluated based on indicators such as coefficient of determination (R2) and root mean square error (RMSE). These steps ensure that the models have a high ability to predict the behavior of concrete under impact loading.
2.4.1 Validation of Regressions
3 Results
3.1 Concrete Cubes
3.1.1 Compressive Strengths of Concrete Cube Models
To find the fracture model of cubic model samples, the cubic mesh with 20 boxes in each axis is defined. Five steps are defined, and the loading is a constant value of 100 kN. Due to analyze cubic, a sample was selected from a previous study. Table 1 illustrates the mixture design of the concrete sample, which is indicated in the coding [15].
| Cement (kg/m2) | Water (kg/m2) | Sand (kg/m2) | Gravel (kg/m2) | Micro silica (kg/m2) | Super plasticizer (kg/m2) |
|---|---|---|---|---|---|
| 420 | 105 | 945 | 635 | 65 | 10 |
Figure 3a–d shows changes in a concrete cube under compressive loading. Figure (a) illustrates the concrete cube prior to any loading being applied. The specimen is uncracked and utterly intact, with a regular structure at this stage. In Figure 3b as a second stage, the cube is subjected to a compressive force of 25 kN, which leads to changes in the initial deformations and stresses on the concrete structure. At this stage, some microcracks and hairline cracks appear on the surface of the concrete, but no significant changes in the overall structure have yet been observed. Considering the third stage, Figure 3c shows that as the loading increases to 50 kN, more cracks appear in the concrete, and parts of the internal structure under pressure begin to collapse. At this stage, the plastic behavior of the concrete becomes apparent, and stress concentration points are visible near the edges and corners of the cube. As a fourth stage, Figure 3d depicts the concrete's state with a loading of 70 kN, where there are more extensive fractures and some cracked concrete. At this stage, the concrete specimen has entered the critical failure zone, and its ultimate failure can be predicted.
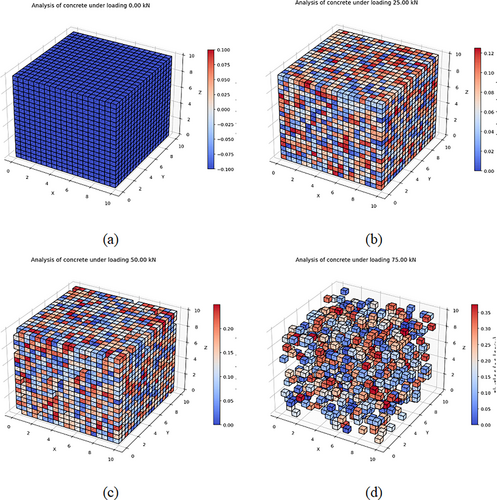
Figure 4 shows the compressive stress–strain curve of concrete. This figure describes the relationship between compressive stress and strain in a concrete specimen. First, the concrete is in the elastic phase, i.e., when the deformation of the concrete can be reversed with a decrease in strength. As the stress increases, the concrete enters the plastic region, where the deformations become permanent and initial cracks appear. The curve's peak indicates the concrete's maximum compressive strength, i.e., the most significant stress the specimen can withstand before extensive damage begins. After this point, the curve slopes downward, and a decrease in strength is observed. This is the progression of macrocracks. This curve generally shows the mechanical behavior of concrete under compressive loading and how it resists and fails.

3.1.2 Impact Lading Analysis of Concrete Cube Models
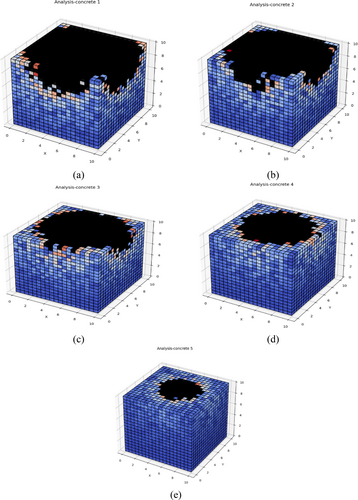
The impact force on a concrete cube specimen at various stages is depicted in Figure 5a–e The concrete cube before the impact, which has a strong and crack-free structure, and the moment of impact of a high-speed bullet (500 m/s) on the concrete surface are shown in figures (a) and (b) respectively. This impact concentrates the impact force at the impact point and imposes a strong stress on the concrete structure. At this stage, initial cracks begin to appear in the area around the contact point. As time passes and the shock wave propagates, cracks develop in different directions and parts of the concrete are destroyed. Figure 5e shows the widest failure area, indicating a high impact force on the concrete structure. This process shows how concrete behaves under sudden loading and how its weaknesses and failure mechanisms manifest themselves. Analysis of these images is important for understanding the failure mechanics of concrete and optimizing the impact resistance of concrete.
3.2 Regression Performance (Cubes)
3.2.1 Cube Regression Results
The training and testing data for cube regression's impact resistance are shown in Figure 6a,b and the X-test and X-train distribution, which includes such material as composition and impact conditions, is shown in Figure 6a. The dispersion of this data reflects the diversity of the training set, which helps improve the generalizability of the model. Figure 6b illustrates the y-test and y-train as dependent variables. A uniform distribution of target values is of great importance for the practical training of regression models. This emphasizes the consistency of training and test data and ensures that predictive models perform reliably in evaluating the behavior of concrete under impact loading.

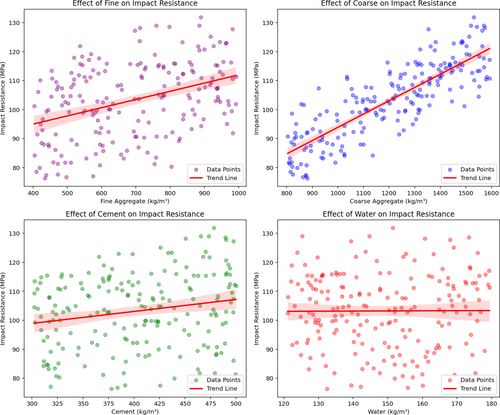
According to Figure 7, the effect of fine and coarse aggregates, cement, and water on impact strength has been analyzed. The figure of fine aggregates shows that when the number of aggregates increases, the impact strength also improves. In contrast, when the amount of coarse aggregate increases, the effect on impact strength is positive. According to Figure 7, the cement cover is a parameter for improving the impact coefficient, while in the water diagram, the reverse trend is observed. Increasing the amount of water reduces the impact strength because a high water-cement ratio leads to porosity in the concrete and a decrease in its density, which ultimately reduces its impact strength.
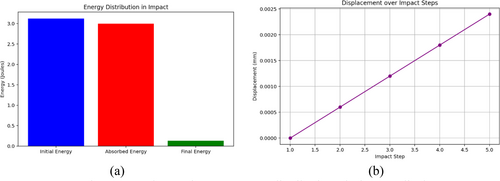
The energy production and displacement of a cubic concrete under impact loads are depicted in Figure 8a,b The amount of energy absorbed at different concrete areas following the bullet impact is displayed in Figure 8a As is clear, the impact is at the point where it is the highest, and with distance from this area, the amount of energy it receives decreases. According to this condition, some parts of the concrete that are not directly impacted absorb less energy than other parts. In Figure 8b the amount of displacement at different points of the concrete due to impact is shown. In this diagram, the displacement in the area close to the impact is very high, and with distance from this point, the deformation of the specimen decreases noticeably. This phenomenon shows that the central areas of the concrete, which absorb the most energy, crack and fail. Displacement analysis also shows that there are different energy absorption and stress distributions depending on the type of mix and reinforcement used. These findings can be used in the design of impact-resistant structures and the use of appropriate reinforcements to control displacement and failure of devices using receivers.
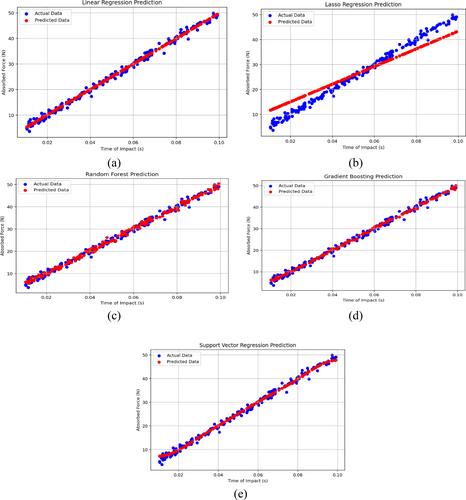
According to Figure 9a–e most forecast results have good predictions, with the predicted value and actual results being in line. Table 2 provides that the concrete absorbed energy is better for SVR regressions. According to results, the Lasso regression predicational value has a gap with actual values. Table 2 illustrated that the R2 is the maximum for linear regression, which has a less amount than lasso regression with 0.995 and d 0.91. The results of numerical simulations on the concrete cube model show that linear regression with a coefficient of determination (R2) of 0.995 and lasso regression with RMSE of 3.9 have the lowest accuracy, while random forest and gradient boosting models with R2 of 0.9991 and 0.2, 0.991 and 0.5, respectively, showed higher accuracy in predicting concrete cracks and failures. Also, the support vector regression (SVR) model had the best accuracy in predicting concrete failure with R2 0.994 and RMSE 1.01.
| Samples | R2 | RSME |
|---|---|---|
| Linear regression | 0.995 | 0.92 |
| Lasso regression | 0.91 | 3.9 |
| Random forest | 0.991 | 1.21 |
| Gradient boosting | 0.994 | 1.85 |
| Support vector regression | 0.994 | 1.01 |
In the current study's regression results, it is evident that the random forest model has a higher prediction accuracy of RMSE than SVR. The percentage of variance in the actual data that the model can account for is shown by the R2 score. A higher R2 value indicates that the model more accurately depicts the fundamental connection between the target attribute and the input variables. All of the regression models in Table 2 have respectably high R2 values, indicating that they are all effective in explaining the variance in the data. Better predictive accuracy is shown by lower RMSE values, which quantify the average magnitude of prediction mistakes.
3.3 Slabs Under Impact
3.3.1 Concrete Slab Results
Figure 10a–e illustrates how a concrete slab deforms at five different points in time following a bullet hit. The first step is depicted in Figure 10a, where the impact point shows the first deformation. Usually, this deformation is minimal since the initial force disperses throughout the slab's surface gradually. The second stage, shown in Figure 10b, shows an increase in displacement and a broader impact force effect on the slab surface. At this point, the concrete's internal pressure is rising, but no visible cracks have yet to appear. The slab's deformation increases, and critical stress zones are seen in Figure 10c–e, which correspond to the third, fourth, and fifth stages, respectively. The third stage shows the development of the first cracks and a rise in the maximum displacement at the impact location. According to the NaN value in the analyses, the fourth stage is characterized by an increase in fracture intensity and severe failure in certain places. In the fifth stage, the impact zone reaches its maximum expansion, and portions of the slab finally fail. This procedure finds crucial places of collapse and demonstrates how the concrete responds to abrupt stresses.
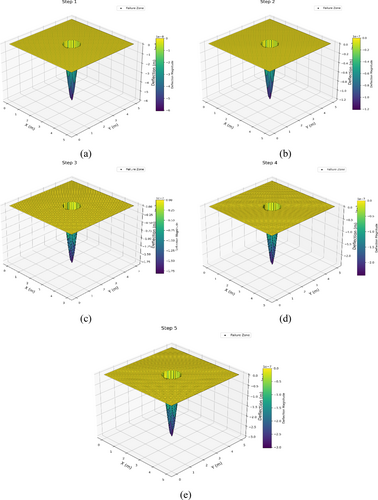
Figure 11 shows the load–displacement curve, which shows the relationship between the impact force and the deformation of the concrete slab over time. In the early stages, the curve shows that as the impact force increases, the displacement also increases incrementally. This behavior indicates the elastic stage of the concrete, where it is still within the range of reversible deformation. As the force increases, the curve becomes less steep, as the slab begins to deform and some of the absorbed energy is released as local fracture. Further along the diagram, points are observed where the displacement increases as it increases. This point indicates the failure of the concrete, where the internal stresses exceed the tensile strength and significant cracks are formed on the surface. After this stage, it reaches an almost horizontal state, which indicates that with increasing force, no significant deformation occurs and the structure is no longer able to absorb any more energy. This design is very important for analyzing the mechanical behavior of impact concrete, as it provides accurate information about its strength and ultimate limit.
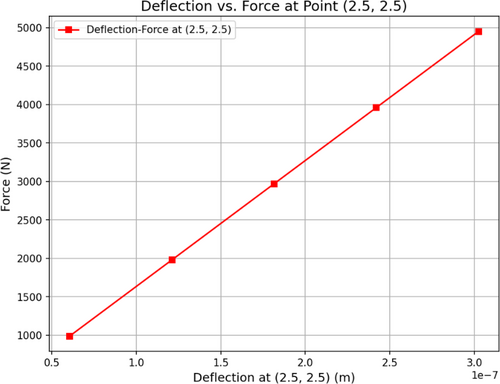
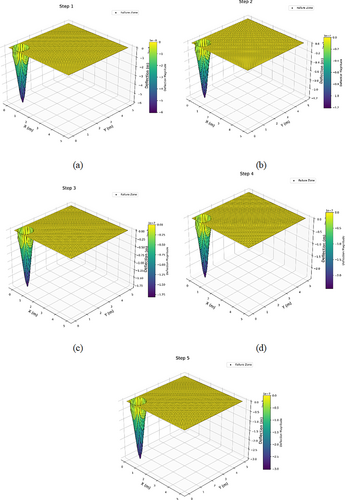
Figure 12a–e illustrates the deformation of a concrete slab at five time stages following the application of a load at the slab's center. Taking into account the failure state, displacement, and stress at impact, Table 3 shows the slab parameters with a bullet impact at 2.5 and 2.5 m coordinates at different time steps. In Figure 12a, which represents the first stage, the initial deformation can be seen at the loading site. This deformation is initially limited as the load is gradually distributed over the surface of the slab. In Figure 12b, which represents the second stage, the amount of displacement increases, and a larger area of the slab is affected by the applied force. At this stage, the internal stresses in the concrete increase, but no visible cracks have yet appeared.
| Time step | Displacement (mm) | Stress at impact point (MPa) | Failure condition |
|---|---|---|---|
| First step | 0.5 | 3.1 | None |
| Second step | 1.2 | 6.5 | Small cracks |
| Third step | 2.8 | 12.3 | Visible cracks |
| Fourth step | 5.4 | 18.9 | Severe damage |
| Fifth step | 8.7 | 24.5 | Complete failure |
In Figure 12c–e, which represent the third, fourth and fifth stages respectively, the amount of deformation increases and the critical stress points become more pronounced. In the third stage, the maximum displacement occurs at the center of the slab and the first surface cracks appear. In the fourth stage, the intensity of the cracks increases and the areas under high tensile stress are clearly damaged. Finally, in the fifth stage, parts of the slab experience extensive cracking and certain areas are completely destroyed. This process shows how the concrete behaves under concentrated loading and identifies the points where failure is most likely.
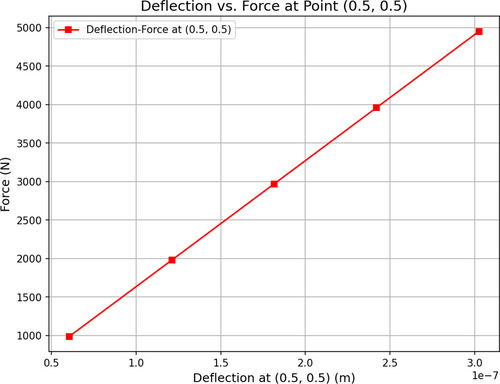
Figure 13 shows a load–displacement diagram for a concrete slab under a central load. The diagram shows the relationship between the applied force and the amount of deformation of the slab over time. Similarly, Table 4 shows the parameters of the impact factor in coordinate (0.5, 0.5) m while taking into account the failure state, displacement, and stress at impact. In the early stages, the diagram shows a linear increasing trend, indicating elastic behavior of the concrete, i.e., deformation occurs reversibly and the concrete has not yet failed or cracked. As the force increases, the diagram gradually becomes less linear and its slope decreases, indicating that the concrete is approaching its limit of nonlinear and plastic behavior. Later in the diagram, a critical point is seen where the deformation increases abruptly, indicating the onset of cracking and failure of the concrete. This point occurs when the internal stresses exceed the tensile strength of the concrete and significant cracks are formed in the slab. After this point, the graph reaches an almost flat state, meaning that no further deformation occurs with a further increase in force and the concrete is no longer able to absorb any more energy. This graph demonstrates the importance of analyzing the behavior of concrete under concentrated loading and identifies critical points of failure, which is very important for designing structures resistant to sudden and severe loads.
| Time step | Displacement (mm) | Stress at impact point (MPa) | Failure condition |
|---|---|---|---|
| First step | 0.4 | 2.9 | None |
| Second step | 1 | 5.8 | Minor deformation |
| Third step | 2.5 | 11.2 | Small cracks |
| Fourth step | 4.8 | 16.7 | Severe cracks |
| Fifth step | 7.9 | 22.1 | Significant failure |
In the concrete slab model, numerical analyses showed that the displacement of the slab under impact load increases in five-time steps. In the first step, the displacement at the impact point was 0.5 mm and reached 8.7 mm in the fifth step. Also, the stress at the impact point reached 24.5 MPa in the fifth step, which indicates complete failure of the slab. These results show that with increasing impact load intensity, displacements and failures in the slab increase significantly. Using these models allows engineers to design more resistant and optimal structures against impact loads. This research shows that machine learning models, especially random forest and gradient boosting, can provide accurate predictions of failures and cracks in concrete under impact loads and are useful tools for analyzing concrete behavior under dynamic and complex conditions. Table 5 shows the combined slab properties with various bullet impact coordinates ((2.5, 2.5) m and (0.5, 0.5) m) and time steps, taking into consideration the failure conditions, displacement, and stress at impact.
| Time step | Displacement (mm) | Stress at impact point (MPa) | Failure condition | |
|---|---|---|---|---|
| 2.5 m and 2.5 m coordinate | First step | 0.5 | 3.1 | None |
| Second step | 1.2 | 6.5 | Small cracks | |
| Third step | 2.8 | 12.3 | Visible cracks | |
| Fourth step | 5.4 | 18.9 | Severe damage | |
| Fifth step | 8.7 | 24.5 | Complete failure | |
| 0.5 m and 0.5 m coordinate | First step | 0.4 | 2.9 | None |
| Second step | 1 | 5.8 | Minor deformation | |
| Third step | 2.5 | 11.2 | Small cracks | |
| Fourth step | 4.8 | 16.7 | Severe cracks | |
| Fifth step | 7.9 | 22.1 | Significant failure |
4 Discussion
In this study, the behavior of concrete under impact loads has been analyzed using finite element modeling (FEM) and machine learning methods. The results show that the combination of numerical methods and machine learning can be a powerful tool for predicting the behavior of concrete under impact loads. Various regression models such as random forest and gradient boosting have shown high accuracy in predicting the crack path and failure behavior of concrete. This emphasizes that machine learning can be used as an effective tool in analyzing and predicting the behavior of materials under dynamic and impact loads. Different studies investigated concrete under impact loading. For example, [51] analyzed the reinforced concrete via steel fiber. They found that the volume of fiber can improve the impact resistance. The current study also emphasizes that elements such as aggregates in the concrete can help to improve the impact factor of concrete. Also, [52] simulated the cracking behavior of concrete under dynamic loading using the FEM method and showed that accurate modeling can lead to accurate predictions of failure behavior. In the present study, the use of the FEM method in the Python environment led to accurate predictions of crack paths and failure-prone areas. In recent years, machine learning techniques have been used to predict the mechanical behavior of materials, especially concrete. For example, in the studies of [53], machine learning algorithms are used to predict the compressive strength of concrete, and the results show that these methods can predict the strength of concrete with high accuracy. In the present study, regression models such as random forests and boosting trajectories are used to predict crack paths, and the results show the accuracy of these models in predicting crack behavior. Finally, this study emphasizes that finite element modeling accurately simulates the locations of cracks and fractures and is particularly important for analyzing the behavior of concrete under impact loads. These results can help design more flexible structures and improve the properties of materials against impact forces. Also, the combination of numerical modeling and machine learning can be used as an efficient tool in analyzing materials under complex loading conditions.
The aim of this study is to understand the behavior of concrete slab and cube under impact loading and bullet loading. Many other studies have a similar perspective to this experimental and numerical investigation. For example, airport runway is an important challenge for concrete slabs under impact loadings. Concrete, despite being able to withstand high compressive loads (up to 5620 kN, equivalent to the maximum weight of a large-capacity passenger aircraft), is vulnerable to tensile stress and shear force due to its brittle nature caused by microcracks and internal defects. This vulnerability can lead to cracking, subsidence, and the formation of potholes under the pressure of aircraft wheels or internal stresses caused by ground settlement, freezing, and thawing. If these early signs are not recognized in time and remedial measures are not taken, these damages will spread and cause large potholes, which negatively affect the smoothness of traffic, durability, and service life of the pavement [54]. According to studies, optimizing the design thickness of pavement structures and conducting regular and timely pavement assessments are some ways to increase the quality of concrete for runway pavements [55-58]. Reinforced concrete with different types of fibers, the use of 3D printed reinforced concrete, and the use of geopolymer concrete are some other ways to reduce impact loading problems on concrete runway slabs [4, 5, 15, 59].
Another important factor is defense against terrorist attacks against civilian structures, government facilities, embassies, and military installations [60]. This study can improve engineering understanding of impact loading for concrete cube and concrete slab. According to previous studies, adding fibers can improve the impact resistance of concrete, while conventional concrete has brittle failure after impact loading [61, 62]. Overall, this study can be a basis for improving FEM knowledge through programming with Python and understanding the behavior of concrete under impact; however, the limitation of this study is its small size and numerical study rather than experimental study.
5 Conclusions
In this study, slab and cube model simulations have been used to analyze the behavior of concrete under impact load. Different regression methods have been used to predict the behavior of these two concrete models. These methods are especially useful for predicting the path of cracks and failures of concrete under different impact load conditions. Both slab and cube models have been analyzed separately to obtain more accurate results for analyzing the behavior of concrete against dynamic forces. For the concrete cube model, various regressions such as linear regression, lasso, random forest, gradient boosting, and support vector regression (SVR) have been used. These models are specifically designed to predict failure and cracking in concrete cubes under impact load. Linear regression has been used to analyze the initial behaviors of concrete and has provided appropriate initial results. But in more complex situations, lasso regression using a penalty factor helps the model increase the accuracy of predictions and eliminate unhelpful features. More complex models such as random forest and gradient boosting have been used to model the behavior of concrete under impact loads. Random forest, which uses a set of decision trees for prediction, has been able to show high accuracy in predicting cracks and failures of concrete under impact loads. Gradient boosting, as an advanced model, has provided better performance in predicting cracks and failure behavior of concrete by gradually improving the predictions through boosting the results of the trees. For the concrete slab model, a different simulation was performed that considered the physical properties of the slab such as thickness, compressive strength, tensile strength, and Young's modulus. In this model, the analysis of the slab displacements under impact loads at different time steps was performed. Similar regressions were also used to predict cracks and failures in the slab. These models are particularly useful for analyzing critical points in the slab that are damaged by impact loading. These analyses help design structures that are more resistant to impact loads and optimize the use of admixtures.
Author Contributions
Mohammad Hematibahar: conceptualization, data curation, formal analysis, investigation, software, writing – original draft, writing – review and editing. Ahmed Deifalla: data curation, formal analysis, investigation, validation, visualization, writing – review and editing, writing – original draft. Adham E. Ragab: conceptualization, data curation, formal analysis, methodology, resources, funding acquisition, writing – original draft, writing – review and editing. Gebre Tesfaldet: data curation, formal analysis, writing – original draft, writing – review and editing, visualization, software, supervision.
Conflicts of Interest
The authors declare no conflicts of interest.
Open Research
Data Availability Statement
The data that support the findings of this study are available on request from the corresponding author. The data are not publicly available due to privacy or ethical restrictions.


