Enhanced Automatic Generation Control in Multiarea Power Systems: Crow Search Optimized Cascade FOPI-TIDDN Controller With Integrated Renewable Solar Thermal Models and HVDC Lines
ABSTRACT
As renewable energy sources (RES) are increasingly unified into multiarea power systems, automatic generation control (AGC) faces challenges such as frequency instability, longer settling times, and higher overshoot. While existing optimization techniques like Firefly (FF) and gray wolf (GW) suffer from slow convergence and local optima trapping, conventional controllers like FOPI, PIDN, TIDN, and TIDDN struggle to maintain stability under fluctuating load conditions. Fractional-Order Proportional-Integral with Tilt Integral Double Derivative and Filter (FOPI-TIDDN), a novel cascade controller optimized using the crow search (CS) algorithm, is proposed in this paper to overcome these issues. Furthermore, a two-area AGC framework incorporates realistic dish-Stirling solar thermal systems (RDSTS) and parabolic trough solar thermal plants (PTSTP), and the effects of these systems are examined under different patterns of solar insolation. Additionally, the study assesses how high voltage direct current (HVDC) tie-lines contribute to increased system stability. According to simulation data, the FOPI-TIDDN controller works noticeably better than others in terms of improved frequency regulation, faster settling time, and less overshoot. Compared to FF and GW approaches, the CS algorithm guarantees faster convergence. An ideal fixed-random solar insolation method and HVDC integration also improve system performance. The suggested method enhances renewable-integrated power systems' resilience, efficiency, and stability.
1 Introduction
Power systems (PS) experience abrupt fluctuations in demand that cause a disparity between generation and load, leading to frequency and power value variations. This can be mitigated by AGC [1]. The main goal of AGC is to establish a reliable control system that ensures a consistent frequency profile, and that can be achieved by effectively distributing power among generation and load sides. AGC aims to maintain stability by carefully managing the power flow [2, 3]. The single-area thermal works are foundation works and later expanded to multiarea systems [4]. Physical constraints like generation rate constraints (GRC) and time delays are considered [4, 5]. An AGC analysis on a multiarea thermal system encompassing hydro and gas units is studied by Parmar et al. [6].
The gradual decline in fossil fuel use and increased CO2 emissions have led to the use of renewable sources (RS). The idea of RS inclusion in AGC studies was first introduced in [7]. The most advanced methods can boost energy conversion efficiency while lowering their adverse environmental effects [8]. The RS is dominated by solar-wind energies [9]. The AGC study incorporating solar PV was presented by Bervani et al. [7]. The solar grid connection with thermal was demonstrated by Wang et al. [8]. The frequency parameter of a fusion inaccessible system with a parabolic trough collector-based solar thermal plant (PTSTP) was investigated by Das et al. [9], and its control strategy was demonstrated by Sharma et al. [10]. The concept of a dish-stirling solar thermal system (DSTS) with various solar insolations was presented by Rahman et al. [11]. Li et al. [12-14] suggested the narrow-speed operation of SCIG with energy devices for frequency regulation. Nonetheless, the PTSTP and RDSTS are not considered with conventional generation considering various types of solar insolation.
A rise in population causes a sharp increase in systems demand and can be overcome by interarea PS [15]. Also, an enhancement in interarea power transfer capability is necessary to accommodate the systems growing demand and this can be compensated by HVDC [16]. HVDCs offer effective power transfer capabilities and can be placed with existing systems [17, 18]. The AGC focus has historically been on two areas and further facilitates multiarea PS control. Moreover, the multiarea AGC studies with RDSTS and PSTSP integration, considering HVDC, have not been carried out.
There has been a significant emphasis on the secondary controller design in AGC. This focus led to the advance of secondary controllers. Classical IO controllers like I, PI, PID [19]; fractional such as FOPI and FOPID [20]; cascade such as FOPI − (1 + TD) [21], FOPID − (1 + TD) [22], fuzzy-IDD [23]; fuzzy-PID [24]; tilt controllers [25, 26]; adaptive fuzzy [27]; deep neural networks [28]; degree of freedom (DOF) controllers [29]; sliding mode [30] and so on, have been successfully implemented for the AGC study. A new cascade controller named FOPI-TIDDN has not been studied under AGC; thus, providing scope for further investigations.
To improve the AGC performance, various optimization techniques have been implemented. Conventional and heuristic algorithms optimize controller gains. Traditional techniques like gradient search and random search stick at local optima, and heuristic techniques like bacterial foraging [4, 23], genetic [5, 9], gray wolf [10], biogeography [11], sine-cosine [31], firefly [19, 32], flow direction [21], teaching learning [25], cuckoo search [29], flower pollination [33], barnacle optimizer [34], adopting jaya optimizer [35], global neighborhood algorithm [36], particle swarm [37, 38], salp swarm [39, 40], stochastic fractal search [41], Aquila [42], dragon fly [43] and learner behavior [44] provide global optima. A recent technique named crow search (CS) [45] works with the brainy behavior of crows, such as face recognition, tool usage, food search, effective communication, and so on. However, the CS technique is not utilized for the FOPI-TIDDN controller optimization.
- To demonstrate the effect of PTSTP and RDSTS with thermal systems.
- To apply the CS algorithm to optimize controller parameters in PIDN, TIDN, and FOPI-TIDDN controllers.
- To study the effect of various solar insolations.
- Convergence comparison with gray wolf, firefly, and proposed CS technique.
- To validate the impact of the HVDC.
1.1 Novelty and Contributions
- Evaluation performance of RDSTS and PTSTP in a two-area thermal system (TATS).
- Designing a new FOPI-TIDDN controller for AGC studies of TATS.
- Performance of thermal-RES system with a combination of various solar insulations.
- Utilization of CS algorithm for synchronized enhancement of RDSTS parameter and FOPI-TIDDN controller.
- A study was conducted in a TATS considering RDSTS and PTSTP.
- A new controller termed FOPI-TIDDN was proposed by integrating RDSTS and PTSTP.
- RDSTS and controller parameters are successfully optimized by the CS technique for the first time.
- Efforts are made to analyze the impact of RDSTS and PTSTP at various solar insolations.
2 System Description
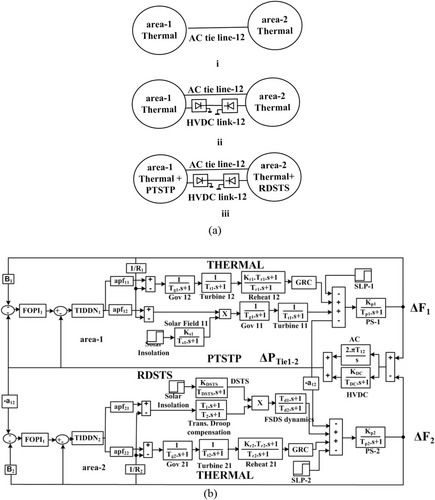
Investigations were carried out on a system with a capacity of 1:4 comprising thermal-RES units with HVDC integration. Area-1 comprises the PTSTP unit, and area-2 comprises RDSTS units with fixed and random solar insolations. The nominal values of the RDSTS, thermal, PTSTP, and HVDC tie-line models are from [4, 12, 23], respectively. The study and transfer function models of the investigated two-area systems comprising thermal, RDSTS, PTSTP, and HVDC units are in Figure 1a,b, respectively.
3 The Proposed FOPI-TIDDN Controller

4 Crow Search (CS) Algorithm
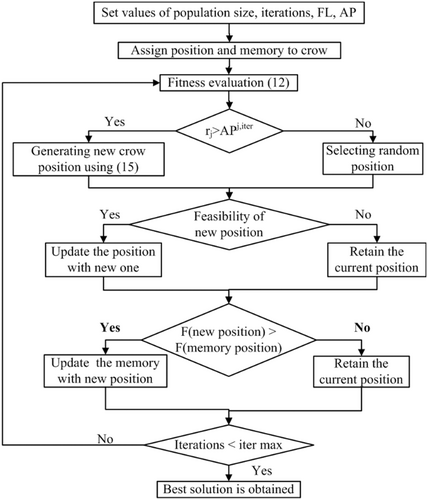
Two possibilities occur in food search:
Crow-q does not recognize that crow-p is subsequent, and its walloping place is given by Equation (6).
5 Simulation Results
The two-area thermal system with RDSTS, PTSTP, and HVDC lines considering CS optimized FOPI-TIDDN controller is regarded for the investigations and is in Figure 1b.
5.1 System Dynamics With PIDN, TIDN, and FOPI-TIDDN Controllers
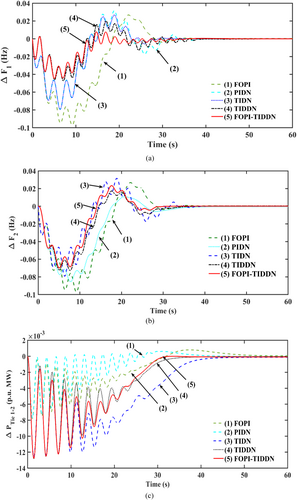
Figure 1a (i) with thermal units are considered and are provided with secondary controllers like FOPI [8], PIDN [19], TIDN [25], TIDDN [41], and FOPI-TIDDN. Their values are simultaneously augmented using CS and are in Table 1a. The system dynamics corresponding to every controller are illustrated in Figure 4. The performance indices are listed in Table 1b. With the keen observation of the numerical values in Table 1b, and from Figure 4, it is apparent that the responses with the proposed FOPI-TIDDN controller outperform other controllers.
| With FOPI controller | KP1 = 0.8547 | KI1 = 0.4758 | λ1 = 0.9978 | KP2 = 0.4751 | KI2 = 0.8757 | λ2 = 0.9785 |
|---|---|---|---|---|---|---|
| With PIDN controller | KP1 = 0.5161 | KI1 = 0.6383 | KD1 = 0.7868 | N1 = 10.6597 | KP2 = 0.3299 | KI2 = 0.0936 |
| KD2 = 0.1096 | N2 = 21.9706 | |||||
| With TIDN controller | KT1 = 0.6514 | n1 = 3.5842 | KI1 = 0.5812 | KD1 = 0.9150 | N1 = 19.5652 | KT2 = 0.1096 |
| n2 = 6.3435 | KI1 = 0.2622 | KD2 = 0.3299 | N2 = 45.8975 | |||
| With TIDDN controller | KT1 = 0.5674 | n1 = 4.7824 | KI1 = 0.7584 | KDD1 = 0.7584 | N1 = 99.1425 | KT1 = 0.4157 |
| n1 = 7.5416 | KI1 = 0.8324 | KDD1 = 0.9745 | N1 = 65.7412 | |||
| With FOPI-TIDDN controller | KP1 = 0.6661 | KI1 = 0.7542 | λ1 = 0.9856 | KT1 = 0.3567 | n1 = 3.5647 | KI1 = 0.9652 |
| KDD1 = 0.9364 | N1 = 36.4585 | KP2 = 0.4578 | KI2 = 0.7745 | λ2 = 0.9981 | KT2 = 0.7714 | |
| n2 = 6.0125 | KI2 = 0.5378 | KDD2 = 0.4463 | N2 = 57.2450 |
| Response | Controller | Settling time (s) | Peak overshoot | Peak undershoot (−ve) |
|---|---|---|---|---|
| ΔF1 | FOPI [8] | 45 | 0.042 | 0.099 |
| PIDN [19] | 42 | 0.040 | 0.0965 | |
| TIDN [25] | 38 | 0.027 | 0.0965 | |
| TIDDN [41] | 36 | 0.026 | 0.0800 | |
| FOPI-TIDDN | 34 | 0.025 | 0.0794 | |
| ΔF2 | FOPI [8] | 44 | 0.024 | 0.090 |
| PIDN [19] | 42 | 0.022 | 0.085 | |
| TIDN [25] | 40 | 0.016 | 0.072 | |
| TIDDN [41] | 36 | 0.0154 | 0.070 | |
| FOPI-TIDDN | 32 | 0.010 | 0.068 | |
| ΔPtie1-2 | FOPI [8] | 47 | 0.002 | 0.0130 |
| PIDN [19] | 45 | 0.002 | 0.0128 | |
| TIDN [25] | 42 | 0.001 | 0.0127 | |
| TIDDN [41] | 40 | 0.001 | 0.0125 | |
| FOPI-TIDDN | 38 | 0.001 | 0.0124 |
5.2 System Dynamics With Random Load Pattern (RLP) Considering PIDN, TIDN, and FOPI-TIDDN Controllers
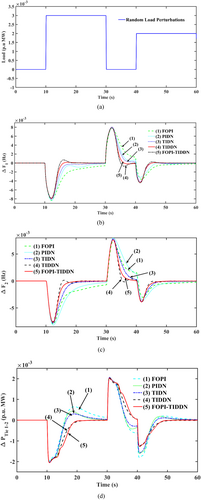
The controllers in Section 5.1 are utilized for the study with RLP in Figure 5a CS technique optimizes the gains and is in Table 2. Responses with RLP are plotted in Figure 5b–d. Upon thorough examination of system dynamics in Figure 5b–d, it is evident that dynamics with FOPI-TIDDN controller exhibit superior performance compared to those of other controllers.
| With FOPI controller | KP1 = 0.5538 | KI1 = 0. 4596 | λ1 = 0. 9217 | KP2 = 0. 9234 | KI2 = 0. 2781 | λ2 = 0. 2623 |
| With PIDN controller | KP1 = 0. 1942 | KI1 = 0. 6356 | KD1 = 0. 2471 | N1 = 34.5782 | KP2 = 0. 8327 | KI2 = 0. 2927 |
| KD2 = 0. 3896 | N2 = 21.9706 | |||||
| With TIDN controller | KT1 = 0.6514 | n1 = 5.7245 | KI1 = 0. 9516 | KD1 = 0. 6341 | N1 = 98.9601 | KT2 = 0. 2172 |
| n2 = 4.4097 | KI1 = 0. 6767 | KD2 = 0.9004 | N2 = 64.5482 | |||
| With TIDDN controller | KT1 = 0. 4446 | n1 = 6.0502 | KI1 = 0. 2908 | KDD1 = 0. 1325 | N1 = 83.2482 | KT1 = 0. 9261 |
| n1 = 3.7603 | KI1 = 0. 0381 | KDD1 = 0. 1804 | N1 = 32.4983 | |||
| With FOPI-TIDDN controller | KP1 = 0. 8324 | KI1 = 0. 3016 | λ1 = 0. 9613 | KT1 = 0. 6624 | n1 = 5. 3426 | KI1 = 0. 7410 |
| KDD1 = 0. 979 | N1 = 68.5478 | KP2 = 0. 5863 | KI2 = 0. 8082 | λ2 = 0. 9504 | KT2 = 0. 4864 | |
| n2 = 5. 9058 | KI2 = 0. 2331 | KDD2 = 0. 8948 | N2 = 29.6547 |
5.3 Comparisons of Convergence Characteristics Among Algorithms Like Firefly, Gray Wolf, and CS
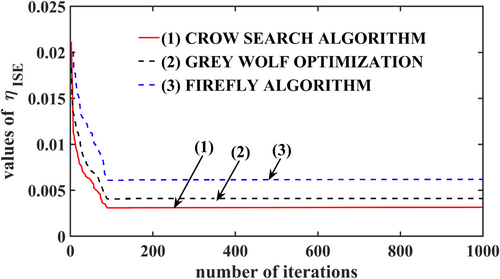
The unequal thermal system is considered to examine the convergence characteristics of CS, firefly [29] and gray wolf [4] techniques. The FOPI-TIDDN values are augmented by the algorithms mentioned above and are in Table 3, and their respective convergence features are in Figure 6. In Figure 6, the convergence curves of firefly [29] and gray wolf [4] are produced and analyzed with CS. The ηISE values of every algorithm are examined, and it is witnessed that CS has a lower ηISE value. Critical observations expose the system with the CS technique converging over firefly and gray wolf algorithms.
| With firefly [29] | KP1 = 0.5686 | KI1 = 0.5648 | λ1 = 0.8956 | KT1 = 0.4500 | n1 = 4.2150 | KI1 = 0.2180 |
| KDD1 = 0.5018 | N1 = 65.1245 | KP2 = 0.7789 | KI2 = 0.6485 | λ2 = 0.9978 | KT2 = 0.9601 | |
| n2 = 5.1245 | KI1 = 0.3345 | KDD2 = 0.9013 | N2 = 21.0356 | |||
| ISE = 0.006 | ||||||
| Simulation Time = 284 s | ||||||
| With gray wolf [4] | KP1 = 0.4856 | KI1 = 0.8945 | λ1 = 0.8555 | KT1 = 0.7580 | n1 = 4.2105 | KI1 = 0.5241 |
| KDD1 = 0.6645 | N1 = 84.0125 | KP2 = 0.8820 | KI2 = 0.7456 | λ2 = 0.8585 | KT1 = 0.5463 | |
| n2 = 5.8231 | KI1 = 0.7814 | KDD2 = 0.8798 | N2 = 66.1470 | |||
| ISE = 0.004 | ||||||
| Simulation Time = 255 s | ||||||
| With CS | KP1 = 0.8521 | KI1 = 0.7845 | λ1 = 0.7425 | KT1 = 0.3567 | n1 = 3.5647 | KI1 = 0.9652 |
| KDD1 = 0.9364 | N1 = 36.4585 | KP2 = 0.7845 | KI2 = 0.5485 | λ2 = 0.9142 | KT1 = 0.0.7714 | |
| n2 = 6.0125 | KI1 = 0.5378 | KDD2 = 0.4463 | N2 = 57.2450 | |||
| ISE = 0.0028 | ||||||
| Simulation Time = 240 s | ||||||
5.4 Selection of Performance Indices
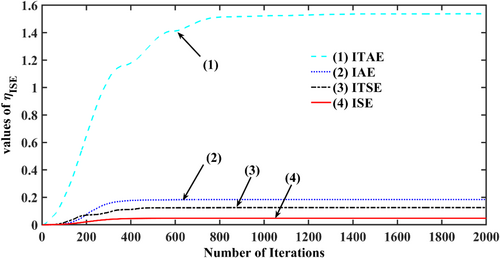
System in Section 5.2 is considered and is provided with the best controller from Section 5.1 (FOPI-TIDDN) and the best algorithm from Section 5.2 (CS). CS optimizes the controller gains with ISE, ITSE, IAE, and ITAE as performance indices, considering one at a time, and responses are plotted in Figure 7. Results suggest that ISE exhibits better convergence with fewer error values over other indices.
5.5 Integration of HVDC
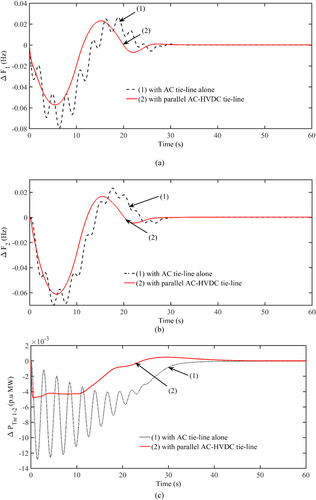
Figure 1a (ii) considers the unequal thermal system unified with the HVDC and FOPI-TIDDN controller. The CS technique augments its gains. Table 4 lists optimum values and their responses are related to the AC system in Figure 8. From Figure 8, the dynamics with AC-HVDC clearly show their prominence over the AC tie-lines. Further, an interconnected HVDC system enhances system dynamics significantly. This improvement is because HVDC tie-lines are less susceptible.
| With AC-HVDC tie-lines | KP1 = 0.7584 | KI1 = 0.3213 | λ1 = 0.9875 | KT1 = 0.4723 | n1 = 7.0251 | KI1 = 0.6211 |
| KDD1 = 0.7347 | N1 = 20.1521 | KP2 = 0.9952 | KI2 = 0.4252 | λ2 = 0.9685 | KT1 = 0.2116 | |
| n2 = 6.4990 | KI1 = 0.8469 | KDD2 = 0.4351 | N2 = 64.1150 |
5.6 System Dynamics Under Various Patterns of Solar Insolation Considering RES
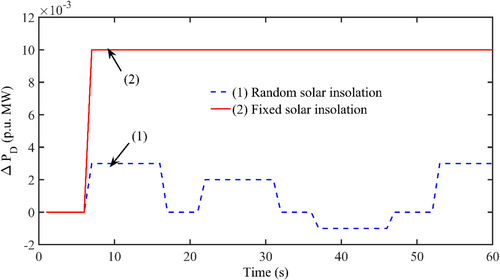
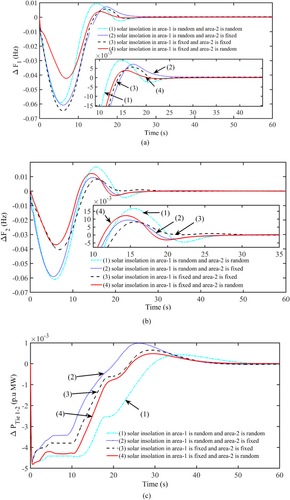
The unequal thermal-HVDC system is unified with RS like PTSTP and in area-1, 2, which are taken for investigation and are in Figure 1a (iii). The area participation factors (apf)s of RES-thermal systems are chosen as 0.45 and 0.55, respectively. The input for PTSTP and RDSTS is intermittent solar insolation in Figure 9.
The thermal-RES system is exposed to various groupings of insolations:
Case (a): Random and random.
Case (b): Random and fixed.
Case (c): Fixed and fixed.
Case (d): Fixed and random.
The FOPI-TIDDN controller is used, and CS augments its gains and RDSTS parameters in the above combinations and its values in Table 5. The corresponding dynamics with various combinations of solar insolations are compared in Figure 10 and show that the solar insolation combination of fixed and random in area 1–2 exhibits a better response than others.
| Case (a) | KP1 = 0.6585 | KI1 = 0.1245 | λ1 = 0.9978 | KT1 = 0.5945 | n1 = 5.1205 |
| KI1 = 0.8140 | KDD1 = 0.7015 | N1 = 85.1240 | KP2 = 0.8852 | KI2 = 0.4578 | |
| λ1 = 0.9978 | KT2 = 0.5012 | n2 = 3.2451 | KI2 = 0.4385 | KDD2 = 0.3104 | |
| N2 = 60.4503 | |||||
| Case (b) | KP1 = 0.6645 | KI1 = 0.4512 | λ1 = 0.8879 | KT1 = 0.5680 | n1 = 5.4102 |
| KI1 = 0.2478 | KDD1 = 0.7820 | N1 = 64.0528 | KP2 = 0.7845 | KI2 = 0.4532 | |
| λ2 = 0.8952 | KT1 = 0.4780 | n2 = 2.5478 | KI2 = 0.4196 | KDD2 = 0.4578 | |
| N2 = 22.4587 | |||||
| Case (c) | KP2 = 0.6598 | KI2 = 0.4561 | λ2 = 0.4532 | KT1 = 0.2300 | n1 = 1.2450 |
| KI1 = 0.8174 | KDD1 = 0.8174 | N1 = 25.4710 | KP2 = 0.4578 | KI2 = 0.3212 | |
| λ2 = 0.9978 | KT2 = 0.3201 | n2 = 4.1250 | KI1 = 0.5410 | KDD2 = 0.1208 | |
| N2 = 34.7809 | |||||
| Case (d) | KP2 = 0.7832 | KI2 = 0.5821 | λ2 = 0.9965 | KT1 = 0.6478 | n1 = 5.1240 |
| KI1 = 0.1820 | KDD1 = 0.1047 | N1 = 88.4510 | KP2 = 0.6585 | KI2 = 0.4856 | |
| λ2 = 0.9899 | KT2 = 0.1780 | n2 = 4.1205 | KI1 = 0.4580 | KDD2 = 0.3019 | |
| N2 = 18.2045 |
5.7 Impact of Renewables
The effect of RES, such as a PTSTP and RDSTS in area-1, 2, on the system dynamics is examined. The finest solar insolation combinations (fixed and random) are delivered to the RS units. The thermal-RS system with an FOPI-TIDDN controller and the CS technique optimizes its gain parameters. The attained values with CS are noted in case (d) and its dynamics are shown in Figure 11.
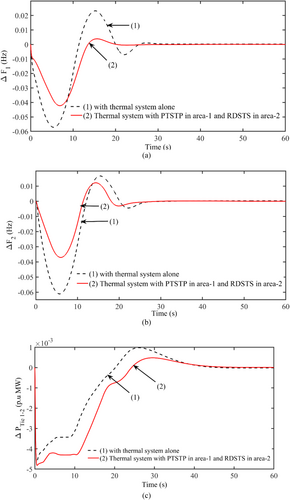
The effect of RES, like PTSTP and RDSTS integration, is highly noticeable when contrasted in a thermal system. Figure 11 shows that integrating the system with RES indicates a significant oscillation reduction.
5.8 Sensitivity Analysis
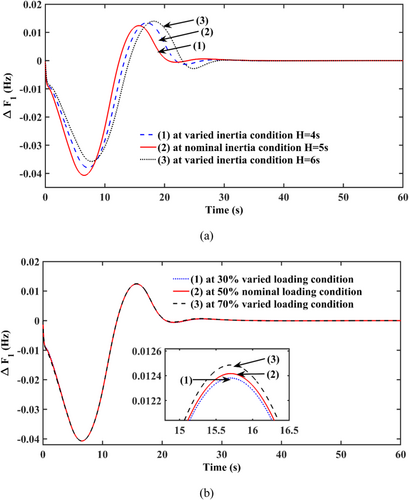
The thermal-RES system with FOPI-TIDDN with CS optimization is considered. Investigations are performed at ± 20% varied inertia and loading conditions and plotted in Figure 12. It is pragmatic that the FOPI-TIDDN controller exhibits almost the same responses.
5.9 Stability Analysis
The thermal-RES-HVDC system with FOPI-TIDDN controller in Figure 1b is investigated for stability analysis by considering eigenvalue analysis. The input and output of each significant block in Figure 1b are under consideration and represented as state variables. Investigations are performed by considering “linmod” function in MATLAB. The obtained eigenvalues are noted in Table 6. It is apparent that eigenvalues are located on the left half of the s-plane. Also, the proposed system is supported by the negative values of the imaginary and real eigenvalues.
| −0.00137 + 0.000i | −1.5100 + 0.000i | −50.000 + 0.000i | −46.100 − 2.2700i |
| −0.00169 + 0.000i | −2.5700 + 0.000i | −56.400 + 0.000i | −47.700 + 4.060i |
| −0.00481 + 0.000i | −3.3300 + 0.000i | −100.00 + 0.000i | −47.700 − 4.060i |
| −0.00500 + 0.000i | −3.8800 + 0.000i | −111.00 + 0.000i | −50.100 + 4.880i |
| −0.00593 + 0.000i | −9.0100 + 0.000i | −390.00 + 0.000i | −50.100 − 4.880i |
| −0.3330 + 0.000i | −12.500 + 0.000i | −1000.0 + 0.000i | −52.800 + 4.350i |
| −0.5560 + 0.000i | −28.000 + 0.000i | −0.2080 + 0.0001i | −52.800 − 4.350i |
| −0.7310 + 0.000i | −31.600 + 0.000i | −0.2080 + 0.0001i | −55.100 + 2.400i |
| −1.0000 + 0.000i | −45.500 + 0.000i | −46.100 + 2.2700i | −55.100 − 2.400i |
6 Conclusion
A novel method has been obtained using the grouping of fixed-random insolation in a thermal-renewable system. The cascade FOPI-TIDDN controller is used for the first time, and its gain RDSTS parameters are optimized using a novel CS algorithm. System dynamics with the FOPI-TIDDN controller outperform FOPI, PIDN, TIDN, and TIDDN in performance indices. CS optimizes controller gains with a better convergence rate over cuckoo search and particle swarm techniques. Also, studies reveal that the FOPI-TIDDN controller with ISE shows better dynamics over other performance indices. Investigations reveal that insolations of fixed random in area-1 and 2 are the best over other combinations for renewable systems. Moreover, the effect of renewable in combination with AC-HVDC has been evaluated and assessed for two-area thermal systems. Sensitivity analysis suggests that the proposed FOPI-TIDDN controller is robust. Further, stability analysis suggests that the considered system is stable. Furthermore, this work can be extended to realistic scenarios.
Nomenclature
-
- AGC
-
- automatic generation control
-
- CS
-
- crow search
-
- FF
-
- firefly
-
- FOPI-TIDDN
-
- Fractional-Order Proportional-Integral With Tilt Integral Double Derivative and Filter
-
- GRC
-
- generation rate constraints
-
- GW
-
- gray wolf
-
- HVDC
-
- high voltage direct current
-
- PS
-
- power systems
-
- PTSTP
-
- parabolic trough solar thermal plants
-
- RDSTS
-
- realistic dish-stirling solar thermal systems
-
- RES
-
- renewable energy sources
Author Contributions
Naladi Ram Babu: conceptualization, methodology, writing – review and editing. Pamarthi Sunitha: investigation, validation, writing – original draft. Ganesh Pardhu B. S. S.: investigation, validation, formal analysis. Sanjeev Kumar Bhagat: methodology, visualization, formal analysis. Adireddy Ramesh: validation, data curation, resources. Arindita Saha: visualization, formal analysis, resources. Wulfran Fendzi Mbasso: writing – review and editing, project administration, supervision. Pradeep Jangir: supervision, validation, visualization. Ahmed Hossam-Eldin: writing – review and editing, project administration, supervision.
Conflicts of Interest
The authors declare no conflicts of interest.
Appendix A: System Nominal Parameters
System Model: F = 60 Hz; Kpj = 120 Hz/pu MW; loading = 50%, Tjk, AC = 0.086 pu MW/rad; Dj = 8.33 × 10⁻³ pu MW/Hz; Hj = 5 s; Rj = 2.4 pu MW/Hz; Bi = βj = 0.425 pu MW/Hz; Tpj = 20 s; apf11 = apf21 = apf31 = 0.45; apf12 = apf22 = apf32 = 0.55; SLP = 1%; a12 = −Pr1/Pr2 = −1000/4000 = −1/4; a23 = −Pr2/Pr3 = 4000/8000 = −1/4; a31 = −Pr3/Pr1 = 8000/1000 = −8/1.
Thermal System: Tgj = 0.08 s; Ttj = 0.3 s; Trj = 10s; Krj = 0.5 s.
Parabolic Trough Collector Base Solar Thermal Plant: Ks = 1.8; Ts = 1.8 s; Tgsj = 1.0 s; Ttsj = 3.0 s.
High-Voltage Direct Current: KDC = 0.5; TDC = 0.03 s.
Crow Search Technique: Flight length = 0.2, Awareness Probability = 0.1, flock size = 50, iteration size = 100.
Open Research
Data Availability Statement
The data that support the findings of this study are available from the corresponding author upon reasonable request.


