Research on the Bending Mechanical Properties of Laminated Glass Panels Under Concentrated Loads
Funding: This study is funded by the Henan Province Science and Technology Research Project (242102240035); Doctoral Research Start-up Fund Project of Nanyang Institute of Technology (NGBJ-2024-17); supported by Interdisciplinary Sciences Project, Nanyang Institute of Technology (24NGJY013), which are gratefully acknowledged.
ABSTRACT
In order to study the mechanical properties of glass panel structures applied to automotive bridge decks, this paper conducted bending tests on glass bridge decks under wheel loads. The experiment applied a concentrated load to the center of the plate, with displacement as the control condition for loading. This process was repeated until all layers of the glass plates were completely destroyed. The out-of-plane deflection displacement field of the laminated glass plate under lateral load was obtained using the three-dimensional Digital Image Correlation (DIC) method. The results indicate that the load–displacement relationship of laminated glass panels exhibits a certain degree of nonlinearity. Compared with the load displacement curve of a three-layer glass structure, the load displacement variation of a two-layer glass structure is significantly closer to linear. The load–displacement variation of a two-layer glass structure is significantly closer to linear compared to that of a three-layer glass structure. The direction of the maximum principal stress almost coincides with the diagonal of the glass plate and only shows significant fluctuations under small loads. The load–stress relationship exhibits certain nonlinear characteristics. By conducting experimental research on three-layer laminated glass panels subjected to local lateral loads, the static mechanical response law of multilayer laminated glass bridge decks under wheel pressure loads was explored. The experimental results can provide a reference for engineering practice.
1 Introduction
Laminated glass panels are widely used in glass curtain walls, viewing platforms, walkways, bridges, etc. of high-rise buildings or natural scenic spots. The viewing platforms suspended at high altitudes are supported by glass panels and metal frames, mainly bearing crowd loads. Compared with traditional concrete car decks, car glass decks can utilize the transparency of glass materials to achieve natural lighting, thereby achieving energy-saving effects. Compared with the steel grid axle pavement, the glass bridge deck has both transparency and avoids cascading of rain and dirt [1]. Unlike building glass curtain walls used for enclosure, the glass panels on the bridge deck of overpasses or walkways mainly bear the load of crowds in addition to their own weight and wind and snow loads, and their safety level requirements are higher. The corresponding stress analysis should be different from the design methods of ordinary building glass. However, it should be noted that regulation [2] is designed for ordinary building glass, which is mainly used as a maintenance component. For bridge deck glass used as load-bearing components, the safety level requirements are higher, so it is still debatable whether it is reasonable to directly apply the design method of building glass. Compared to standard [2], regulation [3] has added a calculation method for using glass as a load-bearing floor slab, and Wang Zongyi et al. [4] have also studied the mechanical properties of laminated glass used as bridge deck panels, but the applied loads are still limited to uniformly distributed loads. Wang Xun [5] provided analytical expressions for stress and deformation of simply supported plates under uniformly distributed loads. Wang Yuanqing [6-9] equated in-plane bending glass plates to beam plates simply supported or fixed on both sides, and pointed out that the bearing capacity of in-plane bending glass plates is directly proportional to the plate thickness and height-span ratio and inversely proportional to the span-height ratio. Liu Qiang [10] analyzed the bending performance of laminated glass beams under short-term and long-term loads. Yin Yongwei and Zhang Qilin [11] conducted experimental studies on the short-term and long-term load performance of point-supported hollow and laminated glass under uniformly distributed loads. Zhang Yangmei [12] and Zhang Zongheng [13] respectively conducted experimental studies on the failure modes of multilayer SGP laminated glass and PVB [14] laminated glass under rigid body impact and low-speed impact. Tao Zhixiong et al. [15] found that the load–displacement curve of simply supported laminated glass under static load is close to linear distribution. Farzad Ebrahimi [16] analytical model based on Euler–Bernoulli beam theory, used to investigate the dynamic behavior of sigmoid and power-law graded nanoscale beams under the influence of piezoelectric, thermal, and electrical effects. An analytical model combining nonlocal elasticity theory and size-dependent effects is used to investigate the influence of non-uniform temperature distributions on the vibration and buckling behaviors of inhomogeneous and size-dependent beams [17]. Through a combined approach of experimental and numerical simulation methods, the mechanical properties, nonlinear bending behavior, and instability characteristics of 3D-printed auxetic tubular metastructures were studied in detail. Multiscale finite element and Ritz methods were employed for theoretical analysis and validation [18]. Current research mainly focuses on theoretical calculations of glass plates under uniformly distributed loads and concentrated loads. In vehicular bridges, the load is vehicle wheel pressure, which cannot be equated to uniformly distributed loads, and existing analytical solutions for uniformly distributed and concentrated loads cannot be used. To withstand vehicle wheel pressure, the number of layers of tempered laminated glass must be further increased, which causes the interlayer material to participate in the overall plate stress, making the basic assumptions of the classic equivalent thickness design method no longer valid. Therefore, the currently recommended equivalent thickness [19] method is no longer applicable.
Based on the research results of industrial and civil architectural glass floors and pedestrian landscape bridge panels, this paper conducted a study on the failure modes and bearing capacity of vehicular glass bridge panels under wheel pressure at the ultimate state; it explored the combined effects and influencing mechanisms of vehicular laminated glass bridge panels, which have significant theoretical innovation and engineering application value for the technical feasibility of applying glass bridge panels to vehicular traffic.
2 Method for Testing the Bending Performance of Laminated Glass Panels
2.1 Test Piece Design and Production
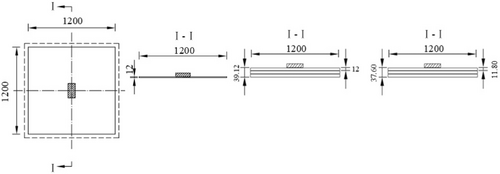
The quality of the glass panel specimens in this study was homogenized in accordance with the requirements of “Safety Glazing Materials in Buildings – Part 2: Tempered Glass” (GB 15763.2-2005) [20]. The edges were mechanically ground and chamfered, with a chamfer width of 5 mm (horizontal) × 3 mm (thickness). Specimens measuring 1200 mm × 1200 mm were prepared. The PVB interlayer thickness between each layer of glass in the middle was 1.1 mm. Single-layer glass specimens were also prepared as control experiments [21, 22]. The specific detailed parameters and specimen numbers for each group are illustrated in Figure 1 and listed in Table 1.
| Type | Specifications/ mm | Number | Quantity/ Lock |
|---|---|---|---|
| Adhesive glass | 11.8 mm tempered glass + 1.1 mmPVB + 11.8 mm tempered glass + 1.1 mmPVB + 11.8 mm tempered glass | JG001-JG003 | 3 |
2.2 Loading Scheme and Measuring Point Layout
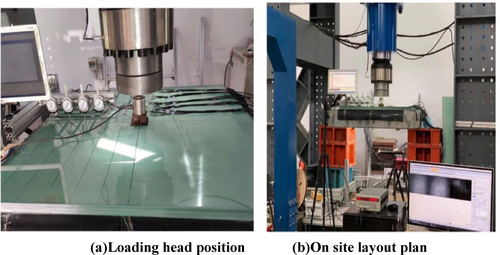
The glass panel specimens were placed on a specially designed steel support frame, with a support width of 3 cm on each side. The steel support frame was positioned on a rigid concrete floor via four steel pedestals. Through the investigation and analysis of the wheel weights and tire dimensions of mainstream vehicle models, it was determined that the load generally does not exceed 30 kN, meaning the maximum single-wheel load is 7.5 kN. The contact area between the tire and the ground is elliptically distributed, but for ease of calculation, it was simplified to a rectangular shape. The contact area is proportional to the total weight of the vehicle and the width of the tire. The ground contact dimensions of the wheel (c × d) were determined to be 100 mm × 200 mm. A rubber pad was arranged between the center of the glass panel specimen and the press machine to simulate the vehicle tire, with the test machine's pressure acting on the glass panel specimen through the rubber pad. To prevent direct contact between the glass panel specimen and the steel support frame, which could alter the test boundary conditions, PVC spacers were placed at the contact points.
The test loading equipment was a microcomputer-controlled electro-hydraulic servo pressure testing machine, employing a monotonic graded loading mode. The loading mode varied according to different batches of tests, and the test loading setup [11] is shown in Figure 2 The test involved applying a localized concentrated load to the center of the panel, with displacement as the control condition. The loading rate was set at 2.4 mm/min, with each 2 mm increment constituting a loading stage up to 4 mm to ensure the glass panel was fully stressed. Subsequently, each 1 mm increment served as a stage to densify data collection. After each loading stage, a 10-s pause was required for TDS (Test and Data System) strain collection. This process was repeated cyclically until all layers of the glass panel were completely damaged.
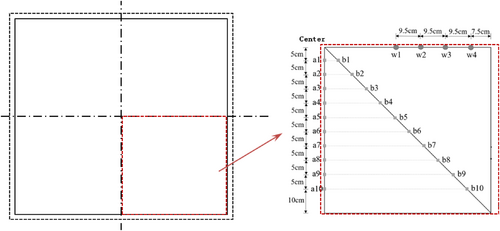
The experiment utilized electromechanical dial gauges and resistance strain gauges to measure the deflection of the glass panel and the strain on the outer surface of the glass panel, respectively. Both deflection and strain data were collected using a TDS-302 static data acquisition instrument. The study focused on the bending performance of laminated panels; hence, the strain measurement points were densely arranged. Starting from the geometric center of the panel, 10 strain measurement points were equally spaced along the side length and diagonal directions of the panel, with 20 strain rosettes correspondingly connected to 60 data channels for strain collection. Additionally, four displacement measurement points were set along the other side length direction of the panel. The specific locations of the measurement points are illustrated in Figure 3.
3 Result Analysis
To investigate the displacement of laminated glass under bending, the experiment selected three pieces of laminated glass, designated as JG001, JG002, and JG003. Under the condition of simply supported on all four edges, a localized concentrated load was applied incrementally at the center of the panels. For specimen JG001, the load was applied until the bottom layer of glass cracked, then unloaded to zero before reloading. For specimens JG002 and JG003, after the bottom layer of glass cracked, the load was not removed but continued to be applied under the original loading state.
3.1 Analysis of Failure Modes and Causes
Specimen JG001, upon reaching the ultimate load of 47.8 kN, produced a dull “bang” sound, and the bottommost layer of glass instantly developed radial, slender crack failures, while the middle and top layers remained intact. The state of the quarter bottom and top surfaces at this moment is shown in Figure 4a,b.
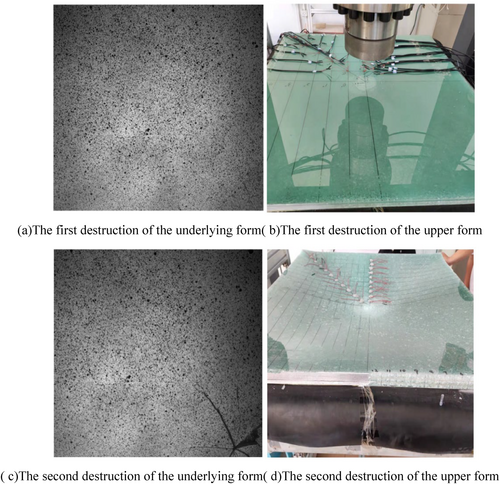
After unloading and reloading, when the load reached the ultimate load of 36.3kN, a sharper “bang” sound was heard, the entire panel's corners curled up, and the middle and top layers also failed. At this point, the cracks in the bottom glass were noticeably thicker and more numerous, while the top layer of glass instantly shattered into small, uniformly distributed fragments, with radial cracks as the skeleton and dense circular cracks dividing it into a dense cobweb pattern, significantly finer and denser than the lower glass, as shown in Figure 4c,d.
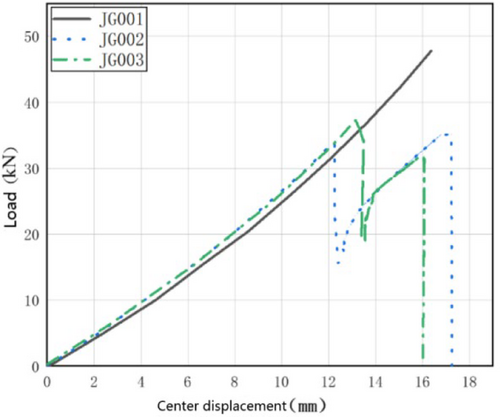
Specimens JG002 and JG003 also produced a dull “bang” sound upon reaching their ultimate loads of 34.2 and 37.3 kN, respectively, with the bottommost layer of glass instantly developing radial, slender crack failures, while the middle and top layers remained intact. After a brief continuation of loading, JG002 reached 35.3 kN and the middle and top layers also failed, while JG003 reached 31.4 kN and the middle layer failed but the top layer remained intact.
The sectional stiffness calculated according to the code is shown in Table 2. The reason for the phased failure is that the combined stiffness of the three-layer laminated glass is large, more than three times that of a single layer of glass, resulting in smaller deformations under the same load. When the hydraulic press applied the ultimate load to the three-layer laminated glass, the displacement was still relatively small. After the bottom layer of glass failed and lost its load-bearing capacity, the remaining two layers of glass and the PVB interlayer combined to bear the load. Since the combined stiffness of the two-layer glass structure is smaller, the extension of the hydraulic head at this point produced a smaller load on the remaining two-layer glass structure, not reaching its failure limit; hence, only the bottommost layer of glass ruptured in the first stage of loading [12]. As the loading continued and the displacement increased, the remaining two layers of glass then failed.
| Number of glass plate layers | Three layers | Double-deck | One layer |
|---|---|---|---|
| Equivalent thickness (mm) | 17.0 | 14.9 | 11.8 |
| Outer face stiffness (kN/mm) | 30,807 | 20,538 | 10,269 |
3.2 Load Displacement Curve Analysis
The ultimate loads for the first failure of JG001, JG002, and JG003 were 47.8, 34.2, and 37.3 kN, respectively, with maximum deflections of 16.37, 12.24, and 13.14 mm. The ultimate loads for the second failure were 36.3, 35.3, and 31.4 kN, respectively, with maximum deflections of 16.13, 16.14, and 16.22 mm. It is noteworthy that after the initial panel failure of the specimens, if they were reloaded, their out-of-plane stiffness also underwent a corresponding reduction, as illustrated in Figure 5.
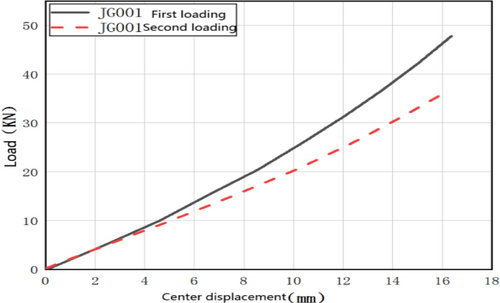
The summary of the load–displacement tests is presented in Table 3. Here, Fmax represents the ultimate load at first failure; dt is the corresponding maximum deflection; F′max denotes the ultimate load at second failure; d′t is the second maximum deflection; and Dt stands for the average spring stiffness at mid-span.
| Specimen number | Fmax/kN | dt/mm | F′max/kN | d′t/mm | Dt/N/m |
|---|---|---|---|---|---|
| J001 | 47.81 | 16.37 | 36.33 | 16.13 | 3.16 × 10⁶ |
| J002 | 34.24 | 12.24 | 35.31 | 16.14 | 2.97 × 10⁶ |
| J003 | 37.33 | 13.14 | 31.44 | 16.22 | 3.10 × 10⁶ |
Before the first failure, the load displacement curve actually showed a certain degree of nonlinearity. As the load and deflection increased, the slope of the curve gradually increased, indicating that its stiffness was constantly increasing. This nonlinearity is largely related to the nonlinear characteristics of the PVB adhesive layer, and its material properties were experimentally studied during the second failure. It is worth noting that the load displacement curve of the two-layer glass structure is significantly closer to linear, so the nonlinearity of the three-layer glass structure may be related to the number of glass layers. The fitting parameters for the load displacement curve are shown in Table 4.
| Specimen number | Quadratic term coefficient/a | Primary term coefficient/b | Constant term coefficient/c | Fits/R2 |
|---|---|---|---|---|
| JG001 | −0.00270 | 0.46837 | 0.07348 | 0.99986 |
| JG002 | −0.00253 | 0.44415 | 0.01503 | 0.99998 |
| JG003 | −0.00277 | 0.45947 | −0.13408 | 1.00000 |
Before the first failure, the load–displacement curve actually exhibits a certain degree of nonlinearity. As the load and deflection increase, the slope of the curve gradually rises, indicating that its stiffness is continuously increasing. This nonlinearity is largely related to the nonlinear characteristics of the PVB interlayer. It is noteworthy that the load–displacement curve of the two-layer glass structure is significantly closer to linearity; hence, the nonlinearity of the three-layer glass structure may be related to the number of glass layers. The fitting parameters for the load–displacement curve are presented in Table 4.
When specimens JG002 and JG003 reached the ultimate state, after the first layer of the panel failed, the displacement loading continued, and the load-deflection path of the specimens is shown in Figure 6. Compared to JG001, the load-bearing capacity of the specimens after the initial layer failure dropped sharply, indicating that under the condition of unchanged central deflection, the stiffness of the two-layer panel was significantly reduced compared to the three-layer panel. If the displacement loading continued, the load curve continued to increase, suggesting that the failed panel had a high secondary strength.
3.3 Shift Distribution
Digital Image Correlation (DIC) is a noncontact optical measurement technique widely used in materials science, mechanics, and engineering fields. With advantages such as noncontact measurement, full-field measurement, high precision, broad applicability, real-time monitoring, three-dimensional measurement capability, and rich data output, DIC has become an indispensable tool in the study of mechanical properties and materials research.
To clearly observe the failure state of the specimen, a uniformly distributed speckle pattern was created on the specimen surface, as shown in Figure 4a,c. The DIC device was employed to monitor the mechanical performance development process and failure morphology of laminated glass under out-of-plane local loading. The image acquisition system utilized two Gig E interface cameras with CMOS sensors, each with a resolution of 4112 × 3008 pixels and a lens focal length of 25 mm. Two 38 W LED strip lights were used to illuminate the specimen surface to enhance exposure. The camera acquisition rate was set to 1 frame per second, and a total of 600 consecutive frames were captured during the shear key push-out process. The digital cameras were triggered by an external signal to ensure synchronization between each frame and the pressure signal. The load–displacement values corresponding to each image were obtained using the MTS instrument data acquisition system. Subsequently, the VIC-3D software was used for post-processing to derive the displacement and strain data on the specimen surface.
The out-of-plane deflection displacement field of laminated glass panel specimens under transverse load is illustrated in Figure 7. The variation of out-of-plane displacement with loading for different panels was obtained using the three-dimensional DIC method. A comparison revealed that the center deflection of the panel measured by DIC differed by only 0.1 mm from the displacement gauge data, ensuring good accuracy. As can be seen from Figure 8, the displacement at the center of the panel is the largest and decreases toward the periphery, with the contour lines of equal displacement distributed in a ring shape, and the spacing between each contour line is almost uniform. Therefore, the displacement from any point on the edge of the panel to the center approximates a linear distribution. As can be seen from Figures 7 and 8, the ultimate displacement values of specimen JG001 before secondary failure are relatively consistent. The displacement points of the first failure are concentrated at the load application point, while the displacement points of the second failure are also around the load application point but exhibit a ring-shaped distribution. Furthermore, by comparison, the distribution range of the ultimate displacement line for the second failure is larger than that of the first failure displacement line.
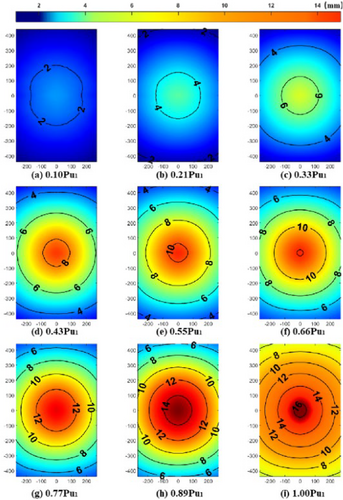
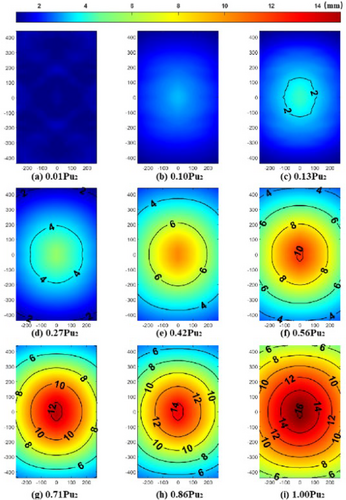
From the figure, it can also be observed that when the load is smaller and closer to the center of the plate, the contour lines of equal displacement tend to be more circular. In contrast, under larger loads and closer to the edges of the plate, the shape of these contour lines more closely resembles that of simply supported boundaries, appearing as rounded rectangles. The ultimate displacement at the second stage of specimen failure is significantly greater than that at the first stage. The displacement fields of specimens JG002 and JG003 during the entire process of secondary failure are similar, as shown in Figure 9.
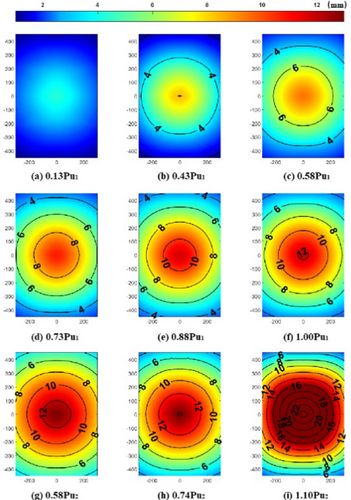
According to the DIC measurement results, when a triple-layer glass panel is subjected to transverse loading, the interlayer panels fracture in a brittle manner, with the bottom panel failing first. This imparts a certain degree of ductility to the laminated glass panel, thereby enhancing its mechanical performance. In terms of load-bearing capacity, after the failure of the bottom panel, the laminated glass panel retains its load-bearing capability, with the residual capacity being close to that of the original panel. However, the displacement field increases significantly at this stage. This indicates that increasing the number of glass layers does not significantly improve the overall strength of the laminated panel but can effectively enhance its out-of-plane stiffness.
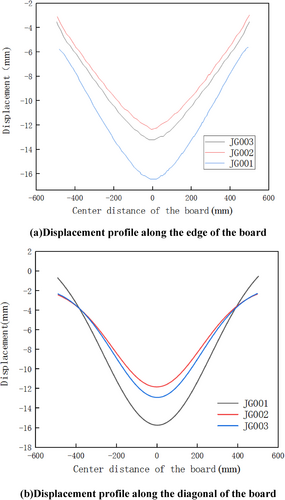
To investigate the distribution of displacement during the bending deformation of the glass panel, displacement profiles of the laminated glass under ultimate load were plotted along two directions: one parallel to the panel edges passing through the centroid of the panel surface, and the other along the diagonal direction, as shown in Figure 10a,b. The entire panel surface exhibits a symmetrically distributed curved deformation, with the center of the panel, being the loading point, naturally experiencing the maximum displacement. Along the direction parallel to the panel edges, the overall displacement increases with higher load values. In contrast, along the diagonal direction, the displacement at the center increases with higher loads, while the displacement near the corners of the panel decreases. This is due to the warping of the four corners of the panel under the ultimate load.
3.4 Bending Stress Analysis
In Equations (1) and (2), is the maximum principal stress, is the minimum principal stress, is the maximum principal strain, is the minimum principal strain, is the strain in the unit direction, and is the direction of the principal strain.
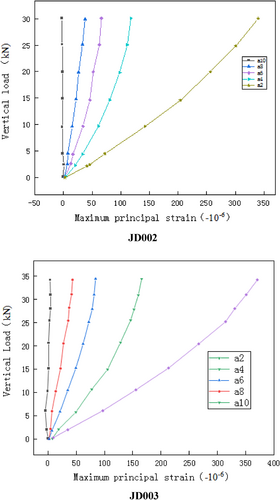
By selecting even-numbered points along the a1–a10 direction (i.e., the direction parallel to the plate edge), the load-strain curve can be obtained, as shown in Figure 11. Based on this strain data, the load-stress curve is calculated and presented in Figure 12.
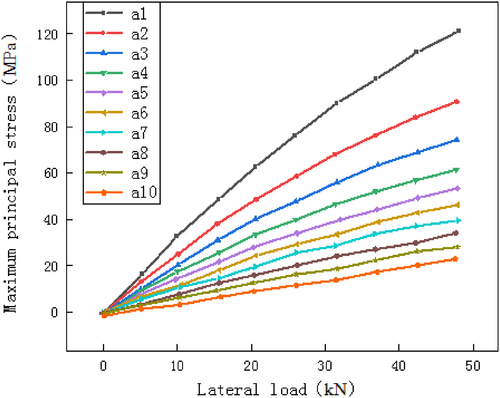
From the load-stress curve, it can be observed that the points closer to the edge of the plate (a10) exhibit a more pronounced linear relationship between load and stress, while the points near the center of the plate (a1) demonstrate a certain degree of nonlinearity. Additionally, the maximum principal stress decreases from the center of the plate toward the edges.
The angles between the direction of the maximum principal stress and the directions of a1–a10 are shown in Table 5 (taking specimen JG002 as an example). It is evident that the smaller the applied load and the closer the point is to the edge of the glass plate, the more pronounced the angle fluctuations become. Overall, the pattern is relatively consistent. The angles predominantly fluctuate around 0°, with most fluctuations within 8°. When the load is between 20 kN and the ultimate load, the fluctuation values are almost all within 3°, essentially converging to 0°. There is reason to believe that the direction of the maximum principal stress aligns with the direction of the measurement line, which also conforms to the symmetry of the geometric force distribution in the glass plate.
| Load/kN | a0 | a1 | a2 | a3 | a4 | a5 | a6 | a7 | a8 | a9 |
|---|---|---|---|---|---|---|---|---|---|---|
| 4.50 | 3.46 | 2.04 | 4.07 | 3.06 | −3.56 | 0.63 | −4.73 | −7.2 | −8.20 | −9.5 |
| 9.70 | 3.15 | 0.88 | 2.38 | 1.94 | −2.28 | 0.81 | −3.60 | −6.02 | −7.16 | −8.43 |
| 14.75 | 2.33 | 0.42 | 1.41 | 1.80 | −2.27 | 1.40 | −2.71 | −5.56 | −6.36 | −7.16 |
| 19.85 | 1.23 | −0.21 | 0.76 | 1.54 | −2.51 | 1.41 | −2.29 | −4.76 | −4.90 | −6.58 |
| 25.05 | 0.29 | −0.08 | 0.46 | 1.47 | −2.29 | 1.44 | −2.18 | −4.34 | −3.46 | −5.74 |
| 30.01 | −0.33 | −0.21 | 0.06 | 1.51 | −2.16 | 1.39 | −1.84 | −3.87 | −2.72 | −5.71 |
The direction of the maximum principal stress is shown in Table 6. Its angle almost coincides with the diagonal, with noticeable fluctuations only under small loads. When the load exceeds 5 kN, the deviation from the diagonal is almost always within 4°, generally slightly below 45°. This is due to a slight offset in the loading position and the relatively large area of the strain gauge, which causes the actual stress calculation point to not precisely align with the measurement point. Based on the geometric symmetry of the glass plate, it can be concluded that the maximum principal stress aligns with the diagonal direction of the glass plate.
| Load/kN | a0 | a1 | a2 | a3 | a4 | a5 | a6 | a7 | a8 | a9 |
|---|---|---|---|---|---|---|---|---|---|---|
| 4.50 | −43.65 | −47.89 | −41.17 | −42.33 | −37.88 | −44.67 | −39.95 | −40.33 | −48.35 | −39.05 |
| 9.70 | −43.23 | −48.43 | −41.59 | −42.31 | −39.28 | −44.85 | −40.79 | −41.62 | −44.83 | −43.46 |
| 14.75 | −43.54 | −39.62 | −42.03 | −42.73 | −40.36 | −44.91 | −41.33 | −42.14 | −45.07 | −44.00 |
| 19.85 | −43.74 | −40.82 | −42.54 | −43.08 | −41.12 | −44.79 | −41.85 | −42.45 | −45.10 | −43.79 |
| 25.05 | −43.56 | −42.10 | −42.92 | −43.41 | −41.67 | −44.61 | −42.20 | −42.85 | −45.12 | −43.80 |
| 30.01 | −43.46 | −43.07 | −43.21 | −43.62 | −42.15 | −44.63 | −42.37 | −43.05 | −43.88 | −43.80 |
It is evident that the closer to the center of the plate, the greater the compressive stress, and the load–stress relationship exhibits certain nonlinear characteristics. However, it is clear that the stress is not the smallest at the point closest to the corner of the plate. As can be seen from the figure, the closer to the corner of the plate, the slower the stress decreases, and there is even a slight increase at the edge. This recovery in stress value is largely due to stress concentration caused by the support near the edge of the plate. The ultimate load, stress, deformation, and other indicators of each glass plate are summarized in Table 7.
| Specimen number | Fmax/kN | dt/mm | σt max/MPa | Dt/N/m | F′max/kN | d′t/mm | Df/Nm |
|---|---|---|---|---|---|---|---|
| JG001 | 47.8 | 16.37 | 90.07 | 3.15950 × 10⁶ | 36.3 | 16.13 | 3.0807 × 10⁴ |
| JG002 | 34.2 | 12.24 | 75.53 | 2.96535 × 10⁶ | 35.3 | 16.14 | 3.0807 × 10⁴ |
| JG003 | 37.3 | 13.14 | 66.05 | 3.10055 × 10⁶ | 31.4 | 16.22 | 3.0807 × 10⁴ |
4 Conclusion
- Before the first failure of laminated glass, the load–displacement curve actually exhibits a certain degree of nonlinearity. As the load and deflection increase, the slope of the curve gradually rises. This nonlinearity is largely related to the nonlinear characteristics of the PVB interlayer.
- The load–displacement curve of the two-layer glass structure is significantly closer to linearity compared to the three-layer glass structure. Therefore, the nonlinearity of the three-layer glass structure may be related to the number of glass layers. The displacement at the center of the plate is the largest and decreases toward the periphery. The iso-displacement lines are distributed in a ring shape, and the intervals between each iso-displacement line are almost uniform. Therefore, the displacement from any point on the edge of the plate to the center of the plate is approximately linear.
- The direction of the maximum principal stress almost coincides with the diagonal of the glass plate, with noticeable fluctuations only under small loads. The closer to the center of the plate, the greater the compressive stress, and the load–stress relationship exhibits certain nonlinear characteristics. However, the closer to the corner of the plate, the slower the stress decreases, and there is even a slight increase at the edge. This rebound in stress value is largely due to stress concentration formed near the edge support of the plate.
Author Contributions
Tang Peng: conceptualization, methodology, software, project administration, resources, writing – original draft, writing – review and editing, investigation, funding acquisition, validation. Gong Sai: data curation, supervision.
Acknowledgments
This study is funded by the Henan Province Science and Technology Research Project (242102240035); Doctoral Research Start-up Fund Project of Nanyang Institute of Technology (NGBJ-2024-17); supported by Interdisciplinary Sciences Project, Nanyang Institute of Technology (24NGJY013), which are gratefully acknowledged.
Conflicts of Interest
The authors declare no conflicts of interest.
Open Research
Data Availability Statement
Research data are not shared.


