GPU-Accelerated Lattice Boltzmann Simulations of Power-Law Non-Newtonian Fluid Flow in a Diagonally Driven Cavity Using D3Q27 MRT-LBM
ABSTRACT
The study examines the flow dynamics of power-law non-Newtonian fluids in a cubic cavity with a top lid-driven diagonally-driven diagonally using the D3Q27 multiple-relaxation-time (MRT) lattice Boltzmann method (LBM). This situation frequently occurs in both natural and industrial processes. Utilizing CUDA C++ programming on a graphics processing unit (GPU) speeds up the simulations, enabling effective investigation of intricate fluid dynamics. Non-Newtonian behaviors, such as shear-thinning and shear-thickening properties, are frequently found in many real-world fluid systems and are captured by the power-law rheology model. LBM provides a mesoscopic method that makes handling intricate geometries easier and scales effectively on GPUs and other parallel computing architectures. The simulations investigate how Reynolds numbers () and power-law indices () affect non-Newtonian fluid flow characteristics like streamlines, velocity profiles, viscosity distributions, iso-surfaces, and helicity (twistiness). GPU acceleration makes faster simulations and parametric research possible, improving computational efficiency. These findings provide information for non-Newtonian fluid engineering applications in the food industry, biomedical engineering, and polymer processing. Because of their decreased viscosity, shear-thinning fluids have higher helicity than shear-thickening fluids. The numerical results of the study offer applicable standards for evaluating 3D codes for fluids with non-Newtonian power laws. The uniqueness is that a D3Q27 multiple-relaxation-time lattice Boltzmann method (MRT-LBM) framework with GPU acceleration can be used to model an underexplored situation, revealing fluid dynamics and rheological features with unprecedented detail and computing efficiency. We also examine how the power-law index influences vortex generation, helicity, and flow stability in a diagonally driven cavity. Additionally, a comparison of the D3Q19 and D3Q27 MRT-LBM models is provided, emphasizing how they handle complex fluid behaviors differently.
1 Introduction
Investigating non-Newtonian fluid fluxes in constrained geometries is crucial for biomedical engineering, food production, and polymer processing. Complex rheological behaviors, including shear-thinning and shear-thickening, are observed in non-Newtonian fluids. Intensive modeling of these unique characteristics is necessary to depict flow dynamics accurately. Lid-driven cavity flow problems have long been benchmark cases in computational fluid dynamics (CFD) due to their simple geometries and capacity to reveal intricate flow characteristics, such as vortices, recirculation zones, and secondary flow patterns. Newtonian or two-dimensional (2D) models of non-Newtonian fluids have been implemented in most research. Non-Newtonian fluids frequently exhibit three-dimensional (3D) fluxes in intricate configurations in real life. The movement of the diagonal lid in a cubic chamber complicates the flow by introducing shear interactions and 3D phenomena that have not been completely investigated.
Lattice Boltzmann methods (LBMs) have garnered much interest because of their computational efficiency and versatility in simulating complex fluid dynamics phenomena. In various flow scenarios, the D3Q27 multiple-relaxation-time (MRT) LBM has proven to be an effective tool for simulating non-Newtonian fluid behavior. The D3Q27 multiple-relaxation-time lattice Boltzmann method (MRT-LBM) was developed based on research by Guo et al. [1] and Lallemand and Luo [2], which showed that it could effectively capture fluid dynamics while resolving numerical instabilities related to the single-relaxation-time (SRT) model. This approach has been widely used to simulate Newtonian fluid flows, and it has recently been shown to work with non-Newtonian fluids as well. Chen and Shu's research [3] demonstrated how well simplified LBM can simulate power-law non-Newtonian fluids, which behave in shear-thinning or shear-thickening ways. With their emphasis on straightforward geometries and boundary conditions (BCs), these investigations shed light on non-Newtonian fluids' rheological and flow characteristics. The studies by Kuznic et al. [4] demonstrated the significant acceleration achieved by graphics processing unit (GPU) computing in LBMs, paving the way for large-scale simulations and parametric studies. Numerous scholars have conducted substantial analyses on 3D lid-driven cavity flows over time, using the LBM. For instance, in 2002, d'Humieres et al. [5] conducted 3D simulations of lid-driven cavity flow using D3Q15 and D3Q19 models at Reynolds numbers of 500 and 2000.
Tang et al. [6] devised a LBM using D3Q19 on non-uniform meshes along with curvilinear coordinates to explore 3D vortex flows within a lid-driven cavity numerically. Their simulations accurately forecasted the flow patterns, aligning well with established literature. Hedayat et al. [7] delved into lid-driven cavity flows of strain-hardening fluids and their LBM-based simulation. They observed that heightened strain-hardening behavior in the fluid is anticipated to reduce the size of corner vortices. Toghaniyan et al. [8] investigated spinodal decomposition phenomena and the LBM to simulate two-phase thermal flows. They concluded that as the droplets fell on the heated wall, the rising and falling trends of the isothermal lines within the drop decreased as the Rayleigh number increased, bringing them to equilibrium. The 3D central moment LBM, augmented with forcing terms, underwent scrutiny by Premnath and Banerjee [9]. Their investigation revealed that, under diffusive scaling, the method maintained second-order grid convergence. Using MRT-LBM, Samanta et al. [10] scrutinized transport phenomena in differentially heated lid-driven cavities. They noted an increase in the average value of concerning and at a constant . Zhuo et al. [11], using the MRT-LB method, investigated numerically the bifurcation of cavity flow driven by four lids, deeming the solution stable based on quickly diminishing below with modest variations around this threshold. Dong et al. [12] simulated viscous flow in a 3D lid-driven cavity under various inflow angles utilizing D3Q19 LBM with on-site BCs. Their study concluded that both Reynolds number and inflow angle influence the flow pattern within a lid-driven cavity. Perumal [13] utilized the LBM to simulate laminar flow within a 3D two-sided lid-driven cubical cavity, revealing that, for 3D parallel wall motion, a pair of counter-rotating secondary vortices emerges alongside two primary vortices. To simulate NEPCM melting in an inclined elliptical annulus, Jourabian et al. [14] used the enthalpy-based LBM. They discovered that injecting nanoparticles is the most efficient way to increase the liquid percentage in the oblate annulus since this improves conduction heat transfer.
Thohura et al. and Hossain and Molla [15, 16] explored the mixed convection flow of power-law fluids within a lid-driven cavity. They observed that maximum heat transfer occurs with dilatant fluids and noted the sensitivity of the heat transfer rate to the power-law index. In a separate investigation, Thohura et al. [17] conducted numerical simulations of non-Newtonian power-law fluid flow in a lid-driven skewed cavity. They observed that for cases where and , the primary vortex center shifts toward the upper right corner with increasing . Sikdar et al. [18] studied the lid-driven cavity with power-law fluids for various lengths of top lid movement. They found that increasing beyond a critical value switches the flow regime from one primary vortex to two primary vortices, with this vital value dependent on the values of and . Mendu and Das [19] analyzed power-law fluid flow in a cavity driven by two facing lids' motion using LBM, observing that as increases, the effect of lid motion extends beyond the lid. However, the power-law index does not affect the velocity at the cavity core. The study by Akbar et al. [20] examined the improvement of heat transmission and thermal storage using hybrid Jeffrey nanofluid flow in ducts under peristaltic motion with entropy creation. They discover that when a hybrid nanofluid is present, the flow rate and Brinkmann number both help to increase entropy creation. Gangawane et al. [21] numerically simulated mixed convection in heated semi-circular lid-driven cavities for non-Newtonian power-law fluids, concluding that the average Nusselt number decreases with increasing in all cases. Mahmood et al. [22] conducted a CFD analysis of nonlinear power-law material characterization in a channel-driven cavity with a square cylinder, finding that as the power-law index increases, the velocity profile becomes more distinct, as evidenced by cut lines in different configurations. Tizakast et al. [23] investigated the effect of Lewis number on mixed double-diffusive convection in shallow rectangular cavities with double-lid-driven boundaries filled with non-Newtonian power-law fluids, predicting that fluid flow, heat, and mass transfer characteristics remain insensitive to increases in aspect ratio. Shear thinning nanofluid was thermally synthesized in a tiny flexible vessel-type channel with low seepage Reynold number and nanoparticles by Akbar et al. [24]. The heat transfer and the mass transfer rate showed the opposite pattern as the Reynold number of seepage, , increased.
Bisht and Patil [25] conducted simulations of non-Newtonian laminar fluid flow, focusing on 2D power-law modeled non-Newtonian fluid flow in driven cavities with undulated bottom walls using MRT-LBM. They observed that the flow structure became increasingly complex with higher Reynolds numbers at steady-state in the case of shear-thinning fluids. Several notable investigations have explored the behavior of 3D non-Newtonian power-law fluids in lid-driven cavities. Jin et al. [26] analyzed the 3D flow of power-law fluids in a cubic cavity driven by shear from the top wall, implementing their study on GPU. Their simulations revealed steady flows and exhibited non-Newtonian behavior in velocity profiles, viscosity distributions, and streamlines. The numerical study of the pseudopotential lattice Boltzmann modeling of liquid-vapor for multi-phase flows was conducted by Nemati et al. [27]. The study demonstrates that the force term inclusion approach and the inter-particle interaction force term scheme are essential for precise and reliable results. Chowdhury and Kumar [28] investigated the unsteady behavior of non-Newtonian fluid flow in a two-sided lid-driven cavity at various aspect ratios, uncovering multiple flow patterns for different Reynolds numbers and times. These patterns often involved combining two primary vortices to form a single cat's eye vortex, followed by the generation of secondary vortices. Adam et al. [29] developed a 3D cascaded LBM on the D3Q19 lattice to simulate non-Newtonian power-law fluids. Their model demonstrated improved numerical stability compared with the SRT-LBM, suggesting promising results for complex 3D non-Newtonian fluid flows. Safdari and Kim [30] investigated the simulation of solid particle behavior in cavity flow driven by a lid, concluding that the cavity's diameter, density, and vortex behavior strongly influenced particle trajectories. Chen et al. [31] studied convective heat transfer of power-law non-Newtonian fluids from an oscillating hot impeller to cold tank walls using LBM. They found that increasing the impeller's aspect ratio and oscillation amplitude enhanced the heat transfer rate. Alghamdi et al. [32] used an intelligent computing approach to study the double-layered combined convective heated flow of Eyring-Powell fluid across an elevated stretched cylinder. They discovered that the concentration profile decreases with the Schmidt number and solutal stratification parameter and increases with the thermal stratification parameter.
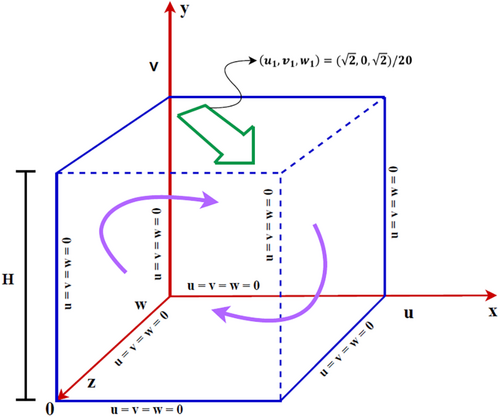
The scope of the article is to explore the behavior of power-law non-Newtonian fluids within a diagonally lid-driven cubic cavity, which has yet to be extensively investigated in the previous research. Although previous studies have focused on simpler geometries (e.g., rectangular or skewed cavities) or Newtonian fluids, our study addresses the gap in understanding how non-Newtonian fluids behave in more complex, diagonally driven flows. The novelty lies in integrating a D3Q27 MRT-LBM framework with GPU acceleration to simulate this underexplored scenario, providing insights into fluid dynamics and rheological properties at a level of detail and computational efficiency not previously possible. Additionally, the present work addresses how the power-law index affects vortex formation, helicity, and flow stability in a diagonally driven cavity. These insights advance the application of LBMs and the broader understanding of non-Newtonian fluid dynamics in complex systems.
2 Power-Law Non-Newtonian Fluids
Unlike Newtonian fluids (), whose viscosity remains constant regardless of shear rate, power-law fluids show shear-thinning or shear-thickening behavior. Shear-thinning () means viscosity decreases as the shear rate increases. This is typically observed in fluids like ketchup, which flow more easily under stress. Shear-thickening () means viscosity increases as the shear rate increases. This behavior is found in fluids like cornstarch and water mixture, which become more viscous when agitated. Power-law non-Newtonian fluids find applications in various fields, such as (i) Food industry: sauces, dressings, and food thickeners. (ii) Cosmetics: creams, lotions, and gels. (iii) Industrial processes: polymer melts, drilling fluids, and paints. (iv) Biomedical applications: blood flow and synovial fluid in joints.
Understanding the behavior of power-law non-Newtonian fluids is crucial for designing processes and predicting flow characteristics in systems where these fluids are involved. Computational models, such as the power-law model, are often used to simulate the behavior of these fluids under different conditions. Power-law non-Newtonian fluids exhibit complex rheological behavior, making them an essential area of study in fluid dynamics and materials science.
3 Computational Model and the Governing Navier–Stokes Equation
4 Problem Formulation Using D3Q27 MRT-LBM
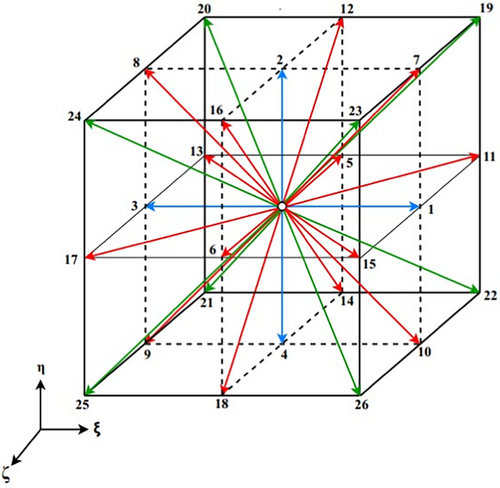
In Equation (10), are , , and for the lattice model.
- i
the density
(11) - ii
the momentum
(12) - iii
the second-order moments
(13) - iv
the fluxes of the energy
(14) - v
the square of the energy
(15) - vi
the cube of the energy
(16) - vii
the product of the second-order tensor and the energy
(17) - viii
the third-order pseudo-vector
(18) - ix
the antisymmetric tensor
(19)
In the present D3Q27 MRT-LBM, following Zhang et al. [43], the relations (24-27) are used in the formula (3) for calculating the non-Newtonian viscosity.
4.1 Mesoscopic BCs
BCs play a crucial role in maintaining the stability and precision of numerical solutions. Within the framework of LBM modeling, careful consideration is necessary to manage discrete distribution functions at boundaries to represent the macroscopic BCs of the fluid faithfully. In this investigation, the bounce-back condition is implemented at the wall. While in macroscopic computational fluid dynamics, the no-slip BC is utilized at walls, in LBM, a mesoscopic bounce-back BC is adopted at the walls. The bounce-back condition stipulates that when a particle from a specific fluid's discrete distribution function reaches a boundary node, it rebounds into the fluid along its incoming direction. In a 3D domain, bounce-back conditions are applied at six surfaces: east, west, north, south, top, and bottom, as given below for the east surface.
4.2 CUDA C++ Programming and Performance
The present investigation unveiled that GPU-based LBM simulations outperform CPU-based approaches, as extensively detailed by Molla et al. [44]. Molla et al. thoroughly explained the Compute Unified Device Architecture (CUDA) C/C++ implementation of the MRT-LBM code. CUDA serves as the computational model for executing computational programs on GPUs, capitalizing on the inherent advantages of GPU architecture by managing thread and memory hierarchies within the GPU.
This programming model executes computational programs based on the single instruction multiple thread (SIMT) principle. SIMT entails the parallel execution of multiple threads through a designated function, the , facilitated by streaming multiprocessors. During the execution of the kernel function, distinct kernels operate concurrently in distinct grids. Individual threads are identified using the reserved variable, whereas thread blocks are accessed through the variable. The size of the block and grid is determined across one, two, or three dimensions using the variables and respectively [4].
In the present simulation, a performance evaluation was conducted comparing the GPU-based CUDA C++ implementation for MRT-LBM with CPU-based sequential code, revealing an eighty-fold acceleration compared with CPU-based computations. The CPU configuration consists of an Intel(R) Core(TM) i7-9700K CPU @ 3.60GHz with 128 GB RAM, whereas the GPU utilized is a Quadro RTX 6000 with 4608 CUDA cores and 24 GB RAM.
4.3 Criteria for Convergence
5 Grid-Independent Test and Code Validation
To conduct a numerical simulation effectively, executing a grid sensitivity test and validating the code against benchmark solutions is imperative. In this simulation, we tested three different lattice sizes (), ultimately opting for the lattice dimensions for the entire simulation. For example, Figure 3a,b shows the results in terms of the vertical -velocity distribution for three different grid sizes and the power index. The following subsections detail the various code validation tests conducted.

5.1 Validation of the Code Using a Cubic Cavity With a Diagonally Driven Top Lid
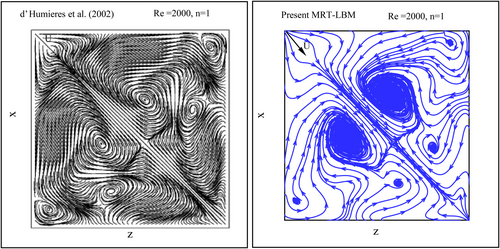
d'Humieres et al. [5] initially investigated a diagonally lid-driven cubic cavity for Newtonian fluid at a Reynolds number of . Their study used a D3Q15 MRT-LBM with a lattice size of , utilizing lid-driven velocity components of . A comparison between the present MRT-LBM results and the streamlines and velocity vector data from d'Humieres et al. [5] is depicted in Figure 4. This comparison indicates that the current D3Q27 MRT-LBM code is well-suited for simulating lid-driven cubic cavity flow diagonally with Newtonian fluid.
5.2 Verification of Code Accuracy Through Qualitative Analysis Using a Lid-Driven Cubic Cavity With Power-Law Fluids
After validating the code for Newtonian fluid, the simulated results using MRT-LBM were juxtaposed with those of Jin et al. [26] for non-Newtonian fluids. A qualitative analysis was conducted, comparing streamline patterns and viscosity distribution , where is used by Jin et al. [26] at and power-law index of and , as depicted in Figure 5a–d.

5.3 Quantitative Validation of the Code Using a Lid-Driven Cubic Cavity With Power-Law Fluids
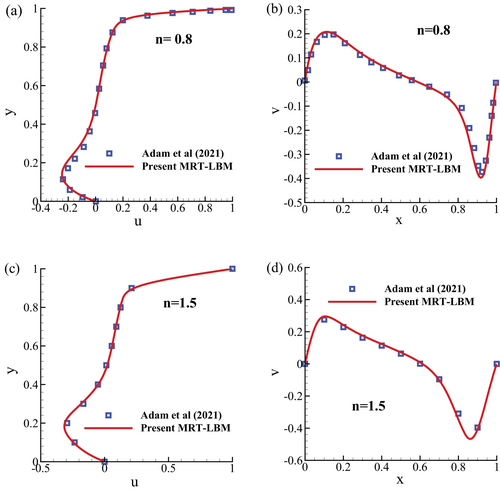
Figure 6a–d depict another code validation test involving a lid-driven cubic cavity with power-law non-Newtonian fluid. The horizontal velocity and vertical velocity are compared with the results obtained by Adam et al. [29] using the D3Q15 cascaded LBM, considering a Reynolds number of for both shear-thinning fluid () and shear-thickening fluid (). This test confirms the capability of the present MRT-LBM code to simulate power-law non-Newtonian fluid flow characteristics accurately.
5.4 Comparison Between the D3Q19 and D3Q27 MRT-LBM
A detailed comparison of the D3Q19 and D3Q27 MRT-LBM models reveals that both discretizations accurately predict velocity distributions for various power-law index at a Reynolds number , as shown in Figure 7a,b. The details of the D3Q19 MRT-LBM can be found in [41].
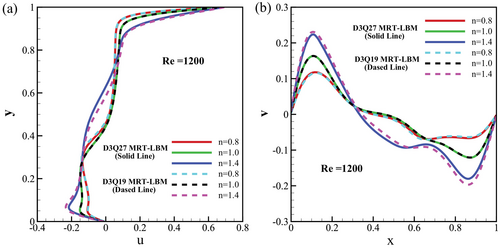
The comparison between the D3Q19 and D3Q27 MRT-LBM models focuses on their ability to predict velocity distributions under different conditions, specifically for various power-law indices (). Velocity components are evaluated at specific points within the domain. The D3Q27 model, with more discrete velocity directions, might offer slight improvements in capturing complex flow behaviors, especially at higher Reynolds numbers. However, both models are sufficiently accurate for practical purposes, demonstrating their robustness and reliability in simulating Newtonian and non-Newtonian fluid flows.
The MRT-LBM is a powerful technique for simulating fluid flow in computational fluid dynamics. Among different lattice configurations, D3Q19 and D3Q27 are commonly used 3D models, where the numbers represent the discrete velocity directions in the simulation. Simulation time is critical for evaluating these models' efficiency. A comparative analysis shows a significant difference in their computational demands, as shown in Table 1 for different grid arrangements. Specifically, the D3Q27 MRT-LBM requires more than double the simulation time compared with the D3Q19 MRT-LBM.
| Lattice size simulation time | |||
|---|---|---|---|
| MRT-LBM | |||
| D3Q19 | 407.77 (s) | 589.132 (s) | 882.152 (s) |
| D3Q27 | 878.045 (s) | 1348.57 (s) | 1841.68 (s) |
The D3Q27 model utilizes 27 discrete velocity directions, whereas the D3Q19 model uses only 19. This increase in the number of directions leads to a corresponding increase in the distribution functions that must be computed and stored at each lattice node. In MRT-LBM, the collision operator transforms the distribution functions into moment space, performs relaxation, and then transforms them back. The complexity of these operations scales with the number of velocity directions. Consequently, the D3Q27 model involves more complex and time-consuming calculations per time step. Additionally, the D3Q27 model requires more memory to store additional distribution functions, potentially causing bottlenecks in data transfer within the computational architecture. More velocity directions mean more calculations per lattice node, leading to a higher computational load per time step and longer overall simulation times.
Empirical studies and simulations confirm these theoretical expectations. For example, in a benchmark simulation involving fluid flow in a 3D cavity, it was observed that the D3Q27 MRT-LBM took more than twice the simulation time compared with the D3Q19 MRT-LBM for the same physical scenario and resolution. In summary, while the D3Q27 MRT-LBM offers potentially higher accuracy due to its finer discretization of velocity space, this comes at the cost of significantly increased simulation time. Therefore, choosing between the D3Q19 and D3Q27 models involves a trade-off between computational efficiency and accuracy, with the D3Q27 MRT-LBM requiring more than double the time compared with the D3Q19 MRT-LBM for typical simulations.
6 Results and Discussion
This study implements a power-law viscosity model within the D3Q27 LBM, successfully applied to analyze 3D laminar flows within a cubic cavity subjected to lid-driven motion along a diagonal axis. The simulation yields insightful findings regarding various flow characteristics when utilizing power-law non-Newtonian fluids. A comprehensive understanding of the intricate fluid behavior within these geometries is attained, focusing mainly on streamlines, velocity component distribution ( and ), viscosity profiles, iso-surface visualization of viscosity throughout the cavity, and the helicity or twistiness of the non-Newtonian fluids. The lid-driven motion, coupled with the non-Newtonian nature of the fluid, offers valuable insights into the impact of power-law behavior on streamlining generation and structure. These insights have direct implications for real-world applications, such as in the design of industrial processes. Additionally, the simulation offers crucial insights into the distribution of velocities and , normalized by across the cavity, aiding in anticipating overall fluid behavior and identifying high and low-velocity zones. This elucidates the influence of power-law non-Newtonian behavior () on these flow properties. The Reynolds number () plays a pivotal role in characterizing the flow regime within the lid-driven cavity. It is defined as the ratio of inertial to viscous forces and is a key parameter in our study. At low Reynolds numbers, viscous effects dominate due to modest inertial forces, resulting in a flow primarily governed by viscosity. Conversely, at high Reynolds numbers, inertial forces prevail, leading to more intricate and chaotic flow patterns. The varying viscosity, , where , across the different power-law index, introduces further complexity to the flow dynamics within the driven diagonal cavity, influencing shear resistance and altering flow patterns.
6.1 Streamlines, Viscosity, and Velocity for
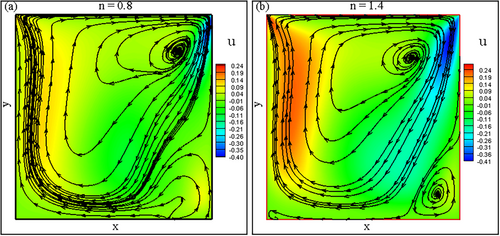
The streamlines overlaid on the -velocity field for a shear-thinning fluid with and are shown in Figure 8 at and . For power-law non-Newtonian fluids within a cubic cavity undergoing diagonal lid-driven motion, the streamlined behavior of the -velocity component provides valuable insights into the fluid dynamics. In the case of a shear-thinning fluid with a power-law index , illustrated in Figure 8a, the viscosity decreases with increasing shear rates, leading to reduced flow resistance and a significant alteration in streamline patterns, particularly near the driven lid and cavity corners. This reduction in viscosity facilitates the formation of an extensive primary vortex in the upper portion of the cavity, with streamlines reflecting a smoother and less resisted flow as shear rates escalate. In contrast, Figure 8b shows the behavior of a shear-thickening fluid with , where the viscosity increases with rising shear rates, resulting in more excellent flow resistance and distinct vortex patterns. The streamlines exhibit notable differences compared with the shear-thinning case, particularly in regions with high shear rates. Although the vortex size is slightly smaller for the shear-thickening fluid, its magnitude is more pronounced due to the higher viscosity at elevated shear rates.
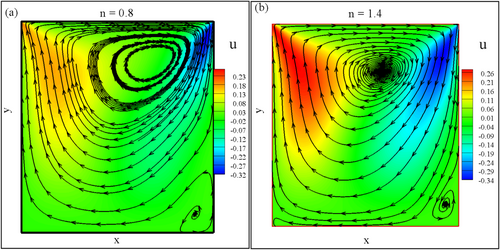
Further exploration of the streamline patterns is depicted in Figure 9 at and for , where both shear-thinning and shear-thickening fluids are examined. In Figure 9a, the decreased viscosity of the shear-thinning fluid () with increasing shear rates results in elongated streamlines and reduced resistance to flow, particularly near the diagonally driven lid. This smoother flow is associated with the alignment of fluid molecules, facilitating reduced viscosity and more streamlined patterns. Conversely, Figure 9b highlights the behavior of the shear-thickening fluid (), where the increased viscosity at higher shear rates creates more excellent flow resistance, altering the streamline distribution and overall velocity patterns within the cavity. The augmented viscosity is attributed to the molecular resistance to alignment under higher shear rates, significantly impacting the flow dynamics, especially in regions of high shear. These observations underscore the influence of rheological properties, characterized by the power-law index, on the flow behavior and streamline patterns in non-Newtonian fluids within the cavity.
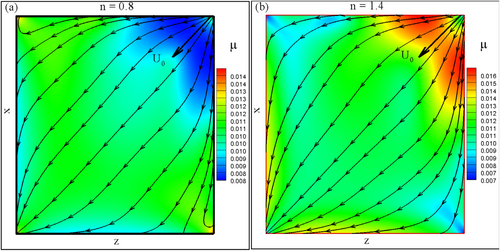
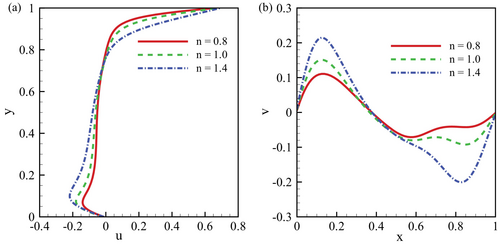
Figure 10 examines the velocity distribution within a diagonally driven cubic cavity, focusing on the influence of different power-law indices () on the velocity profiles. These indices represent shear-thinning (), Newtonian (), and shear-thickening () fluids, with a Reynolds number of 100 to balance inertial and viscous forces in the flow. In Figure 10a, the -velocity profile at highlights how fluid behavior changes with varying . Shear-thinning fluids () exhibit lower flow resistance due to reduced viscosity at higher shear rates, whereas shear-thickening fluids () show greater resistance with increased viscosity. The Newtonian fluid is a benchmark with a more conventional velocity distribution.' Similarly, Figure 10b shows the impact of on the -velocity profile at . The shear-thinning fluid presents a distinct velocity pattern with reduced resistance, whereas the shear-thickening fluid exhibits higher flow resistance. The Newtonian fluid again serves as a reference for comparison. The maximum -velocity occurs for , whereas the minimum is observed for .
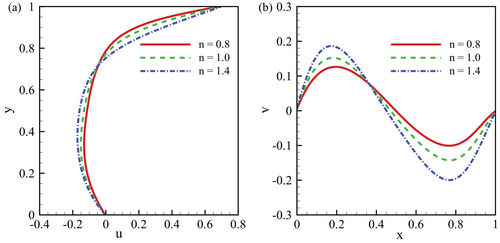
This analysis provides insights into how power-law indices influence fluid rheology and velocity profiles in lid-driven cavity flow. For further comparison, Tables 2 and 3 detail the and velocity components at and for and . Notably, the -velocity decreases by and at , and increases by and at , for and , respectively. The -velocity decreases by and for and as the Reynolds number increases from 200 to 400 at .
| y-coordinate | ||||||
|---|---|---|---|---|---|---|
| 0.0 | −0.0074 | −0.0074 | −0.0059 | −0.0110 | −0.0122 | −0.0105 |
| 0.05 | −0.1000 | −0.1034 | −0.0885 | −0.1325 | −0.1569 | −0.1488 |
| 0.10 | 0.1420 | −0.1551 | −0.1448 | −0.1404 | −0.1776 | −0.2073 |
| 0.15 | −0.1452 | −0.1669 | −0.1738 | −0.1082 | −0.1421 | −0.1974 |
| 0.20 | −0.1302 | −0.1559 | −0.1815 | −0.0839 | −0.1127 | −0.1692 |
| 0.25 | 0.1122 | −0.1384 | −0.1766 | −0.0694 | −0.0946 | −0.1447 |
| 0.30 | −0.0965 | −0.1218 | −0.1659 | −0.0608 | −0.0831 | −0.1264 |
| 0.35 | −0.0845 | −0.1081 | −0.1533 | −0.0558 | −0.0754 | −0.1126 |
| 0.40 | −0.0757 | −0.0973 | −0.1403 | −0.0527 | −0.0697 | −0.1013 |
| 0.45 | −0.0690 | −0.0884 | -0.1274 | −0.0503 | −0.0647 | −0.0912 |
| 0.50 | −0.0633 | −0.0802 | −0.1140 | −0.0478 | −0.0595 | −0.0811 |
| 0.55 | −0.0576 | −0.0717 | −0.0995 | −0.0444 | −0.0534 | −0.0702 |
| 0.60 | −0.0507 | −0.0617 | −0.0827 | −0.0396 | −0.0457 | −0.0576 |
| 0.65 | −0.0416 | −0.0491 | −0.0621 | −0.0326 | −0.0358 | −0.0427 |
| 0.70 | −0.0293 | −0.0324 | −0.0352 | -0.0233 | -0.0234 | −0.0248 |
| 0.75 | −0.0127 | −0.0130 | 0.0047 | −0.0129 | −0.0102 | −0.0017 |
| 0.80 | 0.0104 | 0.0241 | 0.0698 | 0.0039 | 0.0123 | 0.0366 |
| 0.85 | 0.0430 | 0.0733 | 0.1583 | 0.0226 | 0.0407 | 0.1002 |
| 0.90 | 0.1315 | 0.1988 | 0.3280 | 0.0761 | 0.1270 | 0.2585 |
| 0.95 | 0.2956 | 0.3825 | 0.4966 | 0.2080 | 0.3009 | 0.4494 |
| 1.00 | 0.6776 | 0.6871 | 0.6961 | 0.6664 | 0.6799 | 0.6931 |
- Note: The table presents the -velocity profiles calculated at various points along the -coordinate for different values of and Reynolds number .
| x-coordinate | ||||||
|---|---|---|---|---|---|---|
| 0.0 | 0.0057 | 0.0069 | 0.0082 | 0.0058 | 0.0480 | 0.0093 |
| 0.05 | 0.0765 | 0.0961 | 0.1185 | 0.0766 | 0.1008 | 0.1336 |
| 0.10 | 0.1140 | 0.1450 | 0.1856 | 0.1091 | 0.1464 | 0.2027 |
| 0.15 | 0.1277 | 0.1603 | 0.2062 | 0.1143 | 0.1504 | 0.2093 |
| 0.20 | 0.1243 | 0.1504 | 0.1902 | 0.1024 | 0.1273 | 0.1739 |
| 0.25 | 0.1088 | 0.1244 | 0.1530 | 0.0801 | 0.0919 | 0.1237 |
| 0.30 | 0.0854 | 0.0900 | 0.1061 | 0.0529 | 0.0545 | 0.0733 |
| 0.35 | 0.0576 | 0.0531 | 0.0578 | 0.0250 | 0.0197 | 0.0285 |
| 0.40 | 0.0283 | 0.0173 | 0.0133 | −0.0019 | −0.0111 | −0.0091 |
| 0.45 | 0.0001 | −0.0152 | −0.0260 | −0.0267 | −0.0376 | −0.0398 |
| 0.50 | −0.0256 | −0.0436 | −0.0611 | −0.0477 | −0.0592 | −0.0647 |
| 0.55 | −0.0469 | −0.0675 | −0.0942 | −0.0617 | −0.0738 | −0.0855 |
| 0.60 | −0.0628 | −0.0873 | −0.1269 | −0.0659 | −0.0799 | -0.1052 |
| 0.65 | −0.0730 | −0.1036 | −0.1591 | −0.0611 | −0.0805 | −0.1279 |
| 0.70 | −0.0783 | −0.1169 | −0.1880 | −0.0537 | −0.0820 | −0.1561 |
| 0.75 | −0.0797 | −0.1259 | −0.2072 | −0.0494 | −0.0888 | −0.1858 |
| 0.80 | −0.0765 | −0.1264 | −0.2079 | −0.0483 | −0.0971 | −0.2039 |
| 0.85 | −0.0675 | −0.1151 | −0.1872 | −0.0471 | −0.0980 | −0.1935 |
| 0.90 | −0.0455 | −0.0811 | −0.1311 | −0.0385 | −0.0791 | −0.1475 |
| 0.95 | −0.0231 | −0.0438 | −0.0717 | −0.0237 | −0.0477 | −0.0842 |
| 1.00 | −0.0010 | −0.0022 | -0.0038 | −0.0014 | −0.0028 | −0.0046 |
6.2 Streamlines and Velocity Distribution for
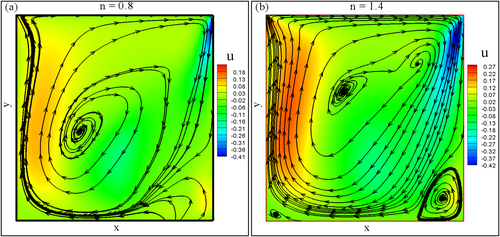
The rheological properties of non-Newtonian fluids significantly influence the flow dynamics, mainly how streamlines and velocity are shaped by shear-thinning and shear-thickening behaviors, as illustrated in Figure 11 while for . For shear-thinning fluids (), viscosity decreases with a rising shear rate, reducing shear resistance and elongating distorted streamlines. At for , this behavior results in streamlined flow patterns and reduced shear stresses, enhancing fluid momentum and transport (Figure 11a). The -velocity component, indicating velocity in the x-direction, is expected to increase more substantially, contributing to smoother flow.
In contrast, shear-thickening fluids () exhibit increasing viscosity with higher shear rates, causing more excellent resistance to shear and leading to more contracted streamlines (Figure 11b). At for , this heightened resistance results in more complex and intricate flow patterns characterized by localized regions with increased velocity gradients and higher shear stresses.
Similarly, Figure 12 shows the streamlines overlaid on the -velocity field for at and . For the shear-thinning fluid (), streamlines elongate with reduced resistance, leading to smoother flow with diminished shear stresses and an increased -velocity. In contrast, the shear-thickening fluid () exhibits heightened resistance to shear, resulting in more constrained and complex flow patterns with localized velocity gradients and increased stresses in the x-direction (Figure 12b). Overall, the fluid's rheological characteristics profoundly shape the interplay between streamlines and velocity distribution, with shear-thinning fluids facilitating the smoother flow and shear-thickening fluids creating more intricate patterns.
In Figure 13, the velocity profiles for different power-law indices () are displayed as at and at under the conditions of and . For the component at and with where represents velocity in the x-direction normalized by characteristic velocity , the behavior changes significantly based on the power-law index. In shear-thinning fluids (), viscosity decreases with increasing shear rate, leading to higher velocities in the x-direction, reduced shear stresses, and enhanced momentum transfer. In contrast, shear-thickening fluids () experience increased resistance to shear, resulting in a more constrained distribution with localized areas of elevated velocity gradients and increased shear stresses. The Newtonian case () presents a more uniform and straightforward velocity profile.]
Similarly, the component at shows how the power-law index affects velocity in the y-direction. For , shear-thinning behavior induces higher velocities and enhanced momentum transmission. At the same time, for , the shear-thickening nature results in a more restricted distribution, characterized by localized regions with elevated shear stresses. The Newtonian case offers a more consistent and balanced profile. Tables 4 and 5 further illustrate these effects by comparing and velocities at and for and . The -velocity increases by and for and , respectively, as the Reynolds number increases from 600 to 800 at . For the -velocity, increases of and are observed as increases from 0.8 to 1.4 at for and , respectively. However, at , the -velocity decreases by and for compared with at the same Reynolds numbers.
| y-coordinate | ||||||
|---|---|---|---|---|---|---|
| 0.0 | −0.0117 | −0.0138 | −0.0133 | −0.0118 | −0.0147 | −0.0150 |
| 0.05 | −0.1290 | −0.1664 | −0.1824 | −0.1204 | −0.1644 | −0.2007 |
| 0.10 | −0.1158 | −0.1580 | −0.2225 | −0.1017 | −0.1410 | −0.2196 |
| 0.15 | −0.0876 | −0.1204 | −0.1865 | −0.0873 | −0.1150 | −0.1752 |
| 0.20 | −0.0745 | −0.1008 | −0.1534 | −0.0850 | −0.1053 | −0.1468 |
| 0.25 | −0.0688 | −0.0907 | −0.1322 | −0.0865 | −0.1015 | −0.1305 |
| 0.30 | −0.0664 | −0.0848 | −0.1180 | −0.0883 | −0.0993 | -0.1197 |
| 0.35 | −0.0653 | −0.0806 | −0.1073 | −0.0883 | −0.0964 | −0.1117 |
| 0.40 | −0.0642 | −0.0765 | −0.0983 | −0.0846 | −0.0908 | −0.1043 |
| 0.45 | −0.0620 | −0.0716 | −0.0896 | −0.0760 | −0.0811 | −0.0963 |
| 0.50 | −0.0581 | −0.0650 | −0.0802 | −0.0620 | −0.0666 | −0.0865 |
| 0.55 | −0.0520 | −0.0562 | −0.0693 | −0.0439 | −0.0476 | −0.0739 |
| 0.60 | −0.0432 | −0.0450 | −0.0562 | −0.0243 | −0.0258 | −0.0578 |
| 0.65 | −0.0321 | −0.0312 | −0.0408 | −0.0062 | −0.0038 | −0.0380 |
| 0.70 | −0.0192 | -0.0154 | -0.0228 | 0.0087 | 0.0161 | −0.0147 |
| 0.75 | −0.0069 | 0.0020 | −0.0015 | 0.0203 | 0.0327 | 0.0117 |
| 0.80 | 0.0095 | 0.0209 | 0.0289 | 0.0298 | 0.0464 | 0.0414 |
| 0.85 | 0.0243 | 0.0417 | 0.0784 | 0.0385 | 0.0584 | 0.0792 |
| 0.90 | 0.0609 | 0.1016 | 0.2192 | 0.0608 | 0.0949 | 0.1962 |
| 0.95 | 0.1637 | 0.2528 | 0.4169 | 0.1380 | 0.2204 | 0.3916 |
| 1.00 | 0.6582 | 0.6746 | 0.6910 | 0.6512 | 0.6702 | 0.6893 |
| x-coordinate | ||||||
|---|---|---|---|---|---|---|
| 0.0 | 0.0057 | 0.0076 | 0.0097 | 0.0060 | 0.0080 | 0.0102 |
| 0.05 | 0.0762 | 0.1040 | 0.1401 | 0.0799 | 0.1110 | 0.1470 |
| 0.10 | 0.1061 | 0.1476 | 0.2088 | 0.1101 | 0.1542 | 0.2148 |
| 0.15 | 0.1068 | 0.1445 | 0.2067 | 0.1082 | 0.1451 | 0.2046 |
| 0.20 | 0.0899 | 0.1141 | 0.1630 | 0.0872 | 0.1091 | 0.1548 |
| 0.25 | 0.0633 | 0.0742 | 0.1083 | 0.0568 | 0.0666 | 0.0970 |
| 0.30 | 0.0334 | 0.0349 | 0.0559 | 0.0254 | 0.0269 | 0.0421 |
| 0.35 | 0.0041 | −0.0001 | 0.0113 | −0.0036 | −0.0071 | −0.0039 |
| 0.40 | −0.0236 | -0.0299 | -0.0234 | -0.0309 | −0.0365 | −0.0370 |
| 0.45 | −0.0485 | −0.0545 | -0.0503 | -0.0574 | −0.0623 | −0.0604 |
| 0.50 | −0.0681 | −0.0734 | −0.0710 | −0.0801 | −0.0828 | −0.0781 |
| 0.55 | −0.0776 | −0.0831 | −0.0844 | −0.0911 | −0.0929 | −0.0866 |
| 0.60 | −0.0728 | −0.0805 | −0.0923 | −0.0841 | −0.0882 | −0.0861 |
| 0.65 | −0.0576 | −0.0705 | −0.1032 | −0.0657 | −0.0747 | −0.0872 |
| 0.70 | −0.0435 | −0.0639 | −0.1260 | −0.0491 | −0.0642 | −0.1036 |
| 0.75 | −0.0368 | −0.0679 | -0.1597 | −0.0406 | −0.0643 | −0.1371 |
| 0.80 | −0.0371 | −0.0799 | −0.1898 | −0.0399 | −0.0754 | −0.1740 |
| 0.85 | -0.0399 | −0.0878 | −0.1933 | −0.0435 | −0.0870 | −0.1888 |
| 0.90 | −0.0375 | −0.0785 | −0.1549 | -0.0424 | -0.0818 | -0.1580 |
| 0.95 | -0.0258 | −0.0453 | −0.0807 | -0.0275 | −0.0491 | −0.0846 |
| 1.00 | −0.0018 | −0.0032 | −0.0051 | −0.0022 | −0.0036 | −0.0054 |
6.3 Streamlines, Viscosity, and Velocity Distribution for
Figures 14 and 15 together illustrate the behavior of streamlines and -velocities within non-Newtonian fluids under shear-thinning and shear-thickening conditions at . In shear-thinning fluids (), viscosity decreases as the shear rate increases, resulting in elongated and smoother streamlines that promote more excellent fluid acceleration and momentum transfer. This leads to higher -velocity along the streamlines and reduced shear stresses, fostering a more streamlined flow pattern at and . The reduction in viscosity with increasing velocity allows fluid components to move more freely, enhancing deformation and creating efficient, streamlined flow dynamics.
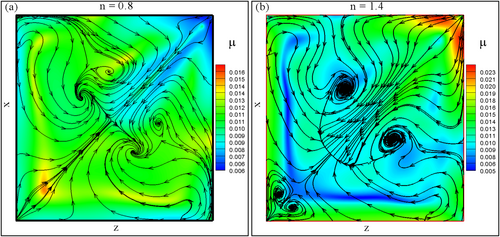
In contrast, viscosity increases with higher shear rates for shear-thickening fluids (), resulting in more excellent resistance to flow and more complex, constricted streamlines. This higher viscosity restricts fluid movement, leading to less pronounced increases in -velocity and more localized areas of elevated shear stresses and velocity gradients. The flow patterns become more intricate and confined due to the fluid's heightened resistance to shear at higher velocities, as seen at and .
In summary, shear-thinning fluids encourage smoother, more streamlined flow with higher -velocity along the streamlines. In contrast, shear-thickening fluids exhibit more constrained and complex flow patterns with localized shear stresses. These behaviors, driven by the rheological properties of the fluids, are critical in understanding and predicting flow dynamics in non-Newtonian fluids for practical applications.
The velocity distribution within a fluid with varying power-law indices () is critical in shaping flow dynamics, particularly at specific points within the domain. The power-law index governs whether the fluid exhibits shear-thinning or shear-thickening behavior, directly impacting the flow characteristics. The velocity distribution for the various power-law indexes () is shown in Figure 16, with at and at , while and .
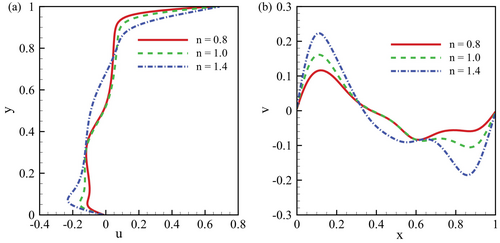
For the -velocity component at and with , Figure 16a shows that in shear-thinning fluids (), viscosity decreases with increasing shear rates, allowing for higher velocities in the x-direction. This results in a more efficient flow pattern, enhanced momentum transmission, and reduced shear stresses, leading to a smoother and faster flow. Conversely, viscosity increases with the shear rate in shear-thickening fluids (), creating more excellent resistance to flow. This leads to a more constrained -velocity distribution, characterized by isolated regions of elevated velocity gradients and shear stresses. The Newtonian fluid case () produces a more uniform velocity distribution, typical of conventional viscous fluids, where viscosity remains constant and flow is more predictable.
Similarly, the -velocity component at in Figure 16b further highlights the impact of on fluid behavior. For , the shear-thinning fluid experiences increased velocities in the y-direction, facilitating more robust momentum transmission and smoother flow patterns. In contrast, the shear-thickening fluid () shows excellent shear resistance, resulting in a more confined and intricate -velocity distribution with localized regions of higher shear stresses and velocity gradients. Again, the Newtonian case () maintains a more balanced and uniform profile, reflecting its constant viscosity properties. These variations in the and velocity components at and highlight the importance of rheological properties in shaping flow dynamics, essential for predicting and controlling fluid behavior in practical applications.
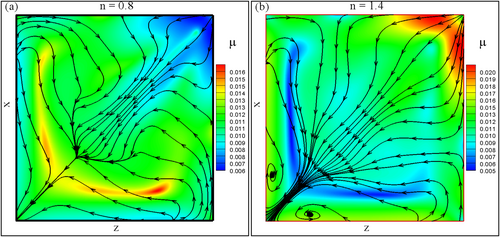
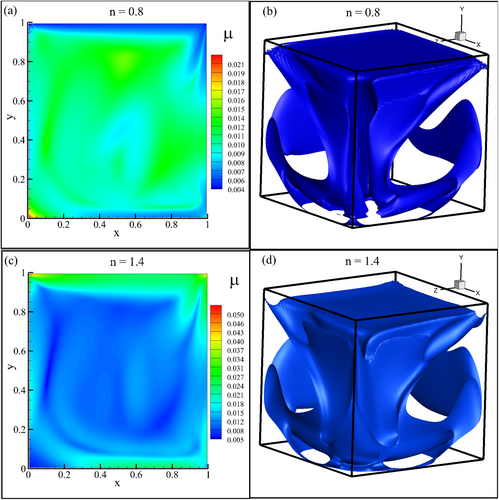
Figure 17 presents the variations in viscosity distribution for different power-law indices () in the xy-plane at , along with corresponding iso-surfaces for . In Figure 17a, the viscosity distribution for , representing shear-thinning behavior, shows lower viscosity in the flow field near . This reduction in viscosity allows for enhanced fluid deformation and more efficient flow patterns characterized by higher velocities and lower shear stresses. The reduced viscosity mitigates shear resistance, leading to a smoother and faster flow. Figure 17b visualizes this behavior through a 3D iso-surface, highlighting regions with constant viscosity. In the shear-thinning case, the iso-surface emphasizes areas with high shear rates and lower viscosity, providing insights into regions of the fluid domain experiencing significant deformation. Conversely, in Figure 17c, the viscosity distribution for (shear-thickening behavior) shows increased viscosity at the xy-plane and , corresponding to higher shear rates. This heightened viscosity increases shear resistance, resulting in more constrained flow patterns with elevated shear stresses and complex fluid deformation. The iso-surface in Figure 17d highlights areas with constant viscosity for , showcasing regions with higher viscosity and more excellent shear resistance. This provides a 3D representation of the fluid's shear-thickening behavior, revealing the spatial distribution of areas with increased viscosity and more intricate flow dynamics. The viscosity distribution varies significantly between shear-thinning () and shear-thickening () behaviors for in the xy-plane and . The iso-surfaces visualize these differences, enhancing our understanding of how shear rates and viscosity affect flow patterns in 3D non-Newtonian fluids.
6.4 Helicity of the Power-Law Fluids
Helicity is a conserved quantity in ideal fluid flow, meaning that it remains constant over time for inviscid, incompressible fluids in the case of continuous fluid properties. It plays a significant role in understanding vortex dynamics, providing insight into the formation and evolution of vortex structures. Additionally, helicity has applications in various areas of fluid dynamics, including astrophysics, atmospheric science, and plasma physics.
Figure 18a–c presents contour plots of helicity () in the -plane for varying power-law indices () at . These figures illustrate that shear-thinning fluids' helicity magnitude is greater due to decreased viscosity. Conversely, shear-thickening fluids exhibit lower helicity magnitude due to their higher viscosity. An increase in helicity magnitude suggests a greater degree of helical motion, implying more pronounced swirling patterns within the fluid. Conversely, a decrease in helicity magnitude indicates a reduction in the intensity of helical motion, suggesting less prominent swirling behavior in the flow. In fluid dynamics, the magnitude of helicity can be positive, negative, or zero, depending on the specific characteristics of the flow. Positive helicity occurs when the velocity field and its curl are aligned so their dot product is positive. This typically corresponds to flow patterns with a coherent, organized structure, such as large-scale vortices or helical flows. Positive helicity is often associated with stable structures and coherent turbulent flow formation. Negative helicity occurs when the velocity field and its curl are aligned so that their dot product is negative. This usually indicates flow patterns with a more chaotic, disorganized structure, where the direction of rotation of vortices is opposite to the overall flow direction. Negative helicity is often associated with regions of intense turbulence and vortex stretching. Zero helicity occurs when the velocity field and its curl are orthogonal to each other, resulting in a dot product of zero. This can happen in certain symmetric flow configurations or when the flow lacks a coherent rotational structure. Zero helicity does not necessarily imply that the flow is uniform or laminar; rather, it indicates a balance between opposing rotational tendencies. The sign and magnitude of helicity provide valuable information about the nature and behavior of fluid flow, especially in complex flow scenarios. As illustrated in Figure 18a–c, it is evident that the helicity distribution exhibits symmetry around the cavity diagonal, attributed to the diagonal motion of the upper lid. This symmetry further signifies laminar flow across all three cases.

7 Conclusions
- As the shear rate increases, the viscosity in shear-thinning fluids reduces, resulting in streamlined flow patterns and decreased shear stresses. Viscosity reduces as the shear rate increases, impacting flow dynamics inside the cavity.
- Near the driven lid and cavity corners, streamlines change, suggesting decreasing flow resistance. The upper section of the hollow has a sizeable central vortex.
- Higher shear rates cause shear-thickening fluids to become more viscous, which leads to more complex and intricate flow patterns. As the shear rate increases, viscosity also increases, improving flow resistance.
- In Newtonian behavior with constant viscosity, should be more uniform and straightforward at . At , the component shows the y-axis velocity distribution.
- The v-velocity reduces by and for and , respectively, when the Reynolds number increases from 200 to 400 at the x-coordinate of 0.25.
- Viscosity distribution in the -plane, with and , indicating shear-thinning behavior, shapes flow. Lower viscosity when lowers shear resistance, creating flow patterns with greater velocities and decreasing shear stresses.
- The v-velocity increases by and for and when the power-law index (n) is raised from 0.8 to 1.4 at the x-coordinate of 0.15. In contrast, when increases from 0.8 to 1.4, the v-velocity at decreases by and for and , respectively.
- The shear-thinning fluid exhibits an increased helicity magnitude due to diminished viscosity. In contrast, shear-thickening fluids have a reduced magnitude due to their elevated viscosity.
- The numerical results from this study are set to act as benchmark data for validating 3D codes related to non-Newtonian power-law fluids.
- The simulation times of the D3Q19 and D3Q27 MRT-LBM models show that the D3Q27 MRT-LBM takes more than twice as long as the D3Q19 MRT-LBM.
Author Contributions
Md. Mamun Molla: conceptualization; methodology; software; data curation; investigation; formal analysis; supervision; funding acquisition; visualization; project administration; resources; writing – original draft; writing – review and editing. Amzad Hossain: conceptualization; methodology; data curation; investigation; validation; formal analysis; visualization; writing – original draft; writing – review and editing. Md. Mahadul Islam: conceptualization; methodology; data curation; investigation; validation; formal analysis; writing – original draft; writing – review and editing; visualization.
Conflicts of Interest
The authors declare no conflicts of interest.
Open Research
Data Availability Statement
The data that support the findings of this study are available from the corresponding author upon reasonable request. This study is not associated with any third party data.


