Development of a multiparametric score to predict left ventricular remodelling and prognosis after cardiac resynchronization therapy
Abstract
Aims
Optimal delivery of CRT requires appropriate patient selection and device implantation. Echocardiographic predictors of CRT response individually appear to enhance patient selection, but do not fully reflect the complex underlying myocardial dysfunction. We hypothesized that a multiparametric approach would offer greater predictive value and sought to derive a score incorporating baseline characteristics including: dyssynchrony, LV function, and LV lead position.
Methods and results
Data were analysed from 294 patients undergoing CRT between June 2008 and December 2012. All patients were in sinus rhythm with QRS >120 ms, NYHA class II–IV, and LVEF <35%. Detailed clinical assessment including echocardiography was completed at baseline and 6 months after CRT. Response was defined as a ≥15% reduction in LV end-systolic volume. Dyssynchrony (interventricular delay and radial strain delay), global longitudinal strain, and LV lead position were independent predictors of LV remodelling and were used to derive a predictive score which correlated with reduction in LV volume (r = − 0.5, P < 0.001) and was higher with QRS >150 ms and non-ischaemic aetiology. A cut-off score <0.6 offered the highest specificity and positive predictive value (100%) to determine non-response. A score >3.28 offered high specificity (specificity 86%, sensitivity 70%) to predict response. Survival proportion at longer term follow-up was low (21%) in the group with predictive score <0.6.
Conclusion
A multiparametric strategy, which defines anticipated probability of response to CRT, offers potential to predict non-responders with poor long-term survival following CRT. The value of this approach in avoiding unnecessary device implantation with potential for harm requires validation in large multicentre studies.
Introduction
Cardiac resynchronization therapy (CRT) confers a clinical response, positive LV remodelling, and improved survival in selected patients with heart failure. Based on criteria derived from large randomized trial populations, approximately one-third of patients fail to achieve significant benefit and up to 40% do not demonstrate LV remodelling.1 Further improving response to CRT may require a more individualized approach with better definition of those who will derive little or no benefit, or in whom there may even be potential for harm.2
A number of factors are shown to influence the ability of the heart to respond positively to CRT, including patient characteristics (female sex, non-ischaemic aetiology, QRS >150 ms), demonstrable dyssynchrony, and scar burden.3, 4 The presence of mechanical dyssynchrony as a target for CRT is attractive, but echocardiographic selection studies have been disappointing and no single measure has been reliably incorporated into clinical practice.5 However, the complex changes in both the geometry and temporal activation of the failing ventricle may not be readily characterized by one individual parameter, and the predominant mechanism of benefit from CRT may vary between patients.
The development of speckle-tracking echocardiography appears to offer a more reliable assessment of both global and regional LV deformation,6 scar burden, and viability,7 and has been employed to try and better define the underlying myocardial dysfunction that may be corrected by CRT.8-10 There is increasing evidence that such an approach can also be utilized to direct LV lead position prospectively, enhancing both LV remodelling and long-term survival.11-13
We hypothesized that a multiparametric predictive score (p-score) derived from baseline factors, including speckle-tracking echocardiographic assessment, and the final LV lead position in CRT-eligible patients could be used to determine those who would be most likely and also those who would be least likely to demonstrate LV remodelling after CRT.
Methods
Patient population and study protocol
A retrospective analysis was performed using prospectively collected data from consecutive patients who received CRT in one of two UK centres between June 2008 and December 2012. All subjects were in sinus rhythm with QRS duration ≥120 ms and LBBB morphology on the surface ECG, NYHA functional class II or more symptomatic limitation, and LV systolic dysfunction (LVEF <35%). Detailed assessment was completed both prior to and 6 months following scheduled device therapy and included a Minnesota Living with Heart Failure questionnaire (MLHFQ), 6 min walk test (6MWT), and transthoracic echocardiography. Response to CRT was defined as LV remodelling with a ≥15% reduction in LV end-systolic volume at 6 months. Clinical response was defined as ≥1 grade improvement in NYHA class. Patients who died before 6-month follow-up (n = 14) were classed as non-responders. Follow-up data regarding hospital admissions for heart failure were available up to 24 months following CRT implantation. Long-term mortality data were recorded with the longest follow-up duration of 60 months. The study complies with the Declaration of Helsinki and was approved by our local ethics committee; all patients gave fully informed consent for participation.
Echocardiography
Standard two-dimensional grey-scale and tissue Doppler imaging (TDI) was performed using a 3.5 MHz phased array transducer (Vivid 7, General Electric Medical Systems, Horten, Norway). Images were acquired in a cine-loop format and digitally stored for post-processing offline (GE EchoPAC, Horten, Norway). LV end-diastolic and LV end-systolic volumes (LVEDV and LVESV) and EF were calculated using the biplane Simpson rule. Speckle-tracking longitudinal and radial strain analysis was performed using apical (two-, three-, and four chamber views) and parasternal (short axis) views, respectively, with frame rates >40 Hz. The endocardial border was traced just within the endocardium using a point-and-click technique in end-systole and the epicardial border was manually adjusted so that the area of interest included the entire myocardial wall. After ensuring optimal tracking of all segments, time–strain curves produced by automated tracking algorithms were used to derive global longitudinal strain (GLS) and dyssynchrony indices.
Assessment of dyssynchrony and contractility
Three levels of mechanical dyssynchrony and global LV contractility were assessed as follows. (i) Atrioventricular dyssynchrony (AVD): ratio of filling time on mitral inflow to R–R interval (LV filling time/RR interval). (ii) Interventricular mechanical dyssynchrony (IVMD): the difference in LV and right ventricular (RV) pre-ejection time. (iii) Intraventricular dyssynchrony assessed using anteroseptal to posterior wall (AS–PW) delay,14 radial strain delay (RSD),10 and standard deviation of the time-to-peak systolic velocity by TDI of the 12 non-apical segments (Ts-SD12).15 RSD is a novel parameter incorporating amplitude and timing of regional myocardial deformation to quantify the degree of wasted energy resulting from both early and late contracting segments. Segments of low amplitude strain will not contribute effectively to ejection and have lower wasted energy. RSD is calculated as peak radial strain minus radial strain at aortic valve closure for the 12 non-apical segments: Σ12 (RSPeak – RSAVC). (iv) GLS was calculated as average strain in all segments from the three apical views, with not more than three uninterpretable segments.6
Cardiac resynchronization device implantation
Biventricular pacing devices were implanted transvenously. Final LV lead position was determined using biplane fluoroscopy, and lateral and frontal chest radiographs, by an independent assessor blinded to any echocardiographic data. The RV lead was placed to the RV septum or apex according to operator preference. Following CRT implantation, atrioventricular and interventricular delays were optimized by echocardiography, according to the highest velocity time integrals from pulsed wave Doppler of the transmitral inflow and LV outflow tract, or non-invasive cardiac output monitoring (NICOM),16 with repeated optimization according to clinical need. Agreement between pre-determined optimal pacing site and final LV lead position was recorded as optimal, i.e. either at or within one segment of the optimal site, or suboptimal, i.e. two or more segments from the optimal site.
Statistics
Continuous variables are expressed as mean ± standard deviation (SD) and compared using Student's t-test or analysis of variance (ANOVA) as appropriate. Categorical variables, expressed as number and percentages, were compared using χ2 test. Pearson's correlation coefficient was used to assess the relationship between continuous variables. Optimal cut-off values to predict CRT response and non-response were derived from receiver operating characeristic (ROC) curve analysis. ROC curves were compared using the DeLong method.17 Previously described values for IVMD, AS–PW delay, and Ts-SD12, taken as 40, 130, and 33 ms, respectively, were utilized.14, 15, 18 Reproducibility of echocardiographic parameters included in the final model was assessed in 10 randomly selected cases. Inter- and intraobserver variability were expressed as the standard deviation of the difference between two paired measurements and as a percentage of variability. Kaplan–Meier curves were plotted for survival, and the log rank test was used for comparison across groups. Analysis was performed using SPSS (version 21.0, SPSS Inc., Chicago, IL, USA); a P-value <0.05 was considered significant.
Development of predictive score
Candidate variables for inclusion in a model to response following CRT were chosen based on clinical, echocardiographic, and laboratory data, and factors previously related to LV remodelling and CRT outcomes, and included: age, sex, QRS duration, ischaemic aetiology, type II diabetes, serum creatinine, LV dyssynchrony, and contractility measures as described, RV function, and LV lead position. Continuous variables were used wherever possible, with logarithmic transformation if markedly non-normal.
Separate logistic regression models were fitted to LV remodelling response for each variable of interest both in isolation and after adjusting for LV lead position. Those that remained significant at a 10% level were included in a multiple logistic regression with forwards model selection (likelihood ratio testing) to identify predictors of LV remodelling. Two way interactions between independent predictors were tested but none were found to be significant. Final model coefficients were used to construct a predictive score (p-score) for LV remodelling response. Model calibration was assessed using a comparison of observed and predicted counts.
Results
Baseline characteristics and response to cardiac resynchronization therapy
Of 310 participants undergoing CRT during the study period, 16 were lost to follow-up, with remaining data available in 294 cases. The number of cases with echocardiographic measures of dyssynchrony and GLS in this cohort were as follows: LV filling ratio 88%, IVMD 83%, RSD and AS–PW delay 86%, Ts-SD12 80%, and GLS 82%. Baseline characteristics are shown in Table 1.
| n = 294 | |
|---|---|
| Age (years) | 70 ± 10 |
| Male gender | 220 (75) |
| Ischaemic aetiology | 157 (53) |
| NYHA III/IV | 285 (97) |
| Creatinine (µmol/L) | 123 ± 54 |
| Haemoglobin (g/dL) | 13.2 ± 1.5 |
| Diabetes | 69 (23) |
| CABG | 72 (24) |
| QRS (ms) | 160 ± 23 |
| LVEDV (mL) | 194 ± 70 |
| LVESV (mL) | 149 ± 59 |
| LVEF (%) | 24 ± 7 |
| TAPSE (mm) | 19 ± 6 |
| LV ratio | 0.41 ± 0.09 |
| IVMD (ms) | 42 ± 25 |
| Ts-SD12 | 35 ± 18 |
| AS–PW delay (ms) | 195 ± 156 |
| RSD (ms) | 60 ± 42 |
| GLS (%) | −7.1 ± 3 |
| CRT-D | 112 (38) |
| Optimal LV lead position | 243 (83) |
| Loop diuretic | 273 (93) |
| ACE inhibitor or ARB | 274 (93) |
| Beta-blockers | 213 (72) |
| Spironolactone | 157 (53) |
- Data are presented as mean ± SD or n (%).
- AS–PW delay, anteroseptal to posterior wall delay; CABG, coronary artery bypasss graft; CRT-D, CRT defibrillator; GLS, global longitudinal strain; IVMD, interventricular mechanical delay; LVEDV, left ventricular end-diastolic volume; LVESV, left ventricular end-systolic volume; RSD, radial strain delay; TAPSE, tricuspid annular systolic excursion; Ts-SD12, standard deviation of time to peak strain by tissue Doppler imaging for 12 non-apical segments.
After 6 months there was an overall reduction in LVEDV (190 ± 64 mL vs. 160 ± 57 mL, P < 0.001) and LVESV (147 ± 59 mL vs. 115 ± 23 mL, P < 0.001), and improvement in EF (24 ± 7% vs. 31 ± 10%, P < 0.001) when compared with baseline echocardiographic studies. A total of 188 subjects (64%) were classified as CRT responders (≥15% reduction in LVESV), with a higher rate of CRT response observed amongst those with an optimal LV lead position (71% vs. 29%, P < 0.001). A total of 70% of subjects were classified as clinical responders (≥1 grade improvement in NYHA class), with improvement in 6MWT (234 ± 100 m vs. 283 ± 108 m, P < 0.001) and MLHFQ (53 ± 22 vs. 34 ± 21, P < 0.001) when compared with baseline. Clinical response was also higher in subjects with an optimally placed LV lead (75% vs. 45%, P < 0.001).
Prediction of cardiac resynchronization therapy response using a multiparametric approach
Following univariate analysis (Table 2), the variables IVMD, RSD, GLS, and LV lead position were included in the final prediction model, derived from 214 (73%) subjects with a full data set. There was greatest incremental value from the addition of RSD and LV lead position to the model (Figure 1). The Hosmer–Lemeshow test was non-significant (χ2 = 12.1, P = 0.15), indicating good model fit. The p-score was calculated as follows: [0.022 × IVMD (ms)] + [0.034 × RSD (%)] – [0.13 × GLS (%)] – [2.3 if suboptimal LV lead, 0 if optimal LV lead]. The p-score ranged from −1.1 to 9.4 (mean 3.5 ± 1.9), differed between responders and non-responders (2.1 ± 1.5 vs. 4.1 ± 1.6, P < 0.001), and correlated with change in LVESV at 6 months (r = − 0.5, P < 0.001); Figure 2A and B. Higher p-scores were observed in those with QRS ≥150 ms (3.73 ± 1.9 vs. 2.9 ± 1.6, P = 0.002), and non-ischaemic aetiology (3.8 ± 1.9 vs. 3.1 ± 1.7, P = 0.006).
| Variable | OR | 95% CI | P-value | |
|---|---|---|---|---|
| Clinical characteristics | Age | 0.96 | 0.94–0.99 | 0.004 |
| Male | 0.68 | 0.38–1.2 | 0.18 | |
| QRS duration | 1.01 | 1.00–1.02 | 0.03 | |
| QRS duration >150 ms | 1.7 | 1.05–2.8 | 0.03 | |
| Ischaemic aetiology | 0.78 | 0.5–1.3 | 0.35 | |
| Diabetes | 0.82 | 0.5–1.4 | 0.5 | |
| Laboratory tests | Log10 Cr | 0.15 | 0.03–0.82 | 0.03 |
| Hb | 1.03 | 0.74–1.2 | 0.68 | |
| Baseline echocardiography | Filling ratio <0.4 | 0.13 | 0.01–2.14 | 0.15 |
| IVMD | 1.02 | 1.01–1.04 | <0.001 | |
| AS–PW delay/ms | 1.00 | 1.00–1.01 | 0.004 | |
| RSD (per 1%) | 1.03 | 1.02–1.04 | <0.001 | |
| LVEF | 1.03 | 0.99–1.07 | 0.08 | |
| GLS % | 0.8 | 0.79–0.97 | 0.008 | |
| TAPSE >14 mm | 1.8 | 0.94–3.5 | 0.08 | |
| LV lead characteristics | Apical LV lead | 0.98 | 0.45–2.14 | 0.95 |
| Remote LV lead | 0.4 | 0.3–0.57 | <0.001 |
- AS–PW delay, anteroseptal to posterior wall delay; CI, confidence interval; Cr, creatinine; GLS, global longitudinal strain; Hb, haemoglobin; IVMD, interventricular mechanical delay; OR, odds ratio; RSD, radial strain delay; TAPSE, tricuspid annular systolic excursion.
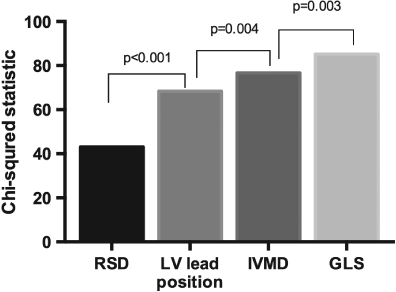

Intra- and interobserver variability for the echocardiographic parameters were as follows: 5.5% (9.4%) and 8% (14%) for calculation of the RSD; 5 ms (12%) and 7 ms (16%) for IVMD; and 1.25% (16%) and 1.9% (21%) for GLS.
Categorizing probability of cardiac resynchronization therapy response according to echocardiographic score
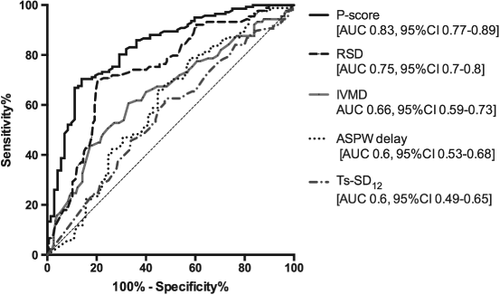
The cohort was stratified according to p-score into three clinically relevant groups to represent low, moderate, and high probability of LV remodelling after CRT. A comparison of expected and observed counts demonstrated good model calibration and is presented in Table 3 along with both the clinical and LV remodelling response for each of the p-score categories. Using ROC analysis [the area under the curve (AUC) was 0.83, 95% confidence interval (CI) 0.77–0.89, P < 0001; Figure 3], a lower cut-off value of 0.6 was selected in order to identify non-responders with the highest degree of certainty, given potential implications for clinical management (sensitivity 17%, 95% CI 9–27%; specificity 99%, 95% CI 96–100%; positive predictive valve 100%). A cut-off score >3.28 identified responders with the highest degree of certainty (sensitivity 70%, 95% CI 62–77%; specificity 86%, 95% CI 76–93%).
| p-score categories | <0.6 (n = 12) | 0.6–3.28 (n = 91) | >3.28 (n = 111) | |
|---|---|---|---|---|
| Model calibration | ||||
| Predicted count | 11 | 44 | 96 | |
| Observed count | 12 (1.00) | 42 (0.46) | 100 (0.86) | |
| Observed/predicted count | 1.1 | 0.95 | 1.04 | |
| Clinical response | P-value | |||
| NYHA class | ||||
| Baseline | 3.2 ± 0.4 | 3.1 ± 0.4 | 3.1 ± 0.4 | 0.5 |
| Follow-up | 2.9 ± 1.0 | 2.4 ± 0.8 | 1.9 ± 0.6 | <0.001 |
| Δ NYHA class | −0.2 ± 1.1 | −0.1 ± 1.5 | −0.7 ± 1.5 | 0.006 |
| MLHFQ score | ||||
| Baseline | 46 ± 22 | 50 ± 23 | 52 ± 21 | 0.4 |
| Follow-up | 38 ± 18 | 37 ± 23 | 30 ± 21 | 0.05 |
| Δ MLHFQ score | −3 | −14 | −22 | 0.01 |
| 6MWT | ||||
| Baseline | 210 ± 96 | 233 ± 100 | 241 ± 114 | 0.4 |
| Follow-up | 220 ± 94 | 273 ± 102 | 310 ± 115 | 0.008 |
| Δ 6MWT | −3 | 37 | 68 | 0.009 |
| LV remodelling response | ||||
| LVEDV (mL) | ||||
| Baseline | 203 ± 41 | 188 ± 74 | 186 ± 70 | 0.3 |
| Follow-up | 181 ± 71 | 160 ± 58 | 142 ± 49 | <0.001 |
| % Change | −7.5 | −11.5 | −16.2 | 0.7 |
| LVESV (mL) | ||||
| Baseline | 162 ± 38 | 145 ± 64 | 143 ± 59 | 0.2 |
| Follow-up | 154 ± 33 | 121 ± 62 | 95 ± 40 | <0.001 |
| % Change | −1.0 | −16.4 | −31 | <0.001 |
| LVEF (%) | ||||
| Baseline | 20 ± 6 | 24 ± 7 | 25 ± 7 | 0.1 |
| Follow-up | 23 ± 8 | 30 ± 10 | 35 ± 9 | <0.001 |
| Change | +3 | +5 | +10 | <0.001 |
- Observed count = observed cases/total number in predictive score (p-score) category.
- P-values are given for comparison across p-score groups.
- 6MWT, 6 min walk test; LVEDV, left ventricular end-diastolic volume; LVESV, left ventricular end-systolic volume; MLHFQ, Minnesota Living with Heart Failure Questionnaire.
The p-score also predicted LV remodelling in patients with an optimally placed LV lead only (ROC analysis AUC 0.8, 95% CI 0.71–0.89, P < 0.001). A cut-off score <1.8 had the highest specificity (97%, 95% CI 92–99%) to predict non-responders, i.e. low probability of response, and a score >3.5 predicted responders (sensitivity 70%, 95% CI 62–78%; specificity 83%, 95% CI 69–92%).
Comparison of the multiparametric predictive score with single echocardiographic predictors of cardiac resynchronization therapy response and relationship to long-term outcomes
The p-score compared favourably with individual indices of dyssynchrony, previously related to CRT response (Figure 3). When single echocardiographic parameters were considered, RSD (cut-off 40%) performed best (AUC 0.74; 95% CI 0.68–0.081, P < 0.001); however, a multiparametric approach using the p-score demonstrated greater accuracy to predict both responders and non-responders (AUC 0.83 vs. 0.74, P = 0.006).
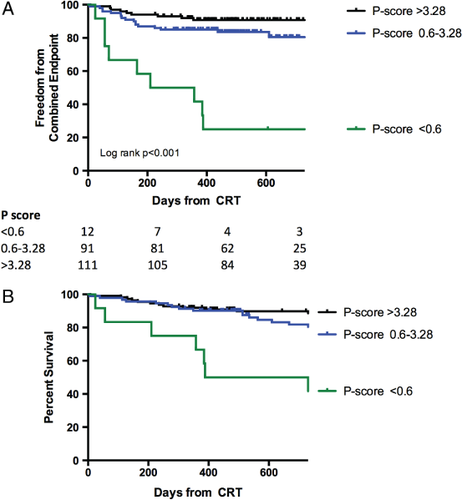
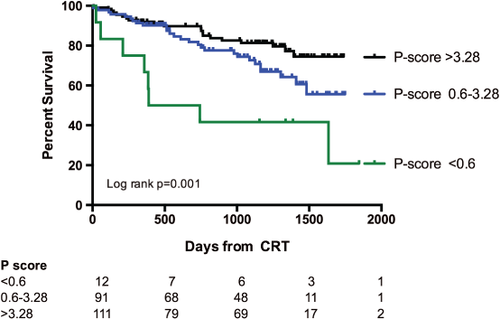
After 24 months follow-up duration, the group of patients with a p-score >0.6 demonstrated better survival than those with a p-score <0.6 (P < 0.001); there was no difference in survival between patients with a p-score >3.28 and those with a p-score 0.6–3.28 (P = 0.09). Patients with a p-score >3.28 had greater freedom from a combined endpoint of all-cause mortality and heart failure hospital admissions compared with those with a p-score of 0.6–3.28 (P = 0.047) and those with a p-score <0.06 (P < 0.001). This was driven by a lower rate of hospital admissions (Figure 4). During a median follow-up duration of 37 months (5 days to 60 months), there were a total of 56 deaths. Kaplan–Meier survival estimates according to p-score categories demonstrated better long-term survival in patients with a p-score >3.28 (P < 0.001) and a p-score 0.6–3.28 (P = 0.014) compared with a p-score <0.6 (Figure 5). Similarly, in patients with an optimally placed LV lead only, long-term survival was best in those with a score >3.28 (P = 0.02).
Discussion
This study demonstrates the ability of an echocardiographic-based score (p-score) to predict CRT remodelling responders and also non-responders in a derivation cohort of patients. The score is derived from both assessment of LV dysfunction, which forms the substrate for resynchronization, and whether or not the optimum site for the LV lead implantation is achieved. Follow-up data suggest that the score may also predict long-term survival. In subjects with a very low p-score, failure to respond to CRT was driven by the absence of echocardiographic dyssynchrony in the presence of a suboptimally positioned LV lead.
Mechanistic implications of score components
Cardiac resynchronization therapy corrects temporal mechanical dyssynchrony15, 19 in the presence of sufficient viable myocardium,20 which in turn enables LV remodelling to occur. This is best achieved by placing the LV lead near to the site of latest mechanical activation, away from segments of scar.11 Given that these components of successful CRT are intrinsically linked, the variables included in the derived score are mechanistically plausible.
Interventricular delay consistently relates to CRT remodelling response21 and has previously demonstrated enhanced specificity when combined with assessment of intraventricular dyssynchrony.22 RSD integrates intraventricular regional timings and peak amplitude of deformation, indirectly reflecting viability, providing a measure of potential contractile energy ‘wasted’ by either very early or late segments. The performance of RSD and other echocardiographic parameters designed to quantify wasted energy in derivation studies, such as the disco-ordination index9 or longitudinal strain delay,8 are promising as single predictors of response. However, in combination with other variables in the p-score, the diagnostic potential of RSD is enhanced. It is interesting to note that QRS duration did not feature in the final model and was not independent of echocardiographic measures of mechanical dyssynchrony. This reflects the role of QRS duration as an indirect marker of underlying mechanical dyssynchrony in patient selection for CRT.
The inclusion of GLS as a third echocardiographic variable is consistent with the need for a fully comprehensive assessment of LV performance. This incorporates a second vector of deformation, and the parameter GLS has been shown consistently to provide incremental prognostic value over biplane EF.23 Furthermore, GLS relates to the extent of myocardial scar burden defined by cardiac magnetic resonance imaging (MRI),24 and extensive scar is associated with poor outcomes after CRT.20
Finally, the impact of LV lead position in defining outcomes with CRT is further emphasized in the derivation of this p-score. Despite meeting the current established criteria for CRT patients, with a low p-score (<0.6) implying suboptimal LV lead position, limited inter- and intraventricular dyssynchrony and poor GLS did not achieve LV remodelling response and demonstrated impaired long-term survival.
Enhanced patient selection in cardiac resynchronization therapy and the role of prediction models
There has been interest in the development of reliable predictive models in CRT to refine patient selection further. The objective of improving CRT response rates remains an important goal to maximize individual patient benefit, given the potential morbidity of the procedure, and the wider implications related to health resource utilization.25 The ongoing issue of how best to define CRT response remains however. Achieving symptomatic response is an important outcome for the individual patient and may translate into reduced hospital admissions. In view of the recognized potential for placebo effect, the primary outcome in this study was LV remodelling response, which in turn relates to long-term survival.26 It has been suggested that for some eligible patients, particularly those without evidence of mechanical dyssynchrony or a suboptimal LV lead, CRT may not be benign.2 There is potential for worsening dyssynchrony, poor LV remodelling response, and worse long-term outcomes.27, 28 Given the strong clinical mandate for CRT in current guidelines, a more individualized approach may be used in order to better identify those individuals who will derive no advantage from CRT and even possible harm. The concept of a predictive score may help address this complex issue by stratifying the anticipated response to therapy.4
Previously published prediction scores by Goldenberg et al.,3 based on data from MADIT-CRT, and by Park et al.29 incorporate a number of baseline demographic, clinical, and echocardiographic variables. The MADIT-CRT score, derived from a population of less symptomatic patients at an earlier stage of heart failure, includes the following score variables: prior heart failure hospitalization, female gender, non-ischaemic aetiology, LBBB, QRS duration, LVEDV, and left atrial volume.3 Although not directly comparable with the current study population, these score variables are conceptually similar and incorporate indirect markers for underlying mechanical dyssynchrony, LV dysfunction, and scar. The study by Park et al. incorporates patients with more advanced symptomatic heart failure. Score constituents include: LV diastolic dimension, GLS, left atrial volume, RV size, RV fractional area change, and right atrial volume, and an optimal cut-off score predicted LV remodelling response with sensitivity 84% and specificity 79%. Although the p-score offers similar results, it is based on predictive echocardiographic measures that provide a direct physiological basis for CRT, and incorporates the novel concept of identifying patients unlikely to respond with a high degree of certainty.
Potential clinical application of a predictive score
The upper p-score category defined patients deriving greatest clinical benefit in terms of both clinical response and LV remodelling. Those in the lower category demonstrated minimal improvement in symptoms, no remodelling response, and particularly poor long-term survival at follow-up. Accordingly, these groups correspond to a very low, moderate, and high chance of achieving CRT response. Utilizing this approach prior to CRT implantation may identify a subset of patients (p-score <0.5) with minimal mechanical dyssynchrony where, if a suboptimal LV lead position is the only available option (e.g. the operator has limited available veins or issues with lead stability and phrenic nerve capture at the time of implant) with no viable alternative strategy (e.g. multipole lead or surgical approach), then it may be that CRT should be avoided.
In the moderate group (p-score 0.6–3.28), only half of the patients demonstrated remodelling response, and long-term survival was impaired in relation to those with a higher score. This perhaps identifies a subset of patients who require more careful monitoring following implantation, with greater attention to device optimization with regard to both the timing of electrical stimulation and ensuring a high percentage of LV pacing, with prompt early referral to advanced heart failure services where appropriate.
The echocardiographic parameters required are obtained from standard two-dimensional echocardiographic data sets, and can readily be incorporated into an individualized pre-procedure assessment algorithm to define both LV lead position and anticipated probability of response to CRT. This approach requires the acquisition of high quality data and operators experienced in echocardiographic analysis, best achieved in the context of a dedicated multidisciplinary CRT team comprising echocardiography, electrophysiology, and heart failure subspecialists in optimizing outcomes for these patients.30 Although final LV lead position cannot be accurately predicted prior to CRT implantation, perhaps limiting the role of this score in pre-implant decisions, data from randomized clinical trials of LV lead targeting suggest that achieving an optimal LV lead implant based on pre-implant imaging is possible in >80% of cases in the context of the specialist CRT team.11, 12
Limitations
This study has a number of limitations. The p-score is based on a single derivation cohort and use is limited to patients in sinus rhythm with moderate to severe heart failure. A prospective external validation of its performance is required to confirm value in a wider clinical setting. A proportion of patients were excluded from the derivation due to the limitations in feasibility of obtaining echocardiographic parameters, although this reflects day-to-day practice where not all patients have satisfactory echocardiographic windows. Alternative strategies, in particular cardiac MRI, may be required in order to overcome these issues. In addition to providing functional data, MRI is the current gold standard for assessment of scar and viability, and novel tissue tracking techniques offer future potential to replicate dyssynchrony parameters and are likely to have an expanding role in this field.
The use of a composite clinical score may better represent the heterogeneity observed in clinical improvement after CRT; however, the placebo effect of CRT may limit the use of symptoms and reported functional status. Variability and reproducibility in echocardiographic measurements outside of an experienced echo lab setting is a concern; however, the inclusion of multiple parameters in combination may help overcome this issue intrinsic to echocardiographic evaluation.
Finally, two cut-off values were selected in order to predict response or non-response with the greatest degree of certainty (high specificity and positive predictive value) and define probability of response to CRT rather than a dichotomous outcome. In the absence of a contemporaneous control group, and given limited patient numbers in our low response category, the p-score should not be used specifically to deny CRT. However, in patients where it suggests potential for harm, there should be careful consideration of all available treatment strategies.
Conclusion
A multiparametric predictive score (p-score), incorporating assessment of inter- and intraventricular dyssynchrony, underlying myocardial contractility, and position of the LV lead, allows identification of patients least likely to respond to CRT and relates to long-term survival. Although external validation is required, categories of low, moderate and high probability of response have the potential to impact individual patient care.
Acknowledgements
We are grateful to Dr Richard Parker for statistical advice.
Funding
This work was supported by the Cambridge NIHR Comprehensive Biomedical Research Centre.
Conflicts of interest: none declared.


