Prognostic impacts of serum uric acid levels in patients with chronic heart failure: insights from the CHART-2 study
Clinical trial registration: URL: http://www.clinicaltrials.gov. Unique identifier: NCT00418041.
Abstract
Aims
Prognostic impacts of serum uric acid (UA) levels in patients with chronic heart failure (CHF) remain inconclusive, especially for the whole range of serum UA levels.
Methods and results
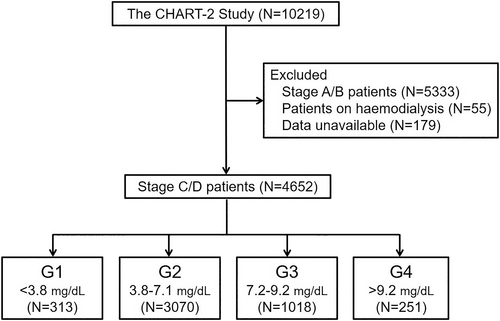
In the Chronic Heart Failure Registry and Analysis in the Tohoku District-2 (CHART-2) study, we enrolled 4652 consecutive patients with CHF and classified them into four groups based on baseline serum UA levels by the Classification and Regression Tree: G1 (<3.8 mg/dL, N = 313), G2 (3.8–7.1 mg/dL, N = 3070), G3 (7.2–9.2 mg/dL, N = 1018), and G4 (>9.2 mg/dL, N = 251). Mean age was 71 ± 12, 69 ± 12, 68 ± 13, and 69 ± 15 years in G1, G2, G3, and G4, respectively (P < 0.001). During the median follow-up of 6.3 years, in G1, G2, G3, and G4, 111 (35%), 905 (29%), 370 (36%), and 139 (55%) patients died and 79 (25%), 729 (24%), 300 (29%), and 115 (46%) experienced heart failure hospitalization, respectively (both P < 0.001). G1 was characterized by a significantly high prevalence of women as compared with G2, G3, and G4 (59%, 32%, 24%, and 23%, respectively). Serum creatinine levels (0.8 ± 0.4, 0.9 ± 0.4, 1.2 ± 0.6, and 1.4 ± 0.8 mg/dL, respectively), prevalence of atrial fibrillation (34%, 39%, 45%, and 50%, respectively), and diuretics use (36%, 45%, 67%, and 89%, respectively) increased from G1, G2, G3 to G4 (all P < 0.001), while left ventricular ejection fraction decreased from G1, G2, G3 to G4 (59 ± 15, 58 ± 15, 54 ± 15, and 52 ± 17%, respectively, P < 0.001). Multivariable Cox proportional hazards models showed that, as compared with G2, both G1 and G4 had increased incidence of all-cause death [adjusted hazard ratio (aHR) 1.34, 95% confidence interval (CI) 1.08–1.67, P = 0.009; aHR 1.28, 95% CI 1.02–1.61, P = 0.037, respectively] and heart failure admission (aHR 1.39, 95% CI 1.09–1.78, P = 0.008 and aHR 1.35, 95% CI, 1.06–1.71, P = 0.014, respectively). This U-shaped relationship was evident in the elderly patients. Furthermore, abnormal transitions to either higher or lower levels of serum UA from G2 were associated with increased mortality (aHR 1.29, 95% CI 1.06–1.57, P = 0.012; aHR 1.57, 95% CI 1.12–2.20, P = 0.009).
Conclusions
These results demonstrate that serum UA levels have the U-shaped prognostic effects and abnormal transitions to either higher or lower levels are associated with poor prognosis in the elderly patients with CHF.
Introduction
Relationships between serum uric acid (UA) and cardiovascular (CV) diseases have been reported for many years, and some reports indicated prognostic association.1-9 However, the usefulness of elevated serum UA as an independent risk marker of CV diseases and/or events is still controversial.1 Several epidemiological studies showed that both low and high serum UA levels were predictive of poor prognosis, indicating the J-shaped or U-shaped relationship between serum UA levels and CV events in the general2 and elderly3 populations as well as in patients with hypertension,4 diabetes mellitus,5 and haemodialysis.6 On the other hand, some studies reported a lack of relationship between serum UA levels and CV events.7 Recently, the number of patients with heart failure (HF) has been rapidly increasing, and this pandemic of HF has raised an emerging healthcare concern worldwide.10, 11 Many studies suggested that elevated serum UA levels are associated with poor prognosis in a relatively small CHF cohort.12-15 However, it is still inconclusive whether hyperuricaemia is a simple marker7 or a causative factor16 of worsening prognosis in patients with HF. To the best of our knowledge, few large-scale studies have examined the relationship between serum UA levels and long-term prognosis. Furthermore, no studies have addressed the prognostic effects of whole range of serum UA, and the prognostic significance of temporal changes in serum UA levels also remains to be examined. In the present study, we thus aimed to evaluate the association between serum UA levels and long-term prognosis in patients with CHF in our Chronic Heart Failure Registry and Analysis in the Tohoku District-2 (CHART-2) study.
Methods
Study design
The CHART-2 study is a prospective, multicentre, observational cohort study for HF in Japan, and the details have been described previously (UMIN:000000562, NCT00418041).17-20 Briefly, 10 219 consecutive stable patients aged ≥20 years with coronary artery disease (N = 868), asymptomatic structural heart disease (Stage B, N = 4475), and a current or past history of HF (Stage C/D, N = 4876) were registered from the 24 participating hospitals between October 2006 and March 2010. The diagnosis of HF was made by attending experienced cardiologists based on the criteria of the Framingham study,21 and stages of HF were determined according to the ACC/AHA guidelines.22 All of the patient information, including demography, medical history, laboratory, echocardiography, and angiography data, were recorded at the time of enrolment and annually thereafter by trained clinical research coordinators. The study protocol was approved by the local Ethics Committee of each participating hospital, and written informed consent was obtained from all patients. In the present study, we finally enrolled 4652 consecutive patients with CHF in Stage C/D after excluding 179 with insufficient data and 55 patients on haemodialysis. In the CHART-2 study, the use of UA lowering drugs and a therapeutic target of UA <6 mg/dL were considered to indicate hyperuricaemia at risk for gout, urolithiasis, and CV diseases, according to the Japanese guideline for management of hyperuricaemia and gout.23
Statistical analysis
All of the potential confounding factors were included in the univariable regression analysis, and factors were then selected using stepwise variable selection procedure. The covariates included in the present study that may have potentially influenced serum UA were as follows: age, sex, body mass index (BMI), systolic blood pressure, heart rate, smoking, New York Heart Association (NYHA) III/IV, HF admission, hypertension, diabetes mellitus, dyslipidaemia, atrial fibrillation, stroke, cancer, drinking history, ischaemic heart disease, left ventricular ejection fraction (LVEF), LV end-diastolic dimension (LVDd), blood chemistry data [serum levels of haemoglobin, creatinine, and brain natriuretic peptide (BNP)], and use of drugs [angiotensin-converting-enzyme inhibitors (ACE-Is), angiotensin II receptor blockers (ARBs), beta-blockers, calcium channel blockers, diuretics, statins, and UA lowering drugs]. The non-linear association between serum UA levels and mortality was evaluated by using an additive Cox proportional hazard regression model with a cubic spline curve using ‘mgcv’ package of R software. A cut-off point of serum UA levels was determined based on the results of the survival classification and regression trees (CART) with the ‘rpart’ and the ‘survival’ packages of the R software.24 The CART provides a binary decision tree for classification and regression based on recursive partitioning of the data space and sequentially determines conditioning variables and their splitting points for partitioning to fit a simple prediction model within each partition.24 The survival CART is the CART considering survival time as an outcome.25 We determined cut-offs of serum UA levels using survival CART analysis. We compared the baseline characteristics and the prognosis among patient groups. Descriptive statistics, including mean ± SD, frequency (percentage) for continuous, and categorical data, are given according to the groups. Triglyceride (TG), BNP, and C-reactive protein are described as median (interquartile range) due to skewed distribution. Group comparisons were performed using ANOVA and Kruskal–Wallis test for continuous variables and Fisher's exact test for categorical variables. Survival curves were estimated using the Kaplan–Meier procedure and compared with log-rank test adjusted by the Bonferroni correction for P value. We also estimated incidence of CV death and non-CV death on the basis of 1000 person-years. To determine independent predictors of mortality of patients with HF, multivariable Cox proportional hazards regression models were applied in each serum UA groups with the following variables using stepwise variable selection procedure: age, sex, BMI, heart rate, NYHA III/IV, HF admission, hypertension, diabetes mellitus, atrial fibrillation, stroke, cancer, drinking history, ischaemic heart disease, LVEF, haemoglobin, creatinine, ACE-I/ARBs, beta-blockers, calcium channel blockers, diuretics, and statins. Subgroup analyses were performed, and the interaction of each subgroup including age, sex, LVEF, estimated glomerular filtration rate, nutrition status assessed by controlling nutritional status score, ischaemic heart disease, diuretics, and UA lowering agents was evaluated. Among the patients who had serum UA levels at both baseline and 1 year follow-up, transitions among the groups from baseline to 1 year were determined, and then the relationship between the transitions and long-term prognosis thereafter was examined with Kaplan–Meier procedure and multivariable Cox proportional hazards models. To evaluate the factors associated with UA category transitions at 1 year, multinomial logistic regression analysis was performed with the following covariates: age, sex, BMI, smoking, drinking history, ischaemic heart disease, hypertension, diabetes mellitus, dyslipidaemia, atrial fibrillation, stroke, cancer, HF admission, NYHA III/IV, systolic BP, heart rate, LVEF, LVDd, serum levels of haemoglobin, creatinine, and BNP, and use of ACE-Is, ARBs, beta-blockers, calcium channel blockers, diuretics, UA lowering drugs, and statins at baseline. Two-sided P < 0.05 was considered to be statistically significant. These statistical analyses were performed using the open-source statistics computing R software (version 3.5.3) (R Foundation for Statistical Computing, Vienna, Austria).
Results
Patient characteristics
Based on the cut-off values determined by the CART, 4652 patients were divided into four groups: G1 (<3.8 mg/dL, N = 313), G2 (3.8–7.1 mg/dL, N = 3070), G3 (7.2–9.2 mg/dL, N = 1018), and G4 (>9.2 mg/dL, N = 251) (Figure 1). At enrolment, 821 patients (18%) were treated with UA lowering drugs: uricosuric drugs for 180 (4%) and UA synthesis inhibitor for 641 (14%) (Supporting Information, Figure S1). Table 1 shows baseline patient characteristics. Mean age in G1, G2, G3, and G4 was 71 ± 12, 69 ± 12, 68 ± 13, and 69 ± 15 years, respectively (P < 0.001). G1 was characterized by a significantly higher prevalence of women as compared with the other three groups. Serum creatinine levels, prevalence of atrial fibrillation, and frequency of diuretics use increased from G1, G2, G3 to G4, while LVEF decreased from G1, G2, G3 to G4. Median BNP levels were comparably low in G1 and G2 and then increased to G3 and G4. As a HF aetiology, prevalence of ischaemic heart disease was highest in G2 and lowest in G4 while that of dilated cardiomyopathy increased from G1, G2, G3 to G4. These trends were also noted in the subgroups divided by age 70 years (Supporting Information, Table S1A,B), although patients aged ≥70 years were characterized by higher prevalence of women and atrial fibrillation, higher BNP levels, higher frequency of diuretic use, and more impaired renal function, as compared with those aged <70 years (Supporting Information, Table S1C).
| G1 (N = 313) | G2 (N = 3070) | G3 (N = 1018) | G4 (N = 251) | P value | |
|---|---|---|---|---|---|
| Age (years) | 70.7 ± 11.9 | 69.3 ± 11.7 | 67.5 ± 13.1 | 68.9 ± 15.3 | <0.001 |
| Female, n (%) | 186 (59.4) | 993 (32.3) | 244 (24.0) | 57 (22.7) | <0.001 |
| BMI (kg/m2) | 22.7 ± 3.7 | 23.8 ± 3.7 | 24.2 ± 4.1 | 23.3 ± 4.2 | <0.001 |
| Smoking, n (%) | 83 (28.3) | 1333 (45.9) | 513 (52.9) | 117 (50.0) | <0.001 |
| Aetiology of chronic HF, n (%) | |||||
| Ischaemic heart disease | 150 (47.9) | 1606 (52.3) | 484 (47.5) | 96 (38.2) | <0.001 |
| Dilated cardiomyopathy | 34 (10.9) | 362 (11.8) | 165 (16.2) | 49 (19.5) | <0.001 |
| Hypertrophic cardiomyopathy | 14 (4.5) | 89 (2.9) | 25 (2.5) | 7 (2.8) | 0.336 |
| Hypertensive heart disease | 51 (16.3) | 575 (18.7) | 203 (19.9) | 60 (23.9) | 0.109 |
| Valvular heart disease | 37 (11.8) | 283 (9.2) | 86 (8.4) | 28 (11.2) | 0.222 |
| Clinical history, n (%) | |||||
| Hypertension | 265 (84.7) | 2745 (89.4) | 932 (91.6) | 214 (85.3) | 0.002 |
| Diabetes mellitus | 113 (36.1) | 1209 (39.4) | 406 (39.9) | 102 (40.6) | 0.644 |
| Dyslipidaemia | 237 (75.7) | 2500 (81.4) | 851 (83.6) | 203 (80.9) | 0.024 |
| Atrial fibrillation | 107 (34.2) | 1194 (38.9) | 458 (45.0) | 125 (50.0) | <0.001 |
| Stroke | 61 (19.5) | 623 (20.3) | 192 (18.9) | 62 (24.7) | 0.225 |
| Cancer | 49 (15.7) | 402 (13.1) | 133 (13.1) | 33 (13.1) | 0.620 |
| HF admission | 141 (45.2) | 1471 (47.9) | 643 (63.2) | 193 (76.9) | <0.001 |
| NYHA class Ⅲ/Ⅳ, n (%) | 38 (12.2) | 295 (9.7) | 120 (11.8) | 57 (22.7) | <0.001 |
| Previous treatments, n (%) | |||||
| PCI | 94 (30.0) | 1055 (34.4) | 283 (27.8) | 48 (19.2) | <0.001 |
| CABG | 28 (8.9) | 279 (9.1) | 84 (8.3) | 30 (12.0) | 0.330 |
| Haemodynamics | |||||
| Systolic BP (mmHg) | 124.9 ± 19.0 | 126.9 ± 18.7 | 125.1 ± 19.1 | 122.7 ± 22.0 | 0.001 |
| Diastolic BP (mmHg) | 71.1 ± 11.3 | 72.4 ± 11.7 | 72.6 ± 12.7 | 68.9 ± 12.3 | <0.001 |
| Heart rate (b.p.m.) | 72.1 ± 15.0 | 71.8 ± 14.4 | 72.8 ± 15.3 | 73.7 ± 16.8 | 0.095 |
| LVEF (%) | 58.9 ± 15.4 | 57.6 ± 15 | 54.4 ± 15.4 | 51.6 ± 16.6 | <0.001 |
| LVDd (mm) | 49.8 ± 8.8 | 51.6 ± 8.8 | 53.6 ± 9.9 | 54.3 ± 10.3 | <0.001 |
| Laboratory data | |||||
| LDL-C (mg/dL) | 105.66 ± 29.96 | 105.43 ± 29.9 | 108.29 ± 32.45 | 113.75 ± 37.78 | <0.001 |
| HDL-C (mg/dL) | 55 ± 15.84 | 51.95 ± 15.24 | 49.6 ± 15.52 | 48.25 ± 14.99 | <0.001 |
| Triglyceride (mg/dL) | 90 (67.5, 125) | 106 (77, 150) | 118 (85, 171) | 118 (78, 176.5) | <0.001 |
| Haemoglobin (g/dL) | 12.7 ± 1.68 | 13.27 ± 1.9 | 13.29 ± 2.07 | 12.65 ± 2.46 | <0.001 |
| Uric acid (mg/dL) | 3.18 ± 0.48 | 5.62 ± 0.89 | 7.96 ± 0.57 | 10.31 ± 0.97 | <0.001 |
| Creatinine (mg/dL) | 0.77 ± 0.37 | 0.93 ± 0.38 | 1.16 ± 0.58 | 1.41 ± 0.76 | <0.001 |
| Total protein (g/dL) | 7.05 ± 0.63 | 7.16 ± 0.59 | 7.19 ± 0.64 | 7.14 ± 0.74 | 0.007 |
| Albumin (g/dL) | 3.96 ± 0.52 | 4.09 ± 0.46 | 4.06 ± 0.5 | 3.93 ± 0.56 | <0.001 |
| HbA1c (%) | 6.36 ± 1.17 | 6.3 ± 0.99 | 6.27 ± 0.89 | 6.29 ± 1.01 | 0.644 |
| BNP (pg/mL) | 94.4 (38.6, 193.5) | 91.5 (38.3, 212) | 130 (48.4, 281) | 192.5 (77.4, 424.6) | <0.001 |
| CRP (mg/dL) | 0.7 (0.6, 0.9) | 0.9 (0.7, 1) | 1 (0.8, 1.3) | 1.2 (1, 1.6) | <0.001 |
| Medical treatment, n (%) | |||||
| ACE-I/ARBs | 188 (60.1) | 2,217 (72.2) | 788 (77.4) | 196 (78.1) | <0.001 |
| Beta-blockers | 129 (41.2) | 1448 (47.2) | 584 (57.4) | 135 (53.8) | <0.001 |
| Calcium channel blockers | 121 (38.7) | 1224 (39.9) | 389 (38.2) | 85 (33.9) | 0.259 |
| Diuretics | 114 (36.4) | 1390 (45.3) | 681 (66.9) | 224 (89.2) | <0.001 |
| UA lowering drugs | 64 (20.4) | 538 (17.5) | 182 (17.9) | 37 (14.7) | 0.384 |
| Statins | 114 (36.4) | 1256 (40.9) | 375 (36.8) | 55 (21.9) | <0.001 |
- Continuous variables are expressed as mean ± standard deviation, except BNP, CRP levels, and triglyceride, which are expressed as median with interquartile range. ACE-Is, angiotensin-converting enzyme inhibitors; ARBs, angiotensin II receptor blockers; BMI, body mass index; BNP, brain natriuretic peptide; BP, blood pressure; CABG, coronary artery bypass graft; CRP, C-reactive protein; HDL-C, high density lipoprotein cholesterol; HF, heart failure; LDL-C, low density lipoprotein cholesterol; LVDd, left ventricular diastolic dimension; LVEF, left ventricular ejection fraction; NYHA, New York Heart Association; PCI, percutaneous coronary intervention; UA, uric acid.
Clinical factors related to serum uric acid levels
Supporting Information, Table S2 shows the factors related to serum UA levels in the multivariable regression analysis. Serum UA levels were positively related to serum creatinine levels, use of diuretics, dyslipidaemia, hypertension, HF admission, atrial fibrillation, smoking, BNP, and BMI while negatively related to female sex, statin use, diabetes mellitus, age, and LVDd.
Association of serum uric acid levels with prognosis
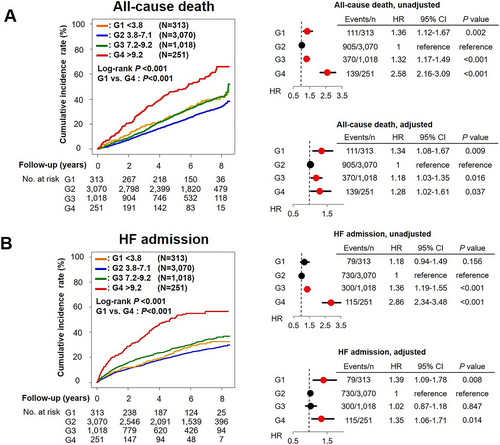
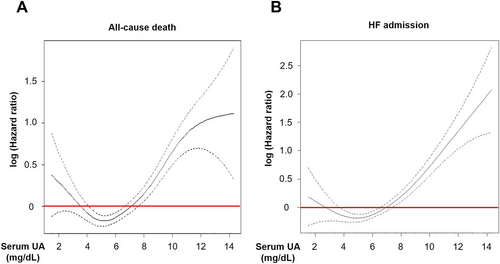
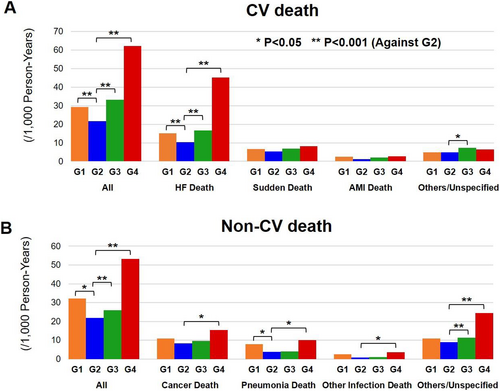
During the median follow-up period of 6.3 years, 111 (35%), 905 (29%), 370 (36%), and 139 (55%) patients died, and 79 (25%), 729 (24%), 300 (29%), and 115 (46%) experienced HF admission in G1, G2, G3, and G4, respectively (both P < 0.001). The Kaplan–Meier curves and the univariable Cox proportional hazards models showed that G4 had higher incidence of both all-cause death and HF admission than other groups [hazard ratio (HR) 2.58, 95% confidence interval (CI) 2.16–3.09, P = 0.037 and HR 2.86, 95% CI 2.34–3.48, both P < 0.001, respectively] (Figure 2). It was noted that G1 also had higher incidence of all-cause death, but not of HF admission, than G2 (HR 1.36, 95% CI 1.12–1.67, P = 0.002 and HR 1.18, 95% CI 0.94–1.49, P = 0.156, respectively). The cubic spline model indicated the J-shaped association between serum UA levels with all-cause death and with HF admission (Figure 3). The incidence of all-cause death (G1, 67.5/1000 person-years; G2, 50.2/1000 person-years; G3, 65.9/1000 person-years; and G4, 125.4/1000 person-years) and HF admission (G1, 54.7/1000 person-years; G2, 45.3/1000 person-years; G3, 62.4/1000 person-years; and G4, 140.3/1000 person-years) also showed the J-shaped association. The J-shaped relationship among the serum UA groups was also noted for both CV and non-CV death, particularly for HF death (G1, 15.2/1000 person-years; G2, 10.4/1000 person-years; G3, 16.7/1000 person-years; and G4, 45.1/1000 person-years) (Figure 4).
U-shaped relationship between serum uric acid levels and mortality
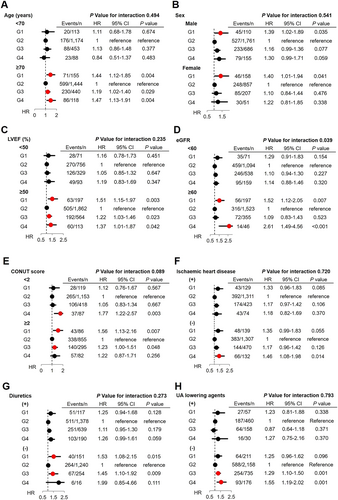
The multivariable Cox proportional hazards models adjusted for clinical backgrounds showed that, as compared with G2, G1 patients had increased risk for all-cause death and HF admission (HR 1.34, 95% CI 1.08–1.67, P = 0.009 and HR 1.39, 95% CI 1.09–1.78, P = 0.008, respectively), which was almost comparable with those in G4 (HR 1.28, 95% CI 1.02–1.61, P = 0.037 and HR 1.35, 95% CI 1.06–1.71, P = 0.014, respectively), indicating the U-shaped relationship rather than the J-shaped one, between serum UA levels and long-term prognosis (Figure 2). Importantly, subgroup analysis showed that the relationship between serum UA groups and mortality differs by renal function and tended to differ by nutrition status. The U-shaped association was evident in patients without chronic kidney disease (CKD) but not in those with CKD. Moreover, the U-shaped relationship was evident only for elderly patients aged ≥70 years (Figure 5). The relationship between serum UA groups and mortality did not differ by sex, LVEF, ischaemic heart disease, use of UA lowering drugs, or use of diuretics (Figure 5).
Temporal changes in serum uric acid levels and subsequent prognosis
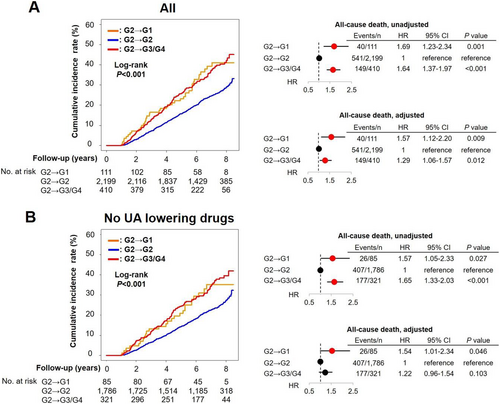
We further examined the prognostic influence of temporal changes in serum UA levels in G2 patients at baseline. As compared with those who remained in G2 at 1 year, those who transitioned to G1 at 1 year were characterized by a higher prevalence of women, stroke, NYHA III/IV, smaller LVDd, and lower frequency of diuretics use (Supporting Information, Tables S3 and S4). In contrast, those who transitioned to G3/G4 at 1 year were characterized by a higher prevalence of men, smoker, stroke, HF admission, NYHA III/IV, larger LVDd, higher creatinine, BNP, higher frequency of ACE-I/ARBs, and diuretics use (Supporting Information, Tables S3 and S4). The multinomial logistic regression analysis showed that female sex and NYHA III/IV were positively associated with transition from G2 to G1 at 1 year, while female sex, haemoglobin, and use of UA lowering drugs were negatively associated, and smoking, BNP, and use of diuretics were positively associated with transition from G2 to G3/G4 at 1 year (Supporting Information, Table S5). As compared with remaining in G2, transitions to G1 and G3/G4 at 1 year follow-up were associated with increased risk of the endpoint, indicating the U-shaped relationship in the absence of UA lowering drugs. However, the multivariable Cox proportional hazards models showed that only decrease, but not increase, in serum UA levels in the absence of UA lowering drugs was associated with increased mortality (Figure 6).
Discussion
In the present study, we examined the clinical outcomes of patients with CHF among the groups divided by serum UA levels in the CHART-2 study, the large-scale, prospective, and observational study for HF in Japan. The results clearly demonstrated that both low and high serum UA levels were significantly associated with poor prognosis in patients with CHF, indicating the U-shaped association between serum UA levels and long-term prognosis.
Clinical backgrounds associated with serum uric acid levels
In the general population, many epidemiological studies have shown that hyperuricaemia is a clinically important risk factor of lifestyle-related diseases.1-9, 26 Factors related to hyperuricaemia include hypertension,27 CKD,28 cerebrocardiovascular disease,29 metabolic syndrome,30 and use of diuretics.31 Of note, diuretic use is a clinically important factor to induce hyperuricaemia via increasing UA reabsorption and decreasing UA secretion.32 In addition, it has been recently reported that HF is related to hyperuricaemia.31, 33 Hypoxaemia due to HF has been reported to increase xanthine oxidase activity in cardiomyocytes and endothelial cells, resulting in increased oxidative stress and cardiac and endothelial dysfunctions, resulting in deterioration of HF.14, 34 However, the detailed mechanisms of hyperuricaemia in patients with HF remain to be elucidated. In the present study, patients with high serum UA levels were characterized by male sex, dyslipidemia, DCM, atrial fibrillation, history of HF admission, use of diuretics, low LVEF, and large left ventricle, indicating that high UA level is, at least in part, associated with severe clinical status of lifestyle-related diseases.
It has been reported that decreased UA production or decreased renal tubular reabsorption due to inherited or acquired disorders may cause hypouricaemia.35 However, the mechanisms of hypouricaemia also remain to be elucidated, especially in patients with HF. In the present study, patients with low serum UA levels were characterized by older age, women, low BMI, non-smokers, use of statins, and diabetes. Among them, diabetes mellitus may play an important role to reduce UA levels, because (i) higher serum UA levels were inversely associated with diabetes mellitus in the general population36 and (ii) high glucose levels inhibit UA reabsorption in the proximal tubule in diabetic patients.37 In addition, genetic backgrounds may cause hypouricaemia. For example, genetic abnormalities in urate transporter 138 and glucose transporter 939 have been reported to cause hypouricaemia in humans.
Serum uric acid levels and long-term prognosis of patients with heart failure
One of the novel findings of the present study is that not only high but also low serum UA levels were associated with increased incidence of all-cause death and HF admission in patients with CHF. Although a recent study showed the U-shaped association between the whole range levels of serum UA and prognosis in the general population,2 it remains unclear whether this is also the case in patients with HF, because the previous studies just showed the association between high UA levels and poor prognosis in patients with HF.13, 14, 40, 41 However, these studies compared prognosis among patients with HF divided by tertile, quartile, or arbitrarily determined UA cut-off values13, 14, 40, 41 and thus might have overlooked negative prognostic impacts of low UA levels, because the proportion of patients with HF who had low UA and poor prognosis could be very small. Indeed, even in our study cohort, we were not able to find any prognostic impact of lower serum UA group when we divided patients with HF by the tertiles or quartiles (data not shown), possibly because the proportion of our lowest UA group with poor prognosis, determined by survival CART (G1, <3.8 mg/dL), was only 6.7% (313 out of 4652 patients), which was much smaller than one third or one quarter. Thus, we may consider that the use of survival CART enabled us to discern a small proportion of patients with HF who had both low serum UA levels and poor prognosis and firstly reveal the U-shaped relationship between serum UA levels and prognosis in HF population. It is also noteworthy that, even among the patients with intermediate serum UA levels, a subsequent decrease in serum UA levels was associated with poor prognosis in the present study. This finding underlines the prognostic impact of low or decreasing UA levels and thus is of clinical significance. Indeed, no studies have examined the association between transition of serum UA levels and long-term prognosis, although one study examined the relationship between 1 year changes in serum UA levels and related parameters and medical conditions.42
The mechanisms of the relation between low UA levels and poor prognosis in patients with HF remain to be elucidated. In the present study, low serum UA levels were characterized by many of negative prognostic factors, including older age, low BMI, and diabetes mellitus, all of which are negative prognostic factors in patients with HF in the CHART-2 study.18, 20, 43 Thus, it is conceivable that the clinical conditions causing low UA levels, but not the low serum UA levels themselves, result in poor prognosis in patients with HF in the present study. On the other hand, possible direct role of hypouricaemia in patients with HF still remains to be elucidated. It has been reported that serum UA levels have a potent antioxidant activity in humans44, 45 and that acute and marked decrease in UA levels in healthy male subjects with oral febuxostat or intravenous rasburicase alters endothelium-dependent microvascular vasodilation and markedly reduces myeloperoxidase activity as compared with moderate UA reduction.46 Furthermore, extremely low levels of serum UA caused by genetic mutations could also induce endothelial dysfunction.47 These lines of evidence suggest the clinical importance to manage hypouricaemia, and thus, clinical studies to intervene hypouricaemia are warranted. Furthermore, monitoring serum UA levels after prescribing UA lowering drugs appears to be important because excessive reduction of serum UA by UA lowering drugs could have adverse effects.48
The present study also demonstrates that the prognosis of patients with HF whose serum UA levels were decreased from baseline to 1 year was poor even in the absence of UA lowering drugs use and that female sex and NYHA III/IV clinical symptoms were related with the temporal decrease in serum UA level. Thus, further studies are warranted to investigate how we should manage patients with these characteristics.
Subgroup analyses
Regarding the prognostic relationship, serum UA levels had significant interactions with age. We found that patients aged ≥70 years, but not those aged <70 years, had a U-shaped relationship between serum UA and mortality. This finding is clinically important because in the present study, the U-shaped relationship in the elderly patients with CHF was shown for the first time. In the general population, it has been reported that malnourished older people had lower serum UA levels as compared with the healthy elderly49 and that low UA levels predicted higher all-cause and CV disease-related mortality in the elderly, particularly in those with malnourishment.3 Indeed, the relationship between serum UA groups and mortality tended to differ by nutrition status in the present study. Considering the lack of relationship between serum UA levels and prognosis in patients aged <65 years, management of aging-related factors may prevent hypouricaemia and subsequently improve prognosis of patients with HF.
The present study also showed that serum UA levels had significant prognostic interactions with renal function: the U-shaped relationship between serum UA levels and prognosis was evident in patients with HF without CKD but not in those with CKD. Unlike hypouricaemia, it has been reported that hyperuricaemia has a consistent association with poor prognosis in patients without CKD.12, 14 Indeed, patients without CKD have normal UA excretion and thus are easily prone to increased UA production, resulting in hyperuricaemia via increased xanthine oxidase activity.12 However, it is unclear why renal dysfunction is associated with a lack of prognostic significance of serum UA levels in the present study. It was noted that the use of diuretics did not interact with the relationship between serum UA levels and prognosis, although diuretic use could often increase serum UA levels and worsen renal function.32
Sex difference may be an important issue when considering the relationship between serum UA levels and prognosis although we found no prognostic impact of sex difference in the present study. It was reported that risk of congestive HF is gradually increased with increase in serum UA levels in men but not in women in the general population.50 In addition, it was reported that high serum UA levels were an independent predictor of mortality in women but not in men.40 Thus, this issue remains to be further examined in future studies.
Study limitations
Several limitations should be mentioned for the present study. First, because the CHART-2 study is an observational study for CHF in Japan, there needs a caution when generalizing the present findings to other populations in different countries and/or populations. In particular, because the CHART-2 study enrolled stable CHF population, validation studies are warranted in patients with acute HF or those with CHF in more severe clinical conditions. Second, the sample size in our study might not have enough statistical power to evaluate the association between UA lowering drugs and prognosis in patients with HF. Lastly, the pathophysiology of hypouricaemia including hereditary factors was not examined in the present study.
Conclusions
The present study demonstrates that serum UA levels have the U-shaped prognostic effects, and both temporal transitions to abnormally lower or higher levels are also associated with poor prognosis in the elderly patients with HF.
Acknowledgements
We thank all the members of the Tohoku Heart Failure Association, the CHART-2 Investigators, and the staff of the Departments of Cardiovascular Medicine and Evidence-Based Cardiovascular Medicine, Tohoku University Graduate School of Medicine for their contributions (Supporting Information).
Conflict of interest
The Department of Evidence-Based Cardiovascular Medicine, Tohoku University Graduate School of Medicine is supported in part by unrestricted research grants from Daiichi Sankyo (Tokyo, Japan), Bayer Yakuhin (Osaka, Japan), Kyowa Hakko Kirin (Tokyo, Japan), Novartis Pharma (Tokyo, Japan), Dainippon Sumitomo Pharma (Osaka, Japan), Astellas Pharma (Tokyo, Japan), AstraZeneca (Osaka, Japan), Chugai Pharmaceutical (Tokyo, Japan), GlaxoSmithKline (Tokyo, Japan), Kowa Pharmaceutical (Tokyo, Japan), Mitsubishi Tanabe Pharma (Osaka, Japan), Mochida Pharmaceutical (Tokyo, Japan), MSD (Tokyo, Japan), Nippon Boehringer Ingelheim (Tokyo, Japan), Otsuka Pharmaceutical (Tokyo, Japan), Shionogi (Osaka, Japan), and Takeda Pharmaceutical (Osaka, Japan). H. S. has received lecture fees from Bayer Yakuhin (Osaka, Japan) and Daiichi Sankyo (Tokyo, Japan).
Funding
This study was supported in part by the Grants-in Aid from the Japanese Ministry of Health, Labour, and Welfare and the Japanese Ministry of Education, Culture, Sports, Science, and Technology and the Agency for Medical Research and Development (15ek0210043h0001, 16ek0210056h0001, and 16ek0210043h0002), Tokyo, Japan.


