Structural damage identification based on pattern matching using the flexibility change rate
Abstract
In this paper, a rapid identification method for postearthquake structural damage is proposed based on pattern matching using the flexibility change rate. In the first stage, a small number of dynamic signals are collected for extracting the modal information, which is used as a reference for model updating. Using the updated finite element model of the structure to be monitored, the characteristic vector of the flexibility change rate is calculated by modal analysis from the first two orders of modal information of various damage scenarios to establish a pattern database. For the real structure, the measured responses are used to identify the modal parameters to calculate the flexibility change rate characteristic vector, which is treated as the observed pattern. Then, the similarity between the observed pattern and the pattern in the pattern database is calculated using the Euclidean distance (ED). The damage location and severity of the measured structure are treated to be the same as the pattern corresponding to the minimum value of ED, so that the damage is identified. Numerical simulations and experiments of two types of concentrated mass structures, four floors, and six floors confirm that the proposed method can identify the damage well. In addition, the matching results based on different sensor combinations demonstrate that the method can quickly identify the damage location and severity of a structure even using a limited number of sensors. The proposed method can provide support for the government in rapid postearthquake emergency decision-making.
1 INTRODUCTION
Earthquakes represent one of the most common natural disasters in the world, and have been extensively researched in the past decades. Seismic research has gradually led to three major work systems: earthquake monitoring and forecasting, earthquake disaster defense, and earthquake emergency rescue. The timeliness of structural postearthquake safety assessment is the primary consideration for emergency rescue. Research on the rapid identification and assessment of postearthquake damage for city clusters can provide a scientific theoretical basis for postearthquake emergency decision-making and emergency rescue. It improves the response of the government to earthquake emergencies and the efficiency of postearthquake emergency disposal to minimize human casualties and economic losses.
As a challenging research topic, structural damage identification plays an important role in structural safety monitoring and assessment. In the past decades, many structural damage identification methods have been developed. They mostly follow the basic principle that the dynamic response of a system varies with its physical characteristics. Traditional damage identification methods determine the location and severity of damage by assessing the change of structural damage indicators. It can be divided into frequency-domain analysis methods, time-domain analysis methods, and time–frequency domain analysis methods according to the different signal identification domains. The frequency-domain analysis methods1 convert signals from the time domain into the frequency domain to study the dynamic characteristics of the system and the time-domain analysis methods2-7 directly use the time-domain signal of vibration response, avoiding errors caused by the conversion process. On the other hand, the time–frequency domain analysis methods5 can analyze the distribution of signals in the time and frequency domains. In contrast to the traditional methods, the pattern-matching method originated from the data integration area that utilizes the comparison of the expected pattern and the observed pattern to determine whether they are the same or not.8
This paper proposes a rapid damage identification method for postearthquake structures based on pattern matching using the flexibility change rate, which uses a limited number of sensors for pattern matching. Structural damage identification usually requires the installation of a large number of sensors and is costly; also, it is difficult to process redundant data. In recent years, researchers have shifted their focus to developing methods that use a limited number of sensors. Zhang and Zhu.9 defined the damage index by using the signals collected by two sensors based on the motion window correlation coefficient of signals and effectively identified the damage location of the structure. Nie et al.10 proposed a mobile embedded principal component analysis method for long-term bridge monitoring. It has been proven that the occurrence of structural damage can be monitored successfully with only one sensor. Therefore, the use of finite sensors to identify structural damage has become a major problem that needs to be considered in practical work.
At present, pattern-matching methods are applied in various fields.11 However, with great prospects for development, there are limited studies in the field of structural damage identification. As a new avenue of development, applying pattern matching to damage identification needs to build a damage pattern database including various damage scenarios of the structure. The pattern database is composed of characteristic vectors for different damage scenarios that are extracted from the finite element model (FEM) of the structure to be monitored. It is essential that the damage location and severity of the measured structure are the same as the best matching pattern between the measurement vector and the database. The normalized continuous wavelet transform (CWT) coefficient vectors and Wavelet Packet Transform (WPT) energy variation vectors are separately taken as the damage characteristic vectors to develop pattern databases by researchers.12 With autoregressive (AR) time series coefficients as characteristic vectors, the damage is identified by comparing the AR model coefficients to the database of the auto-regressive and auto-regressive with exogenous input (AR-ARX) model on the undamaged structures.13 Using strain as the characteristic vector, the pattern-matching method has been experimentally validated with metal plate structures.14 The estimated displacement response is matched with the database by correlation coefficients to locate damage.15 The normalized frequency ratios (NFRs) are stored in the database used to match the optimum crack location and crack depth values.16
Given the above issues, if using the time domain or the damage feature parameters related to the excitation factors as the characteristic vectors, it is hard to establish a comprehensive damage pattern database because the computational volume is very large and the pattern database is infinite due to the randomness of the response and external loading. Therefore, for the structural condition assessment or damage identification in real structures, the characteristic vectors used for the pattern matching should be the inherent properties of the structure itself, such as structural mode, or modal-related parameters, which always maintain constant values even though the external excitation varies in different environments. In this way, the pattern database can be easily established by the modal analysis in the FEM. For the real structure to be monitored, the observed pattern can also be established by the advanced modal parameter identification method using the field-measured responses. It is worth noting that the calculation process of pattern matching is very fast because we just need to calculate the similarity of the characteristic vectors, rather than the complex parameter calculations such as CWT, AR-ARX, and so on in conventional damage identification methods. Further, the pattern matching method has the ability to identify the damage severity because the damage pattern database contains the data of the scenarios with different damage locations and severities. For the above-mentioned reasons, the pattern-matching method can meet the rapid identification requirements of the postearthquake emergency assessment.
In this paper, a rapid structural damage identification based on pattern matching using the flexibility change rate is proposed. Based on the modal information, the flexibility change rate can eliminate the influence of excitation. Therefore, the flexibility change rate is used as the characteristic vector. When the target FEM is obtained by model updating, the pattern database of the structure is established quickly by modal analysis, and the measured characteristic vector is subsequently obtained by measured responses. The location and severity of the measured structure are the same as the pattern corresponding to the minimum value of the Euclidean distance (ED).
The rest of the paper is organized as follows: the methodology of pattern matching using the flexibility change rate is presented in Section 2. To verify the feasibility and effectiveness of the proposed method, the results of the numerical simulations and experiment are shown in Sections 3 and 4, separately. Finally, the conclusions are summarized in Section 5.
2 METHODOLOGY
2.1 Pattern matching
In the field of data integration, pattern matching is to find the mapping relationship between the elements in two pattern databases. Driven by network technology, there has been considerable advancement in pattern matching in recent years. Especially in the age of big data, it is becoming increasingly important in various fields. The main application areas of pattern matching are statement query, update information, geographic information integration, medical education, and so on. For example, a pattern-matching method based on the positions of attributes is proposed and applied in query statements.17 The method mentioned above is divided into three steps: design a matrix to record the statistics, use two scoring functions to measure the similarities, and find the optimal mapping. In the field of updated propagation, a generic framework between the heterogeneous spatial databases is introduced. In terms of Geographic Information Service, pattern-matching algorithms are applied to an integrated virtual reality geographic information system.18 In addition, as a data analysis technique, pattern matching can be used to analyze qualitative data in medical education research.19
Notably, pattern matching can also be applied in structural damage identification. As stated previously, most of the existing methods use the time domain or the damage feature parameters related to the excitation factors as characteristic vectors to establish the pattern database. However, there is uncertainty in the response due to the uncertainty of the environmental excitation, making it impossible to build a uniform standard database. Therefore, in this paper, the modal parameters are used as the characteristic vectors because they are inherent properties of the structure that do not change no matter how the excitation of the structure changes. Isolation from changes in the external environment is a prerequisite for the creation of the pattern database. Based on the modal information of the structure, the pattern database could be quickly constructed by modal analysis in a FEM of the structure to be monitored, which is composed of the characteristic vector of various damage cases with labels. The proposed method identifies damage by comparing the measured characteristic vector with those in the previously constructed pattern database. Then, the similarity needs to be measured according to the matching algorithm. When the measured characteristic vector is similar to the vector of a certain pattern in the pattern database, the measured unknown damage scenario is considered to be consistent with that pattern. Hence, the damage location and damage severity of the structure can be determined.
There are various methods to calculate the similarity in the matching process. Widely used in other fields,20 similarity measures can be generally classified into two types: the distance measurement method and the similarity function method. The distance measurement method includes the Minkowsky distance, the ED, the Mahalanobis distance, and so on, while the similarity function method includes the angle cosine method, the correlation coefficient method, the generalized Dice coefficient method, and so on. As the ED amplifies the role of larger element errors in distance metrics to a certain extent, it is suitable for the proposed method in this paper.
Pattern matching is the process of calculating the similarity between the observed pattern and each pattern in the pattern database established by a finite element. The damage location and severity of the unknown damage pattern are treated as the same as the pattern with a minimum value of ED in all damage scenarios in the pattern database, so that the damage is identified.
2.2 Flexibility change rate
As mentioned above, the excitation-related damage parameters are not suitable to establish the pattern database. Hence, they should be the inherent properties of the structure, in other words, they do not change with the variation of the excitation. Generally, any changes caused by the loss of mass or stiffness in the structure are reflected in the modal parameters. The damage of the structure can be identified by the change in the stiffness matrix. Although the higher-order modes contribute more to the stiffness, it is found in practical research that they are not easy to obtain accurately.21 On the contrary, the change of the flexibility matrix can be obtained by the low-order modes. Because the flexibility matrix is the inverse of the stiffness matrix, therefore, it is more feasible to use the flexibility change rate as the damage characteristic vector.
From Equation (4), it can be seen that the flexibility matrix reflecting the inherent properties of the structure is only related to the modal information of the structure, which is not influenced by the external excitation. Therefore, using the flexibility change rate as the characteristic vector can achieve the isolation of the influence of the excitation. Theoretically, this is the basis for establishing the post-earthquake damage pattern database.
2.3 Model updating using simulated annealing algorithms
The FEM is bound to deviate from the real structure, which reduces the accuracy of the pattern-matching method. Therefore, model updating must be conducted. There are many methods of model updating.22 Simulated annealing (SA) can be used to solve combinatorial optimization problems, which can minimize the functions of many parameters.24 Therefore, SA is used to update the model in this paper. The idea of the SA algorithm is derived from the solid annealing process in physics. A solid is heated to a sufficiently high temperature and then allowed to cool slowly. The internal energy increases with heating, reaching equilibrium at each temperature. Finally, the temperature reaches the ground state with the internal energy reduced to a minimum. Actually, SA treats the internal energy as the objective function and the temperature as the control parameter, solving the combined optimization problem. With decreasing temperature, the global optimal solution of the objective function is found randomly in the solution space according to the certain probabilistic burst jump property.
2.4 Flowchart of the proposed method
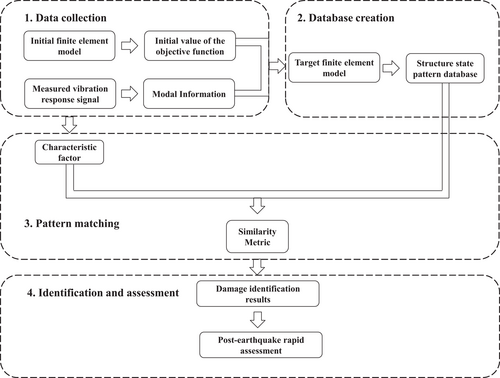
- 1.
Data collection: The initial FEM of the actual structure is established in the ANSYS. The initial value of the objective function in the model updating algorithm is constructed by the structural modal information. In addition, part of the measured vibration response of sensors collected from the structure is modally identified. The modal information of the structure is extracted and used as a reference for model updating.
- 2.
Database creation: When the optimal solution of the objective function is reached, the target FEM is rebuilt based on the output design variables. To realize the batch processing of modal analysis of various damage cases, the macro file function of ANSYS Parametric Design Language is used. Thus, the pattern database is quickly established, which is composed of the flexibility change rate of various damage cases with labels.
- 3.
Pattern matching: As the characteristic vector, the flexibility change rates are measured in the order of similarity with the database. According to the ED minimum, the damage location and damage severity are identified by querying the corresponding pattern.
- 4.
Identification and assessment: According to the identification, the rapid assessment of postearthquake structures is carried out. Damage grade for structures can be defined as listed in Table 1.26
| Damage grade | Intact | Slight | Moderate | Severe | Collapse |
| Damage index | 0–0.1 | 0.1–0.3 | 0.3–0.55 | 0.55–0.85 | 0.85–1.0 |
3 NUMERICAL SIMULATIONS
3.1 Numerical model
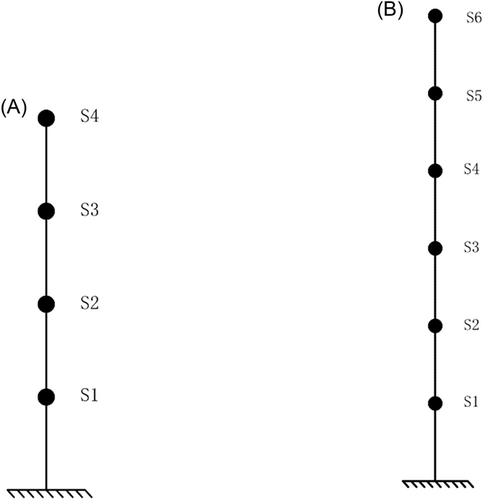
To verify the feasibility and reliability of the proposed method, representing the framework structure, four-floor and six-floor concentrated mass models were simulated by ANSYS. The structure has a layer height of 0.2 m. Beam3 and Mass21 cells are used to model the FEM with a density of 7850 kg/m3, the Poisson's ratio is 0.288, and the elastic modulus is 210 Gpa. The cross-sectional dimension of the beam is 93 mm × 9.25 mm. The masses of the four-layer structure from one to four layers are 2.0444, 2.0449, 2.0538, and 2.0445 kg, respectively, while the masses of the six-layer structure from one to six layers are 2.0444, 2.0449, 2.0538, 2.0445, 2.0538, and 2.0445 kg, respectively. In the meantime, the damage was set by varying the width of the beam units. S1, S2, …, S6 are used to label the six sensors in increasing order in labeled numbers from the bottom to the top of the structural model.
3.2 Results of the structure model of four floors
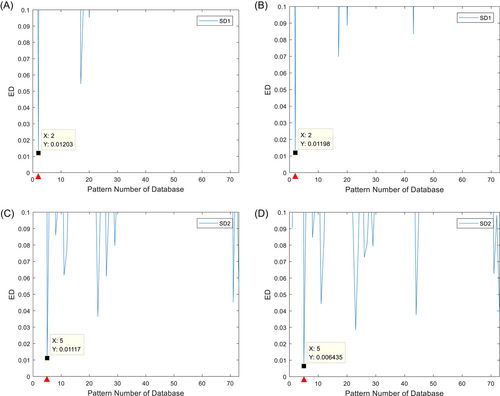
Three damage levels of 20%, 40%, and 60%, that is, 20%, 40%, and 60% reduction in stiffness, are considered in the simulation. Based on the location and severity of the damage, the various damage scenarios with damage label are permuted in the pattern database. When the modal information of each damage scenario is obtained by modal analysis, the parameter of the flexibility change rate is calculated using the first two modes, which is stored in the subheadings of the corresponding damage. As listed in Table 2, there are a total of 73 damage scenarios. To simulate the vibration of the structure under the environmental load, a white Gaussian noise excitation with zero mean and standard deviation of 1 N is applied in the horizontal direction at the second-floor position. To demonstrate the effectiveness of the method using limited number of sensors, different sensor combinations are applied. According to different sensor combinations, the acceleration response data are used to identify the modal parameters to obtain the flexibility change rate and matched with the database. Using the proposed method, the matched damage scenarios are shown in Table 3, including two single damage (SD) scenarios and two multiple damage (MD) scenarios. SD scenario 1 (SD1) corresponds to the damage of the No. 2 pattern in the database, while SD2 corresponds to the No. 5 pattern. MD scenario 1 (MD1) matches with the No. 23 pattern in the database, while MD2 matches with the No. 29 pattern (Figure 2).
| No. | Scenarios | No. | Scenarios | No. | Scenarios | No. | Scenarios |
|---|---|---|---|---|---|---|---|
| 1 | 0–0–0–0 | 21 | 20–0–0–40 | 41 | 0–40–20–0 | 61 | 0–60–60–0 |
| 2 | 20–0–0–0 | 22 | 20–0–0–60 | 42 | 0–40–40–0 | 62 | 0–60–0–20 |
| 3 | 40–0–0–0 | 23 | 0–20–20–0 | 43 | 0–40–60–0 | 63 | 0–60–0–40 |
| 4 | 60–0–0–0 | 24 | 0–20–40–0 | 44 | 0–40–0–20 | 64 | 0–60–0–60 |
| 5 | 0–20–0–0 | 25 | 0–20–60–0 | 45 | 0–40–0–40 | 65 | 0–0–60–20 |
| 6 | 0–40–0–0 | 26 | 0–20–0–20 | 46 | 0–40–0–60 | 66 | 0–0–60–40 |
| 7 | 0–60–0–0 | 27 | 0–20–0–40 | 47 | 0–0–40–20 | 67 | 0–0–60–60 |
| 8 | 0–0–20–0 | 28 | 0–20–0–60 | 48 | 0–0–40–40 | 68 | 20–0–20–20 |
| 9 | 0–0–40–0 | 29 | 0–0–20–20 | 49 | 0–0–40–60 | 69 | 40–40–0–40 |
| 10 | 0–0–60–0 | 30 | 0–0–20–40 | 50 | 60–20–0–0 | 70 | 0–60–60–60 |
| 11 | 0–0–0–20 | 31 | 0–0–20–60 | 51 | 60–40–0–0 | 71 | 20–0–40–60 |
| 12 | 0–0–0–40 | 32 | 40–20–0–0 | 52 | 60–60–0–0 | 72 | 20–0–20–40 |
| 13 | 0–0–0–60 | 33 | 40–40–0–0 | 53 | 60–0–20–0 | 73 | 20–0–40–40 |
| 14 | 20–20–0–0 | 34 | 40–60–0–0 | 54 | 60–0–40–0 | ||
| 15 | 20–40–0–0 | 35 | 40–0–20–0 | 55 | 60–0–60–0 | ||
| 16 | 20–60–0–0 | 36 | 40–0–40–0 | 56 | 60–0–0–20 | ||
| 17 | 20–0–20–0 | 37 | 40–0–60–0 | 57 | 60–0–0–40 | ||
| 18 | 20–0–40–0 | 38 | 40–0–0–20 | 58 | 60–0–0–60 | ||
| 19 | 20–0–60–0 | 39 | 40–0–0–40 | 59 | 0–60–20–0 | ||
| 20 | 20–0–0–20 | 40 | 40–0–0–60 | 60 | 0–60–40–0 |
- Note: Damage conditions from left to right correspond to one to four floors of damage, for example, “20–20–0–0” means 20% damage on the first floor, 20% damage on the second floor, and so on.
| Structure | Pattern no. | Label | Scenarios | Sensor positions |
|---|---|---|---|---|
| Four floors | 2 | SD1 | 20% damage on the first floor | S1, S2, S3 |
| S1, S2, S4 | ||||
| 5 | SD2 | 20% damage on the second floor | S1, S2, S4 | |
| S2, S3, S4 | ||||
| 23 | MD1 | 20% damage on the second floor and 20% damage on the third floor | S1, S2, S4 | |
| S1, S2, S3 | ||||
| 29 | MD2 | 20% damage on the third floor and 20% damage on the fourth floor | S1, S2, S3 | |
| S2, S3, S4 |
- Abbreviations: MD, multiple damage scenario 1; SD, single damage scenario 1.
The measured characteristic vectors are compared with the pattern database in turn. The location and severity of the measured structure are the same as the pattern corresponding to the minimum value of ED. As shown in Figure 3, both SD scenarios and MD scenarios are matched by different sensor combinations. The No. 2 pattern is matched in Figure 3A using sensors S1, S2, and S3. According to Table 2, there is 20% damage on the first floor. In Figure 3B, the No. 2 pattern is matched too, using sensors S1, S2, and S4. Therefore, for the case of SD1, the location and severity of the damage are identified by using three sensors in two different sensor combinations. Likewise, the No. 5 pattern is matched in Figure 3C,D for the case of SD2. In MD1, the pattern matched is No. 23 corresponding to the minimum value of ED in Figure 3E,F, which indicates that there is 20% damage on the second floor and 20% damage on the third floor. Similarly, shown in Figure 3G,H, the No. 29 pattern is matched for case MD2. When identifying the damage of a structure, we only need to know that the state of the structure is in a certain range. The closest patttern in the pattern database to the measured characteristic vectors after patttern matching is considered to be the damage state of the structure. These results in this case indicate that the proposed method can accurately identify the damage/s.
3.3 Results of the structure model of six floors
To demonstrate the effectiveness of the method in higher structures, a six-floor structural model is studied. The flexibility change rate of different scenarios is stored in the pattern database with labels. As shown in Table 4, there are a total of 178 damage scenarios. The acceleration response data at the mass unit are obtained by transient analysis in ANSYS with the excitation applied at the three-layer position. As in the four-floor case, different sensor combinations are used, as shown in Table 5. Data from three sensors in one sensor combination are taken for modal parameters' identification using the eigensystem realization algorithm to establish the characteristic vector. The damage scenarios for transient analysis in the numerical simulation are shown in Table 5, named SD3, SD4, MD3, and MD4.
| No. | 1 F | 2 F | 3 F | 4 F | 5 F | 6 F | No. | 1 F | 2 F | 3 F | 4 F | 5 F | 6 F | No. | 1 F | 2 F | 3 F | 4 F | 5 F | 6 F |
|---|---|---|---|---|---|---|---|---|---|---|---|---|---|---|---|---|---|---|---|---|
| 1 | 1 | 1 | 1 | 1 | 1 | 1 | 61 | 4 | 1 | 1 | 1 | 1 | 1 | 121 | 3 | 1 | 1 | 1 | 4 | 1 |
| 2 | 1 | 1 | 1 | 1 | 1 | 2 | 62 | 4 | 1 | 1 | 1 | 1 | 2 | 122 | 4 | 1 | 1 | 1 | 2 | 1 |
| 3 | 1 | 1 | 1 | 1 | 1 | 3 | 63 | 4 | 1 | 1 | 1 | 1 | 3 | 123 | 4 | 1 | 1 | 1 | 3 | 1 |
| 4 | 1 | 1 | 1 | 1 | 1 | 4 | 64 | 4 | 1 | 1 | 1 | 1 | 4 | 124 | 4 | 1 | 1 | 1 | 4 | 1 |
| 5 | 1 | 1 | 1 | 1 | 2 | 1 | 65 | 1 | 1 | 1 | 1 | 1 | 1 | 125 | 1 | 1 | 2 | 2 | 1 | 1 |
| 6 | 1 | 1 | 1 | 1 | 2 | 2 | 66 | 1 | 1 | 1 | 1 | 1 | 2 | 126 | 1 | 1 | 2 | 3 | 1 | 1 |
| 7 | 1 | 1 | 1 | 1 | 2 | 3 | 67 | 1 | 1 | 1 | 1 | 1 | 3 | 127 | 1 | 1 | 2 | 4 | 1 | 1 |
| 8 | 1 | 1 | 1 | 1 | 2 | 4 | 68 | 1 | 1 | 1 | 1 | 1 | 4 | 128 | 1 | 1 | 3 | 2 | 1 | 1 |
| 9 | 1 | 1 | 1 | 1 | 3 | 1 | 69 | 1 | 1 | 1 | 1 | 1 | 1 | 129 | 1 | 1 | 3 | 3 | 1 | 1 |
| 10 | 1 | 1 | 1 | 1 | 3 | 2 | 70 | 1 | 1 | 1 | 1 | 1 | 2 | 130 | 1 | 1 | 3 | 4 | 1 | 1 |
| 11 | 1 | 1 | 1 | 1 | 3 | 3 | 71 | 1 | 1 | 1 | 1 | 1 | 3 | 131 | 1 | 1 | 4 | 2 | 1 | 1 |
| 12 | 1 | 1 | 1 | 1 | 3 | 4 | 72 | 1 | 1 | 1 | 1 | 1 | 4 | 132 | 1 | 1 | 4 | 3 | 1 | 1 |
| 13 | 1 | 1 | 1 | 1 | 4 | 1 | 73 | 1 | 1 | 1 | 1 | 1 | 1 | 133 | 1 | 1 | 4 | 4 | 1 | 1 |
| 14 | 1 | 1 | 1 | 1 | 4 | 2 | 74 | 1 | 1 | 1 | 1 | 1 | 2 | 134 | 1 | 2 | 1 | 2 | 1 | 1 |
| 15 | 1 | 1 | 1 | 1 | 4 | 3 | 75 | 1 | 1 | 1 | 1 | 1 | 3 | 135 | 1 | 2 | 1 | 3 | 1 | 1 |
| 16 | 1 | 1 | 1 | 1 | 4 | 4 | 76 | 1 | 1 | 1 | 1 | 1 | 4 | 136 | 1 | 2 | 1 | 4 | 1 | 1 |
| 17 | 1 | 1 | 1 | 2 | 1 | 1 | 77 | 1 | 1 | 1 | 1 | 1 | 1 | 137 | 1 | 3 | 1 | 2 | 1 | 1 |
| 18 | 1 | 1 | 1 | 2 | 1 | 2 | 78 | 1 | 1 | 1 | 1 | 1 | 2 | 138 | 1 | 3 | 1 | 3 | 1 | 1 |
| 19 | 1 | 1 | 1 | 2 | 1 | 3 | 79 | 1 | 1 | 1 | 1 | 1 | 3 | 139 | 1 | 3 | 1 | 4 | 1 | 1 |
| 20 | 1 | 1 | 1 | 2 | 1 | 4 | 80 | 1 | 1 | 1 | 1 | 1 | 4 | 140 | 1 | 4 | 1 | 2 | 1 | 1 |
| 21 | 1 | 1 | 1 | 3 | 1 | 1 | 81 | 1 | 1 | 1 | 1 | 1 | 1 | 141 | 1 | 4 | 1 | 3 | 1 | 1 |
| 22 | 1 | 1 | 1 | 3 | 1 | 2 | 82 | 1 | 1 | 1 | 1 | 1 | 2 | 142 | 1 | 4 | 1 | 4 | 1 | 1 |
| 23 | 1 | 1 | 1 | 3 | 1 | 3 | 83 | 1 | 1 | 1 | 1 | 1 | 3 | 143 | 2 | 1 | 1 | 2 | 1 | 1 |
| 24 | 1 | 1 | 1 | 3 | 1 | 4 | 84 | 1 | 1 | 1 | 1 | 1 | 4 | 144 | 2 | 1 | 1 | 3 | 1 | 1 |
| 25 | 1 | 1 | 1 | 4 | 1 | 1 | 85 | 1 | 1 | 1 | 1 | 1 | 1 | 145 | 2 | 1 | 1 | 4 | 1 | 1 |
| 26 | 1 | 1 | 1 | 4 | 1 | 2 | 86 | 1 | 1 | 1 | 1 | 1 | 2 | 146 | 3 | 1 | 1 | 2 | 1 | 1 |
| 27 | 1 | 1 | 1 | 4 | 1 | 3 | 87 | 1 | 1 | 1 | 1 | 1 | 3 | 147 | 3 | 1 | 1 | 3 | 1 | 1 |
| 28 | 1 | 1 | 1 | 4 | 1 | 4 | 88 | 1 | 1 | 1 | 1 | 1 | 4 | 148 | 3 | 1 | 1 | 4 | 1 | 1 |
| 29 | 1 | 1 | 2 | 1 | 1 | 1 | 89 | 1 | 1 | 1 | 2 | 2 | 1 | 149 | 4 | 1 | 1 | 2 | 1 | 1 |
| 30 | 1 | 1 | 2 | 1 | 1 | 2 | 90 | 1 | 1 | 1 | 2 | 3 | 1 | 150 | 4 | 1 | 1 | 3 | 1 | 1 |
| 31 | 1 | 1 | 2 | 1 | 1 | 3 | 91 | 1 | 1 | 1 | 2 | 4 | 1 | 151 | 4 | 1 | 1 | 4 | 1 | 1 |
| 32 | 1 | 1 | 2 | 1 | 1 | 4 | 92 | 1 | 1 | 1 | 3 | 2 | 1 | 152 | 1 | 2 | 2 | 1 | 1 | 1 |
| 33 | 1 | 1 | 3 | 1 | 1 | 1 | 93 | 1 | 1 | 1 | 3 | 3 | 1 | 153 | 1 | 2 | 3 | 1 | 1 | 1 |
| 34 | 1 | 1 | 3 | 1 | 1 | 2 | 94 | 1 | 1 | 1 | 3 | 4 | 1 | 154 | 1 | 2 | 4 | 1 | 1 | 1 |
| 35 | 1 | 1 | 3 | 1 | 1 | 3 | 95 | 1 | 1 | 1 | 4 | 2 | 1 | 155 | 1 | 3 | 2 | 1 | 1 | 1 |
| 36 | 1 | 1 | 3 | 1 | 1 | 4 | 96 | 1 | 1 | 1 | 4 | 3 | 1 | 156 | 1 | 3 | 3 | 1 | 1 | 1 |
| 37 | 1 | 1 | 4 | 1 | 1 | 1 | 97 | 1 | 1 | 1 | 4 | 4 | 1 | 157 | 1 | 3 | 4 | 1 | 1 | 1 |
| 38 | 1 | 1 | 4 | 1 | 1 | 2 | 98 | 1 | 1 | 2 | 1 | 2 | 1 | 158 | 1 | 4 | 2 | 1 | 1 | 1 |
| 39 | 1 | 1 | 4 | 1 | 1 | 3 | 99 | 1 | 1 | 2 | 1 | 3 | 1 | 159 | 1 | 4 | 3 | 1 | 1 | 1 |
| 40 | 1 | 1 | 4 | 1 | 1 | 4 | 100 | 1 | 1 | 2 | 1 | 4 | 1 | 160 | 1 | 4 | 4 | 1 | 1 | 1 |
| 41 | 1 | 2 | 1 | 1 | 1 | 1 | 101 | 1 | 1 | 3 | 1 | 2 | 1 | 161 | 2 | 1 | 2 | 1 | 1 | 1 |
| 42 | 1 | 2 | 1 | 1 | 1 | 2 | 102 | 1 | 1 | 3 | 1 | 3 | 1 | 162 | 2 | 1 | 3 | 1 | 1 | 1 |
| 43 | 1 | 2 | 1 | 1 | 1 | 3 | 103 | 1 | 1 | 3 | 1 | 4 | 1 | 163 | 2 | 1 | 4 | 1 | 1 | 1 |
| 44 | 1 | 2 | 1 | 1 | 1 | 4 | 104 | 1 | 1 | 4 | 1 | 2 | 1 | 164 | 3 | 1 | 2 | 1 | 1 | 1 |
| 45 | 1 | 3 | 1 | 1 | 1 | 1 | 105 | 1 | 1 | 4 | 1 | 3 | 1 | 165 | 3 | 1 | 3 | 1 | 1 | 1 |
| 46 | 1 | 3 | 1 | 1 | 1 | 2 | 106 | 1 | 1 | 4 | 1 | 4 | 1 | 166 | 3 | 1 | 4 | 1 | 1 | 1 |
| 47 | 1 | 3 | 1 | 1 | 1 | 3 | 107 | 1 | 2 | 1 | 1 | 2 | 1 | 167 | 4 | 1 | 2 | 1 | 1 | 1 |
| 48 | 1 | 3 | 1 | 1 | 1 | 4 | 108 | 1 | 2 | 1 | 1 | 3 | 1 | 168 | 4 | 1 | 3 | 1 | 1 | 1 |
| 49 | 1 | 4 | 1 | 1 | 1 | 1 | 109 | 1 | 2 | 1 | 1 | 4 | 1 | 169 | 4 | 1 | 4 | 1 | 1 | 1 |
| 50 | 1 | 4 | 1 | 1 | 1 | 2 | 110 | 1 | 3 | 1 | 1 | 2 | 1 | 170 | 2 | 2 | 1 | 1 | 1 | 1 |
| 51 | 1 | 4 | 1 | 1 | 1 | 3 | 111 | 1 | 3 | 1 | 1 | 3 | 1 | 171 | 2 | 3 | 1 | 1 | 1 | 1 |
| 52 | 1 | 4 | 1 | 1 | 1 | 4 | 112 | 1 | 3 | 1 | 1 | 4 | 1 | 172 | 2 | 4 | 1 | 1 | 1 | 1 |
| 53 | 2 | 1 | 1 | 1 | 1 | 1 | 113 | 1 | 4 | 1 | 1 | 2 | 1 | 173 | 3 | 2 | 1 | 1 | 1 | 1 |
| 54 | 2 | 1 | 1 | 1 | 1 | 2 | 114 | 1 | 4 | 1 | 1 | 3 | 1 | 174 | 3 | 3 | 1 | 1 | 1 | 1 |
| 55 | 2 | 1 | 1 | 1 | 1 | 3 | 115 | 1 | 4 | 1 | 1 | 4 | 1 | 175 | 3 | 4 | 1 | 1 | 1 | 1 |
| 56 | 2 | 1 | 1 | 1 | 1 | 4 | 116 | 2 | 1 | 1 | 1 | 2 | 1 | 176 | 4 | 2 | 1 | 1 | 1 | 1 |
| 57 | 3 | 1 | 1 | 1 | 1 | 1 | 117 | 2 | 1 | 1 | 1 | 3 | 1 | 177 | 4 | 3 | 1 | 1 | 1 | 1 |
| 58 | 3 | 1 | 1 | 1 | 1 | 2 | 118 | 2 | 1 | 1 | 1 | 4 | 1 | 178 | 4 | 4 | 1 | 1 | 1 | 1 |
| 59 | 3 | 1 | 1 | 1 | 1 | 3 | 119 | 3 | 1 | 1 | 1 | 2 | 1 | |||||||
| 60 | 3 | 1 | 1 | 1 | 1 | 4 | 120 | 3 | 1 | 1 | 1 | 3 | 1 |
- Note: “1,” “2,” “3,” and “4” indicate the healthy status, 20% damage, 40% damage, and 60% damage, respectively. “1 F” means the first floor, and so on.
| Structure | Pattern no. | Label | Scenarios | Sensor positions |
|---|---|---|---|---|
| Six floors | 53 | SD3 | 20% damage on the first floor | S4, S5, S6 |
| S3, S4, S5 | ||||
| S2, S3, S4 | ||||
| 49 | SD4 | 60% damage on the second floor | S4, S5, S6. | |
| S3, S4, S5 | ||||
| S2, S3, S4 | ||||
| 159 | MD3 | 60% damage on the second floor and 40% damage on the third floor | S4, S5, S6 | |
| S3, S4, S5 | ||||
| S2, S3, S4 | ||||
| 173 | MD4 | 40% damage on the first floor and 20% damage on the second floor | S4, S5, S6 | |
| S3, S4, S5 | ||||
| S2, S3, S4 |
- Abbreviations: ED, Euclidean distance; MD3, multiple damage scenario 3; SD3, single damage scenario 3.
For the scenario of SD3, Figure 4 shows the acceleration response signal of sensor S4. When using three sensors S4, S5, and S6 for damage identification, the modal identification of the first two order frequencies is 2.881 and 16.875, respectively. In addition, the mode shape is shown in Figure 5. Figure 6 shows the ED of the SD scenarios. It shows that the No. 53 and No. 49 damage patterns are matched by different sensor combinations, respectively. From Table 4, it can be seen that the corresponding damage is 20% for the first floor and 60% for the second floor. These are in line with the actual damage situation.
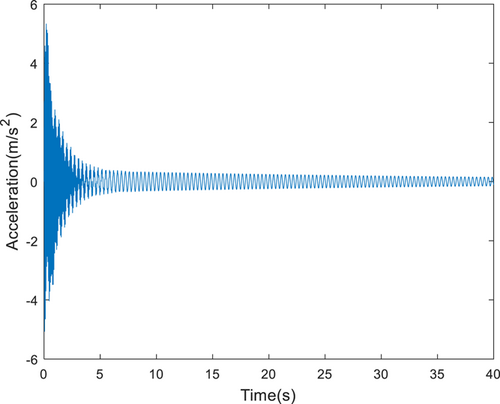
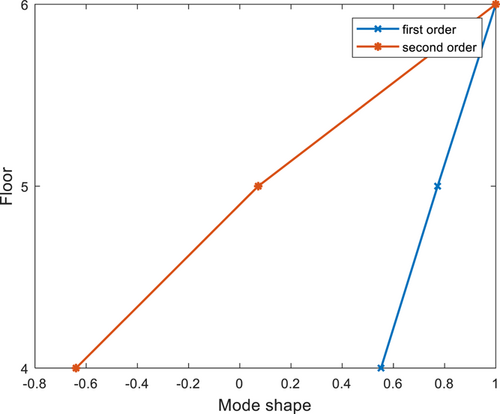

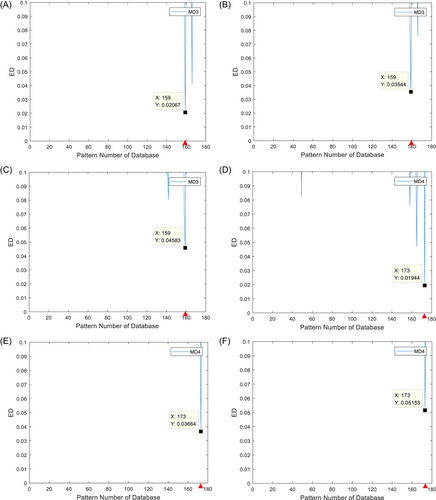
Figure 7 demonstrates the pattern-matching results of the MD scenarios. Corresponding to 60% damage on the second floor and 40% damage on the third floor (MD3), Figure 7A–C shows that the No. 159 damage pattern is matched by different sensor combinations, respectively. Similarly, 40% damage on the first floor and 20% damage on the second floor (MD4) is matched to the No. 173 pattern. They are the same as the actual damage situation.
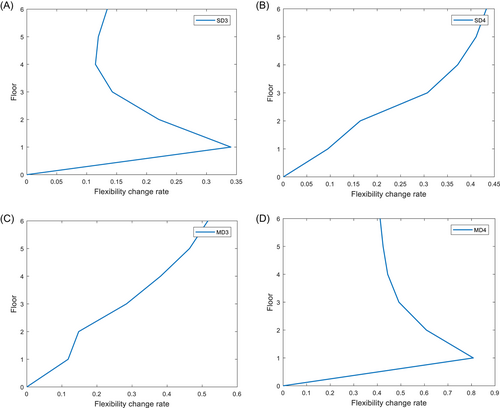
For the same condition as in Table 5, using the traditional method of flexibility change rate directly, the corresponding signals of acceleration from all sensors of the structure are modally identified and the flexibility change rate curves are drawn. The SD identification results are shown in Figure 8A,B, the location of the damage can be identified by the abruptly changes of the curve in scenario SD3, but for scenarios SD4, MD3, and MD4, the damage location identification is false. Therefore, traditional methods are not suitable for damage identification for the case structures, both in terms of damage location and damage severity, despite using all the sensors. The flexibility change rate, the feature vector in the traditional damage identification method, is based on the premise of obtaining relatively high-resolution modes of the structure. However, it is innovative to use it as the characteristic vector for pattern matching. On the one hand, damage identification using the incomplete mode can be realized by using a limited number of sensors. On the other hand, it can make up for the deficiency of the traditional method in identifying the severity of the damage.
3.4 Results under seismic excitation
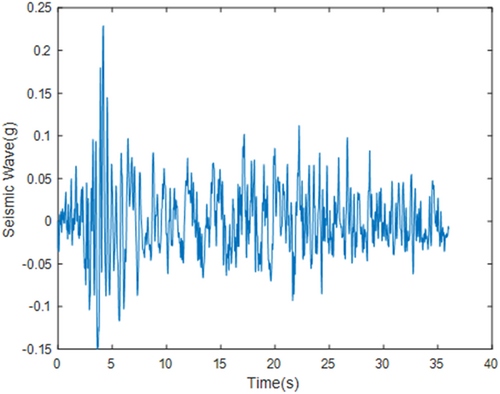
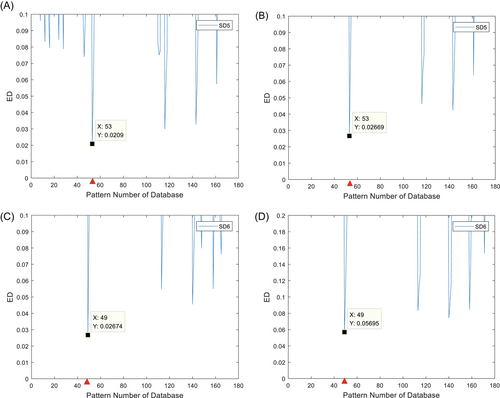
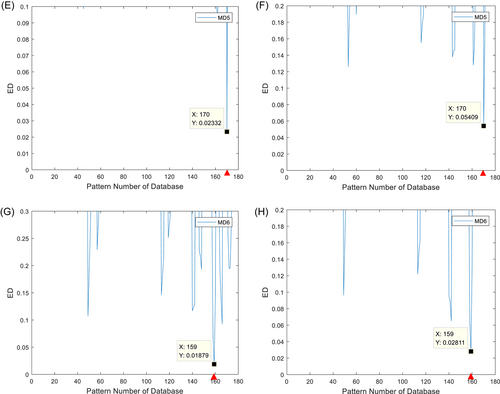
According to the results of the above two cases, the proposed method is suitable for the rapid assessment of postearthquake structures. The aftershock wave can be used as the excitation of the structure. In this case, seismic excitation, shown in Figure 9, is input to the structure of the above six-floor model. The characteristic vector satisfies the requirements of establishing the pattern database under seismic excitation. Since it does not belong to the time-domain method, the modal analysis is less computationally intensive and faster compared with the transient analysis to establish the pattern database. Overall, the damage scenarios for the transient analysis in the numerical simulation are listed in Table 6. For case SD5, there is 18% damage on the first floor, which should be matched with the No. 53 pattern in the database. Figure 10A,B shows that the matching results are consistent with the expected results by two different sensor combinations. From Table 1, it is clear that the damage grade of the first floor of the structure is slight. For case SD6, Figure 10C,D shows the same result as the matching pattern No. 49, indicating that the damage grade of the second floor is severe. Figure 10E,F shows the matching result of the MD scenario MD5, which is 18% damage on the first floor and 18% damage on the second floor, which means that the damage grades of both the first floor and the second floor are slight. Figure 10G,H shows case MD6, which is 59% damage on the second floor and 43% damage on the third floor, indicating that the damage grade of the second floor is severe, while that of the third floor is moderate. In the case of incomplete modes, when limited sensors are used, the results are up to expectations. It is confirmed that the method in this paper can be used for rapid assessment of the damage grade of a structure after an earthquake.
| Structure | Pattern no. | Label | Damage scenarios | Sensor positions |
|---|---|---|---|---|
| Six floors | 53 | SD5 | 18% damage on the first floor | S3, S4, S5 |
| S2, S3, S4 | ||||
| 49 | SD6 | 59% damage on the second floor | S3, S4, S5 | |
| S2, S3, S4 | ||||
| 170 | MD5 | 18% damage on the first floor and 18% damage on the second floor | S3, S4, S5 | |
| S2, S3, S4 | ||||
| 159 | MD6 | 59% damage on the second floor and 43% damage on the third floor | S3, S4, S5 | |
| S2, S3, S4 |
- Abbreviations: MD5, multiple damage scenario 5; SD5, single damage scenario 5.
4 EXPERIMENTAL VERIFICATIONS
4.1 Experimental setup
To further verify the effectiveness of the proposed method, two experimental structures of six floors and four floors are tested. Each floor is installed with an accelerometer. The total mass of the accelerometer and magnetic seat is 106.4 g. In the six floors model, the mass of each floor together with the mass block from 1 to 6 floor are 2.0444, 201449, 2.0538, 2.0445, 2.0449, and 2.045 kg, respectively, while they are 2.0444, 2.0449, 2.0538, and 2.0445 kg from 1 to 4 floor in the four floors model, respectively. Different kinds of damage are introduced by reducing the stiffness by changing the width of the floor section, to achieve the damage severity of the desired design in the pattern database. Figure 11 shows the experimental structure and damage settings.

Hammering excitation was applied at the center of the steel plate interlayer. The acceleration responses at the center of masses were collected using a DH5922 dynamic analyzer with a sampling frequency of 200 Hz. The damage scenario of 40% damage on the first floor is used as a representative condition for verification, listed in Table 7.
| Structure | Pattern no. | Label | Damage scenarios | Sensor positions |
|---|---|---|---|---|
| Six floors | 57 | SD7 | 40% damage on the first floor | S4, S5, S6 |
| S2, S3, S4 | ||||
| Four floors | 3 | SD8 | 40% damage on the first floor | S2, S3, S4 |
| S1, S2, S4 |
- Abbreviation: SD7, single damage scenario 7.
4.2 Experimental results
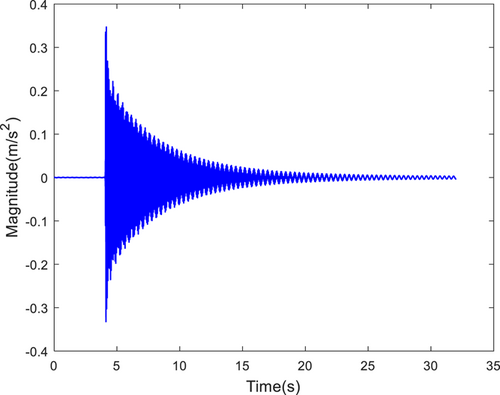
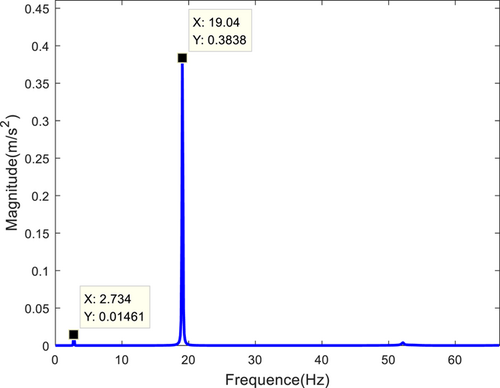
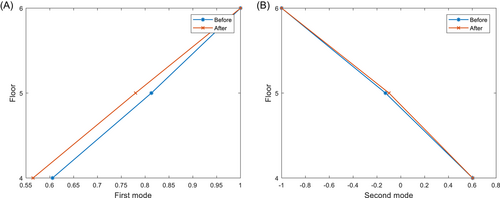
The measured acceleration response of the sixth floor is shown in Figure 12. The first two orders of natural frequency and mode shape of the structure are obtained using the complex modal indicator function (CMIF) method for modal identification of S4, S5, and S6. Figure 13 shows the identified natural frequencies. The initial values of the objective function in the SA algorithm are constructed subsequently. The elastic modulus, the width, and the thickness of the steel plate are considered design variables. The weight values of the inherent frequency and vibration mode are 25 and 200 in order. When the objective function reaches the optimal solution, the iteration ends and the modified design variables are output parameters. A comparison of the results before and after model updating is shown in Tables 8 and 9 and Figure 14.
| Design parameters | Before | After |
|---|---|---|
| Elastic modulus | 2.1e11 | 2.16e11 |
| Width | 0.094 | 0.092 |
| Thickness | 0.0095 | 0.0092 |
| Frequency | Before | After | Relative error (%) |
|---|---|---|---|
| First order | 2.734 | 2.664 | 2.579 |
| Second order | 19.040 | 18.138 | 4.738 |
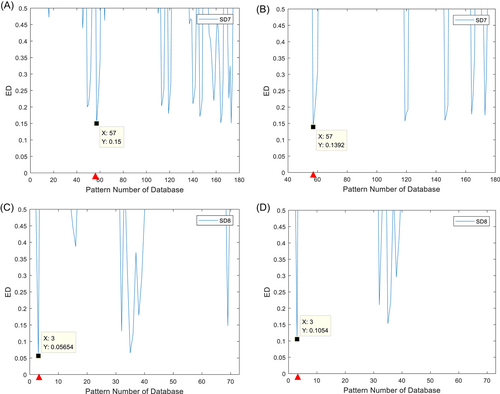
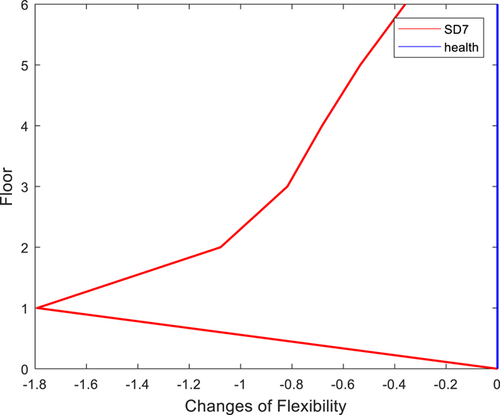
The characteristic vector of the experimental structure is calculated from the first two orders of frequency and mode shapes. The modified structural FEM is used to establish the pattern database. The ED between the characteristic vector and the flexibility change rate of various damage scenarios in the database is calculated in turn. When the distance obtains the minimum value, the damage status of the corresponding pattern is treated as the damage of the experimental structure. The matching results are shown in Figure 15A. It shows that the smallest distance corresponds to the No. 57 pattern. From Table 4, the experimental structure has 40% of the damage on the first floor, which is in line with the actual situation. Figure 15B demonstrates the results of S2, S3, and S4, which match the same pattern as in Figure 15A. For the structure of four floors, Figure 15C,D matches the No. 3 pattern consistently, which indicates that the structure has 40% damage on the first floor according to Table 2. In addition, the flexibility change rate curve of the structure is drawn according to the traditional method as shown in Figure 16. The curve has a peak at the first-floor position, but the degree of damage cannot be judged. Therefore, the experimental verification proves that the method proposed in this paper can identify the structural damage well.
5 CONCLUSIONS
This paper proposes a rapid damage identification method for post-earthquake structures based on pattern matching using the flexibility change rate. Since the flexibility change rate is analytically related to the natural frequency and mode shape of the structure, it is not affected by external excitation. The first two orders of modal information from the target FEM are obtained, and the flexibility change rate vectors for various damage scenarios form the pattern database. The characteristic vectors identified from the acceleration responses of limited number of sensors are used to measure the similarity with the database in turn. The location and severity of the measured structure are identified to be the same as the pattern corresponding to the minimum value of the ED. To verify the feasibility and reliability of the proposed method, both numerical simulations and experiments are conducted. Numerical results indicate that the proposed approach can identify the damage location and severity by different sensor combinations under different excitation scenarios for the structures of six floors and four floors. Under seismic excitation, the proposed method can realize the postearthquake assessment of the structure. Experimental verifications on two structures further demonstrate the effectiveness of the proposed approach. The results show that the flexibility change rate is only related to the modal information of the structure, which isolates the influence of excitation and is not disturbed by external environmental factors. In addition, the process of establishing a modal analysis-based pattern database is faster and more convenient, indicating that the proposed method is more effective than the traditional one. Due to the limitations of the experimental conditions, hammering excitation is applied in the experiment. Further research will be conducted in the future to use seismic stations for experimental verification of the proposed method.
AUTHOR CONTRIBUTIONS
Zhenhua Nie: Conceptualization; methodology; validation; writing—original draft preparation; writing—review and editing. Tao Chen: Formal analysis; investigation; writing—review and editing. Guanghao Xia: Formal analysis; data curation. Zuanfeng Li: Investigation. Ruofan Gao: Project administration. Hongwei Ma: Resources.
ACKNOWLEDGMENTS
This work was financially supported by the projects in National Natural Science Foundation of China (No. 52178289); Key Laboratory of Robotics and Intelligent Equipment of Guangdong Regular Institutions of Higher Education (Grant No. c2017KSYS009); and the DGUT Innovation Center of Robotics and Intelligent Equipment of China (No. KCYCXPT2017006).
CONFLICT OF INTEREST STATEMENT
The authors declare no conflicts of interest.


