A statistical study of inelastic displacement ratio spectrum for existing structures
Abstract
Displacement-based design has gained importance due to the emergence of the performance-based engineering, and it has now become desirable to estimate maximum (inelastic) displacements of structures for different levels of seismic hazard. Being closely related to damage, displacement (or drift) has become an important parameter necessary to meet various performance goals. It is considered convenient to estimate the inelastic displacement demand in a structure by multiplying the elastic displacement demand of the structure with a ratio called the inelastic displacement ratio. A comprehensive study is conducted for the parametric dependence of the inelastic displacement ratio in single-degree-of-freedom (SDOF) systems with known relative lateral strengths, on strong motion duration, earthquake magnitude, epicentral distance, and geological site conditions. This study is different from the earlier studies of similar types in that other governing parameters are kept fixed while the effects of variations in any particular parameter are studied. This study is based on the generation of ensembles of synthetic accelerograms from a database of 1274 accelerograms recorded in western USA for the pseudospectral acceleration (PSA) spectra of given source and site parameters. It is found that strong motion duration may influence the inelastic displacement ratios, depending on the hysteretic properties of the oscillator, in the case of durations not much longer than 10 s. Earthquake magnitude has a significant influence on these ratios for the SDOF systems of most periods, while site geology appears to be important for the stiff oscillators. A scaling model is also proposed in this study for estimating the inelastic displacement ratio spectrum from a normalized relative velocity spectrum of the ground motion. The proposed model indirectly includes the effects of various governing parameters and is shown to preserve the trends available from the direct study.
1 INTRODUCTION
Earthquake-resistant design philosophy of structures has undergone a sea change during the last 25–30 years. For economic reasons, structures were traditionally designed to behave inelastically without collapse during the most severe ground motions. It was assumed that the structures possessed sufficient ductility to undergo inelastic deformations during such motions. ATC 3-061 and ATC-192 rationalized this procedure and proposed to estimate the design strength of a structure by the scaling down of the elastic strength via a response reduction factor. This factor accounts for the ductility available in the structure besides its overstrength and level of redundancy. Greater values of this factor were specified for inherently more ductile structural systems. While this “strength-based” design philosophy adequately took care of the performance in extreme situations, this failed to control damage in a structure during the less-than-severe ground motions. Since the damage in structural and nonstructural elements is well-correlated with the displacement or drift levels of a structure, it became necessary to control the structural displacements at less-than-severe ground motions. This displacement-based design philosophy has gained significant importance in the past 25 years, and is now an integral part, along with the strength-based design, of the fast emerging performance-based design (PBD) philosophy. In the PBD philosophy, a structure is designed to attain multiple levels of performance (damage) at different levels of earthquake hazard.3
The primary task in a displacement-based design is to obtain an estimate of the maximum displacement of the structure or its components for a given seismic hazard. The most accurate and direct procedure of (nonlinear) time-history analysis is not considered convenient for practical applications, and therefore a series of indirect methods came up to give approximate estimates of the maximum displacements. Rosenblueth and Herrera,4 Gülkan and Sozen,5 Iwan,6 and so forth proposed to obtain the equivalent linear viscous damping factor and stiffness for use in an equivalent linearization technique. The capacity spectrum method in ATC-407 to find demand in the nonlinear static procedure (NSP) was in fact based on applying an equivalent linearization technique in an iterative scheme. There has been another set of researchers (comprising Newmark and colleagues,8-14 etc.) who proposed to find the maximum displacement in a nonlinear single-degree-of-freedom (SDOF) system as the product of the maximum deformation of the corresponding linear system (with the same initial lateral stiffness and damping factor as in the nonlinear system) with a displacement modification factor , formally called as the “inelastic displacement ratio.” This approach has formed the basis of the guidelines of FEMA-27315 and FEMA-35616 to determine displacement demand in the NSP.
Although from the performance point of view both the equivalent linearization methods and the methods based on using are comparable,17, 18 it is simpler to comprehend and employ the second methodology in practice. The first studies in this were conducted by Veletsos and Newmark19 and Veletsos et al.,20 who observed that the ratio of maximum displacement in a nonlinear system to that in the corresponding linear system is approximately unity for the flexible oscillators, thus leading to the “equal displacement rule,” and exceeds unity for the stiff oscillators. Velestos and Vann21 extended the applicability of the “equal displacement rule” to the medium frequency zone for design purposes. Newmark and Hall8 and Riddell and Newmark22 proposed periods independent of the ductility demand, above which the “equal displacement rule” could be applied. However, Miranda10 and Rahnama and Krawinkler9 showed on the basis of much larger suites of ground motion records that these periods also depended on the site conditions apart from the ductility demand. They studied variations of with oscillator period for different levels of ductility demand (to be referred to as spectra hereafter). Further insight into the dependence of on the parameters like source-to-site distance, magnitude of event, and site conditions was provided by Miranda.11 This study found no appreciable effect of magnitude and distance to the fault rupture. However, site soil conditions were shown to be affecting , particularly in the case of shear wave velocity not exceeding 180 m/s in the upper 30 m of the site.23 Baez and Miranda24 showed that depends on earthquake magnitude for the sites experiencing forward directivity effects. Chopra and Chintanapakdee25 and Konstandakopoulou and Hatzigeorgiou26 also considered pulse-like ground motions for their studies on .
Studies have also been conducted on the variations of (with oscillator period) for different levels of response reduction factor (to be referred to as spectra hereafter). These spectra have been found to be more suitable for the evaluation of the existing structures with known lateral yield strengths.27 An indirect determination of the mean spectra has been attempted by Reinhorn,28 Chopra and Goel,29 and Fajfar30 via the use of existing mean strength reduction factor (SRF) spectra. As shown by Miranda,12 this approach provides first-order approximations of the actual spectra. Several researchers (see, e.g., Whittaker and colleagues14, 27, 31) directly obtained and studied the spectra. Shimazaki and Sozen31 carried out a limited study in the case of three ground motion records with different site periods and oscillators of two different periods, and suggested periods beyond which the equal displacement rule can be applied.14 These periods depend on the response reduction factor and characteristic period of the site, and were found to be independent of the hysteresis model used. Whittaker et al.14 considered 20 recorded accelerograms compatible with a NEHRP spectrum for a highly seismic zone on soft rock or stiff soil,15, 16, 32 and concluded that mean inelastic displacement demand exceeds the corresponding mean elastic demand (at all periods) either for > 5 or when the characteristic period of the site exceeds the initial period of the oscillator. Ruiz-García and Miranda27 carried out a comprehensive parametric study in line with the study by Miranda11 on the spectra. A suite of 264 accelerograms recorded on firm soil sites was used to study the effects of earthquake magnitude, source-to-site distance, and site conditions (as classified in FEMA15, 16 and ICBO33) in the case of elasto-plastic oscillators. Observations similar to those in Miranda11 were made except that earthquake magnitude now appeared to influence the inelastic displacement ratio in the case of stiff structures. Several researchers studied the spectra in the case of pulse-like ground motions,34-38 ground motion sequences,39 and very soft soil conditions.40, 41 Some of the recent studies also considered constant-damage inelastic displacement ratio spectra, instead of the and spectra.42-44 Most of the past parametric studies were however based on accelerogram records with widely different characteristics, and therefore, the effect of a particular parameter could not be studied with the other parameters remaining unchanged. For example, Ruiz-García and Miranda27 considered three groups of records for NEHRP site class B, C, and D and Akkar et al.36 considered three groups of records for NEHRP site class C, site class D, and site classes C and D combined to study the effect of site conditions on spectra. However, the earthquake magnitude and distance of rupture varied significantly in each of these groups, and no effort was made to keep the strong-motion duration unchanged. Ruiz-García and Miranda27 also studied the effect of earthquake magnitude and distance of rupture on spectra, but they did not ensure that the distance of rupture and earthquake magnitude, respectively, remained unchanged.
For practical applications, it is always desirable to have a model for easy and convenient determination of spectrum. Ruiz-García and Miranda27 proposed a model for the mean value of inelastic displacement ratio as a function of the response reduction factor and the ratio of the initial oscillator period to the characteristic period of site. This however involves regression coefficients that are dependent only on the site conditions. The models proposed by Chopra and Chintanapakdee45 and Chenouda and Ayoub46 suffered from similar limitations. Therefore, an alternative model that includes the effects of source parameters also may need to be developed.47
Based on the thesis of the first author,48 this study aims to assess the effects of earthquake magnitude, epicentral distance, strong motion duration, and site geology on the spectra such that the effect of each parameter is studied independent of the other parameters. A suite of 956 horizontal accelerograms recorded during 106 earthquake events in western USA from 1931 to 1984 (see Lee and Trifunac49 for details) and 318 horizontal accelerograms recorded during the 1994 Northridge Earthquake event is used. All accelerograms are made compatible with different sets of pseudospectral acceleration (PSA) spectra proposed by Trifunac and Lee50 for given source and site characteristics, and the wavelet-based approach of Mukherjee and Gupta51 is used for this purpose. Since the nonlinear response of structural systems is largely dependent on the hysteretic properties of the system, two types of oscillators, namely elasto-plastic oscillator and the commonly used stiffness-degrading modified Clough oscillator22 are used in this study. A detailed study by Gupta and Kunnath52 for the effects of hysteresis on spectrum showed that stiffness degradation affects a system more severely than strength degradation in nominally degrading structures. A scaling model is also proposed in the present study to estimate the spectrum from the relative velocity spectrum SV, normalized to a maximum unit value.
2 INELASTIC DISPLACEMENT RATIO SPECTRUM
3 PARAMETRIC STUDY OF FOR DEPENDENCE ON STRONG MOTION DURATION
A database of 1274 accelerograms is used for this study, consisting of 956 records from the 106 earthquakes in western USA between 1931 and 1984 (see Lee and Trifunac49 for details) and 318 records from the 1994 Northridge Earthquake. Each accelerogram in this database is made compatible with different PSA spectra for 50% level of confidence, as proposed by Trifunac and Lee50 for different sets of earthquake and site parameters. Thus, in the case of each PSA spectrum, all the 1274 (modified) accelerograms present an ensemble of time-histories encompassing a wide range of nonstationary characteristics. It may be mentioned that even though the database considered has sufficient representation of records from short to large epicentral distances, low-magnitude to high-magnitude earthquake events, and from different site conditions, the details of the magnitudes, epicentral distances, PGAs, and site conditions of the recorded accelerograms are irrelevant for the present study, because once the recorded accelerograms are modified to be compatible with a PSA spectrum, only the nonstationary characteristics of those motions remain relevant.
To make each of the 1274 recorded accelerograms of ground motions compatible to a particular PSA spectrum, a wavelet-based approach proposed by Mukherjee and Gupta51 is used. This method ensures that the nonstationary characteristics of the original accelerograms in various nonoverlapping frequency bands remain unaltered. The resulting (spectrum-compatible) accelerograms are then passed through an Ormsby filter (with cutoff central frequency and width of the transition band set at 0.06 and 0.02 Hz, respectively) to screen off the low-frequency noise. Each accelerogram is subsequently subjected to the quadratic-type baseline correction. The corrected (spectrum-compatible) accelerograms are used to find the spectra during 66 initial periods. These periods are 0.05, 0.06, 0.07, 0.08, 0.09, 0.1, 0.11, 0.12, 0.13, 0.14, 0.15, 0.16, 0.17, 0.18, 0.19, 0.2, 0.22, 0.24, 0.26, 0.28, 0.3, 0.32, 0.34, 0.36, 0.38, 0.4, 0.42, 0.44, 0.46, 0.48, 0.5, 0.55, 0.6, 0.65, 0.7, 0.75, 0.8, 0.85, 0.9, 0.95, 1.0, 1.1, 1.2, 1.3, 1.4, 1.5, 1.6, 1.7, 1.8, 1.9, 2.0, 2.2, 2.4, 2.6, 2.8, 3.0, 3.2, 3.4, 3.6, 3.8, 4.0, 4.2, 4.4, 4.6, 4.8, 5.0 s. Thus, in the case of each chosen PSA spectrum, a total of 1274 spectra are generated for a given type of nonlinear oscillator.
It is proposed to study the effect of strong motion duration on the spectrum by considering the ensembles of accelerograms of different durations but conforming to the same PSA spectrum. The suite of 1274 modified and corrected accelerograms as discussed above is considered for this purpose. Accelerograms within strong motion duration windows of 9.5–10.5, 19–21 , and 38–42 s (corresponding to 10, 20, and 40 s central values, respectively, with 5% tolerance) are selected. The strong motion duration definition as proposed by Banerjee and Gupta53 and explained in Appendix A is considered first for this selection.
All 1274 records are made compatible to four different PSA spectra with the characteristics shown in Table 1 for Spectra I–IV. Focal depth is kept constant at 5 km in all four cases. Different spectra have been chosen to study the possible variations in the nature of the duration dependence of spectrum with epicentral distance and site conditions. For each of the four example spectra, Table 2 shows the number of records obtained conforming to 10, 20, and 40 s durations from among the suite of 1274 records. Further, to observe how the dependence on strong motion duration varies with the level of yield strength in the oscillator, three different levels of yield strength are considered corresponding to = 2, 4, and 6 for each of the four PSA spectra. Similarly, the type of nonlinearity may also influence the dependence of spectrum on duration, and therefore two commonly used oscillators, (nondegrading) elasto-plastic and (stiffness-degrading) modified Clough oscillator,22 are used. The modified Clough oscillator satisfactorily represents the flexural behavior of structural systems typically showing stiffness degradation in the nonlinear regime, like reinforced concrete members, frames, and walls,22 while taking into account the model deficiencies (as observed, for instance, in the earlier simple models like the Clough model) under incomplete loading cycles characteristically found in the earthquake loading. On the other hand, the elasto-plastic oscillator is considered a simpler idealization of ductile, non-deteriorating structural systems like unbraced steel frames under moderate axial load or eccentrically braced steel frames.22 Both types of oscillators are assumed to possess an initial damping ratio of 5%. The strain-hardening stiffness in the modified Clough model is considered as 3% of the elastic stiffness.
| Spectrum no. | Magnitude, | Epicentral distance, (km) | Geological site conditions |
|---|---|---|---|
| I | 7.5 | 20 | Rock |
| II | 7.5 | 20 | Alluvium |
| III | 7.5 | 100 | Rock |
| IV | 7.5 | 100 | Alluvium |
| V | 4.5 | 50 | Rock |
| VI | 5.5 | 50 | Rock |
| VII | 6.5 | 50 | Rock |
| VIII | 6.5 | 75 | Rock |
| IX | 6.5 | 100 | Rock |
| X | 6.5 | 50 | Intermediate |
| XI | 6.5 | 50 | Alluvium |
- Abbreviation: PSA, pseudospectral acceleration.
| Number of records | |||
|---|---|---|---|
| Spectrum no. | 10 s duration | 20 s duration | 40 s duration |
| I | 74 | 55 | 32 |
| II | 62 | 64 | 45 |
| III | 76 | 67 | 40 |
| IV | 80 | 53 | 43 |
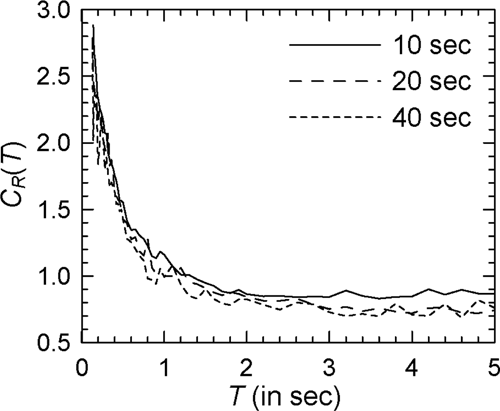
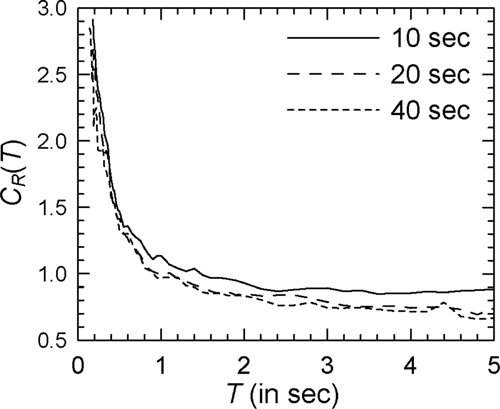
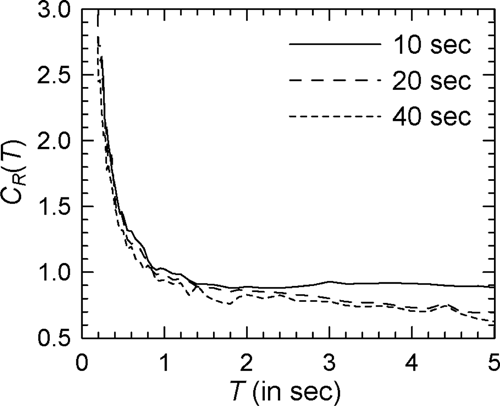
Figures 1-3 show the comparison of mean spectra for 10, 20, and 40 s strong motion durations in the case of elasto-plastic oscillators with = 2, 4, and 6, respectively, and Spectrum I (see Supporting Information: Figures S1–S3, respectively, for the log–log versions of these figures). It is seen that the curves in each of the three figures intersect at random over the entire range of periods. However, in the case of = 6, however, factors for the 40 s curve appear to be marginally higher at most periods. The effect of duration appears to be greater in the case of higher ; but in the absence of any definite trend, the effect of strong motion duration on spectra cannot be delineated. The absence of any trend is also visible in Figures 4-6 (or Supporting Information: Figures S4–S6 showing the log–log versions) in the case of = 4, when Spectra II–IV are considered, respectively (instead of Spectrum I).
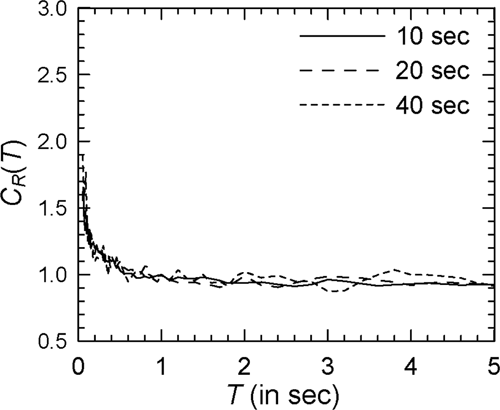
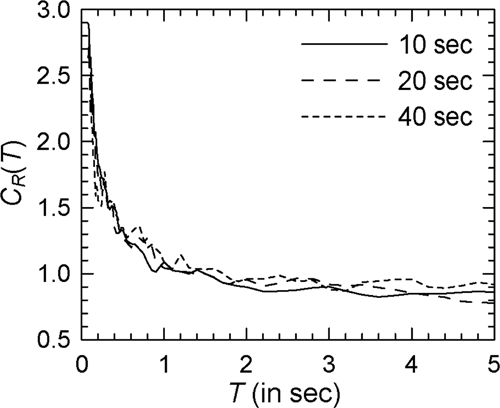
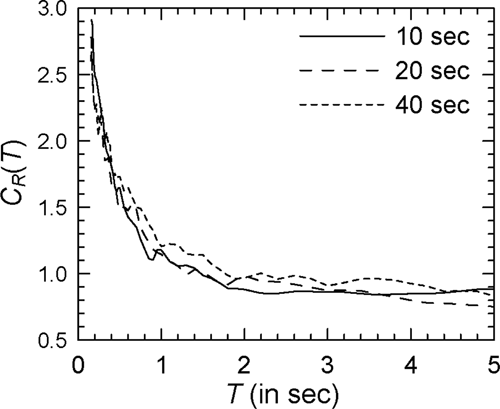
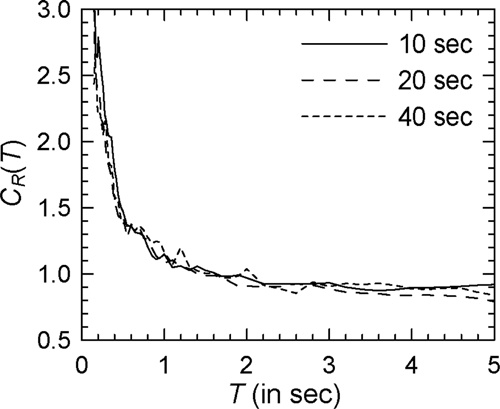
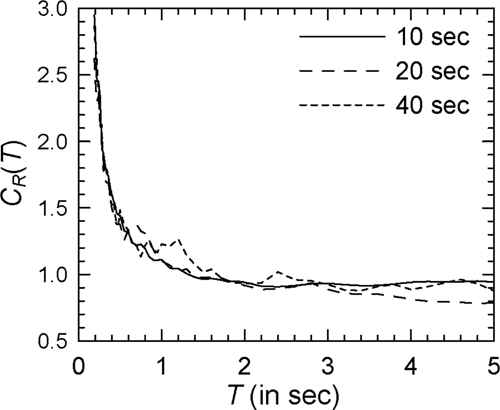
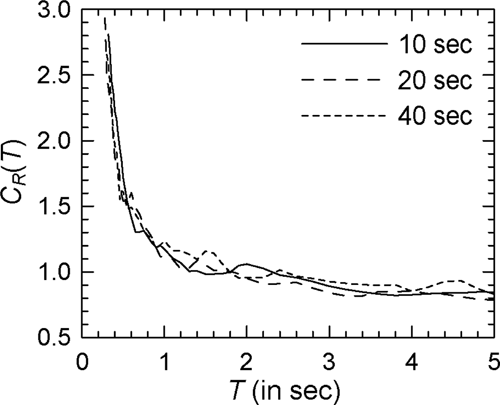
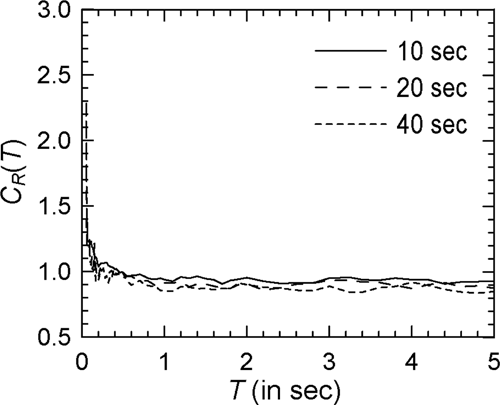
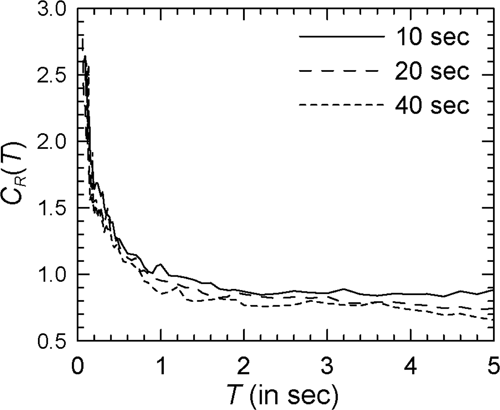
Figure 7 shows the comparison of the mean spectra in the case of modified Clough oscillators with = 2 and Spectrum I (see Supporting Information: Figure S7 for the log–log version). In comparison with Figure 1 for nondegrading oscillators, a greater effect of duration is observed with the values for 10 s duration being higher at almost all periods. There is no clear trend, however, at higher durations with the curves for 20 and 40 s durations crisscrossing each other at several periods. Similar behavior is observed in the case of other PSA spectra. However, for higher , the effect of strong motion duration at shorter durations (around 10 s) becomes more prominent particularly at longer periods. This is shown in Figures 8 and 9 for the cases of = 4 and = 6, respectively (see Supporting Information: Figures S8 and S9, respectively, for the log–log versions). The duration effect becomes more prominent at the periods greater than 0.5 s in the case of alluvium sites, as shown by the results of Figure 10 for Spectrum II in the case of the = 4 oscillators (see Supporting Information: Figure S10 for the log–log version). It may be noted that both Spectra I and II are for the epicentral distance of 20 km. At the epicentral distance of 100 km, duration effect in the case of rock sites also becomes more prominent as shown in Figure 11 for Spectrum III and = 4 oscillators (see Supporting Information: Figure S11 for the log–log version).
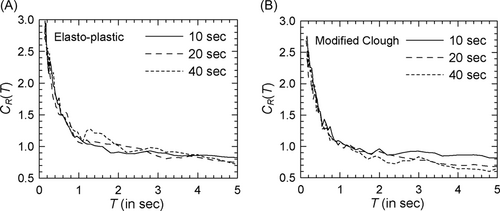
To observe whether the above trends are dependent on the definition of strong motion duration, comparisons of mean spectra are also obtained in the cases of McCann–Shah54 and Trifunac–Brady55 definitions for Spectrum I and = 6. Figure 12 shows such comparisons for the elasto-plastic and modified Clough oscillators in the case of McCann–Shah definition, while Figure 13 shows the results in the case of Trifunac–Brady definition (see Supporting Information: Figures S12 and S13, respectively, for the log–log versions). It is seen that despite using a different duration definition, there is no clear effect of duration on the spectrum for elasto-plastic oscillators. These observations are consistent with those of Karmakar and Gupta56 for SRF spectrum obtained on using a duration definition proposed by Karmakar57 and similar to that proposed in Banerjee and Gupta.53 These observations are partly consistent with the findings of Tiwari and Gupta,58 who reported negligible dependence on duration in the case of Trifunac–Brady definition for very stiff oscillators on hard rock sites. In the case of degrading oscillators, effect of duration is observed only for the low durations close to 10 s and flexible oscillators. It may however be observed that this effect is slightly greater in the case of McCann–Shah definition and much greater in the case of Trifunac–Brady definition. The period beyond which the effect of duration becomes significant depends on the duration definition used and on the site geology. These observations are broadly consistent with the observations of Chakraborti and Gupta59 for SRF spectrum in the case of (stiffness and strength) degrading oscillators and the Trifunac–Brady definition. Chakraborti and Gupta59 found that duration effects on SRF spectrum are insignificant for the stiff oscillators, while higher SRFs are obtained for longer durations in the case of hard rock sites and > 0.3 s.

4 PARAMETRIC STUDY FOR DEPENDENCE ON OTHER PARAMETERS
Synthetic accelerograms are generated from a database of 1274 records, compatible with seven more PSA spectra, to study the parametric dependence on earthquake magnitude, epicentral distance, and site geological conditions. Table 1 gives the parameters used to obtain these spectra. Focal depth is kept constant at 5 km in all of these cases.
Since strong motion duration appears to influence the spectra in the case of stiffness-degrading oscillators at low durations, two ensembles of synthetic accelerograms are considered in each of the seven cases: one for the 10 s duration and another for 20 s and higher durations. While the ensemble for 10 s duration is considered within a window of 9.5–10.5 s duration, the ensemble for higher durations is obtained by considering all accelerograms with strong motion duration greater than 19 s. The definition proposed by Banerjee and Gupta53 (and explained in Appendix A) is used for strong motion duration. Table 3 shows the sizes of ensembles in the two categories of strong motion duration for each of the seven PSA spectra. In the case of (nondegrading) elasto-plastic oscillators, since the dependence on strong motion duration did not follow any definite trends, the entire ensemble of 1274 accelerograms irrespective of their strong motion durations is considered. It may be mentioned that the results based on the second ensemble (of durations greater than 19 s) in the case of modified Clough oscillator and the complete ensemble in the case of elasto-plastic oscillator would include additional uncertainty due to the effects of strong motion duration on the inelastic displacement ratio .
| Spectrum no. | Number of records | |
|---|---|---|
| 10 s duration | ≥20 s duration | |
| V | 63 | 500 |
| VI | 64 | 593 |
| VII | 52 | 659 |
| VIII | 56 | 678 |
| IX | 57 | 671 |
| X | 54 | 698 |
| XI | 47 | 730 |
4.1 Dependence on earthquake magnitude
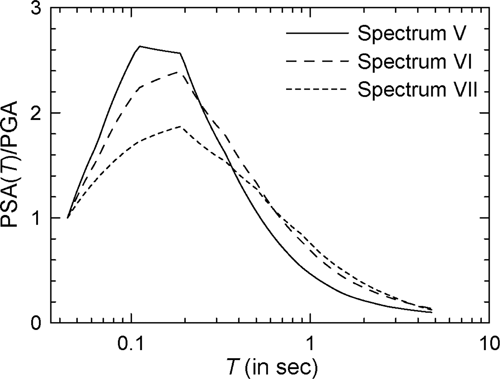
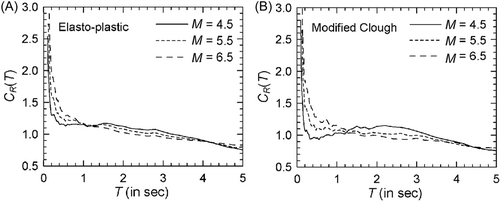
To study the effect of earthquake magnitude, mean spectra are obtained for the magnitudes of 4.5, 5.5, and 6.5 in the case of 50 km epicentral distance and rock sites (i.e., for Spectra V–VII, respectively) with = 4. The three (target) PSA spectra are shown in Figure 14. Figure 15 shows the comparisons of the mean spectra for (i) elasto-plastic oscillator and (ii) modified-Clough oscillator in the case of 10 s duration (see Supporting Information: Figure S14 for the log–log version). The results for the modified-Clough oscillator in the case of durations 20 s are not shown, because those are qualitatively similar to those for the modified-Clough oscillator in the case of 10 s duration. It is seen in Figure 15 that values for = 4 increase with earthquake magnitude only for the oscillators with < 1.0 s. For oscillators with periods between ~1 and 4.5 s, those decrease with increase in the earthquake magnitude. Though this is true for all the three cases of earthquake magnitude, the modified Clough oscillator is associated with greater effects of magnitude than the elasto-plastic oscillator. The level of this dependence with the variation in earthquake magnitude is found to increase with increasing . These results are in partial disagreement with the findings of Ruiz-García and Miranda27 for elasto-plastic oscillators on firm sites as they observed the effect of magnitude only for the stiff structures. However, these results are in broad agreement with those for SRF spectra by Tiwari and Gupta58 and Karmakar and Gupta56 in the case of elasto-plastic oscillators, and by Chakraborti and Gupta59 in the case of degrading oscillators. It may be mentioned here that the reversal in the effect of magnitude around 1 s period has been observed in all three studies.
4.2 Dependence on epicentral distance
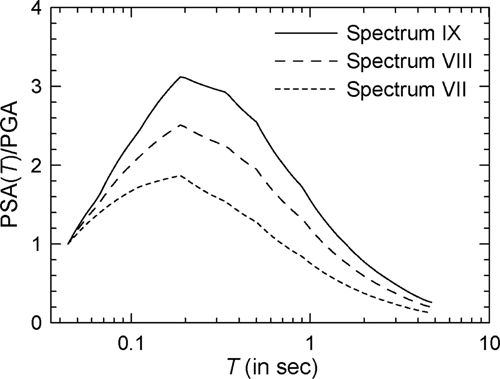
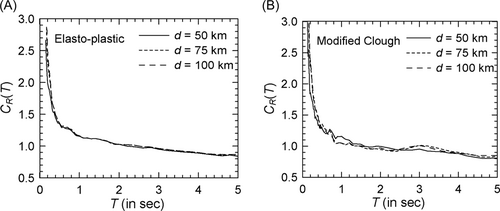
For studying the effect of epicentral distance on spectra, three cases of PSA spectra are considered, namely Spectra VII, VIII, and IX for = 50, 75, and 100 km, respectively, with = 6.5 and hard rock site condition. The three (target) PSA spectra are shown in Figure 16. Figure 17 shows the comparison of the mean spectra for = 4 in the case of elasto-plastic oscillators, and modified Clough oscillators with 10 s duration accelerograms (see Supporting Information: Figure S15 for the log–log version). The mean spectra for the modified Clough oscillators with 20 s duration accelerograms are qualitatively similar to those for the modified Clough oscillators with 10 s duration accelerograms. In none of the two cases shown in Figure 17A,B, an appreciable effect of epicentral distance is seen, with the curves for different distances either completely coinciding or intersecting at random. This observation is in agreement with the conclusion of Ruiz-García and Miranda27 in the case of elasto-plastic oscillators that there exists no significant dependence of inelastic displacement ratios on epicentral distance over the entire range of periods. Karmakar and Gupta56 also found in their study of SRF spectrum the negligible effect of epicentral distance. However, Baez and Miranda24 obtained greater inelastic displacement ratios for 0.1 < < 1.3 s in the case of near-field motions, and thus, there remains a possibility of epicentral distance becoming an important parameter in the near-field situations.
4.3 Dependence on local site geology
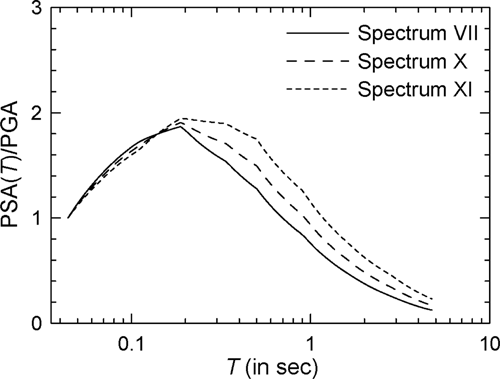
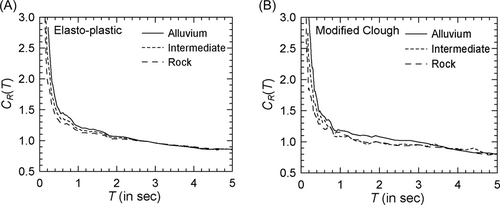
A parametric study is conducted for the dependence on site geology by keeping earthquake magnitude and epicentral distance fixed at 6.5 and 50 km, respectively, and by comparing the mean spectra for = 4 in the case of alluvium, intermediate, and rock sites. Figure 18 shows the target PSA spectra, that is, Spectra XI, X, and VII, respectively, for these sites. Figure 19A,B shows the comparison of the spectra, respectively, for the elasto-plastic oscillators and modified Clough oscillators with 10 s duration records (see Supporting Information: Figure S16A,B, respectively, for the log–log versions). Results are not shown for the modified Clough oscillators in the case of 20 s duration accelerograms. It may be observed from Figure 19 that spectra depend on the site geology, except in the case of flexible to very flexible oscillators, with higher values obtained for the alluvium sites. Ruiz-García and Miranda27 also reported similar results in the case of elasto-plastic oscillators with maximum effect for < 0.2 s and negligible effects for > 1.2, 1.0, and 1.4 s, respectively, for NEHRP soil classes B, C, and D.15, 16 The present study gives negligible dependence for > 2 s in the case of elasto-plastic oscillators and for > 0.8 s in the case of modified Clough oscillators. These results are in agreement with those of Karmakar and Gupta56 for SRFs in the case of elasto-plastic oscillators with < 2.5 s. This agreement exists at most periods with the results of Tiwari and Gupta58 for elasto-plastic oscillators and with Chakraborti and Gupta59 for (stiffness and strength) degrading oscillators.
5 DISPERSION IN VALUES
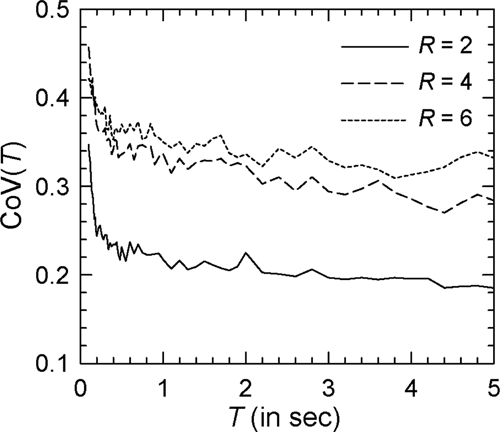
The parametric study as above has been based on the mean spectra, and thus, various observations made are strictly true for the average trends in these spectra. It is therefore desirable to give an idea of the dispersion or variability in the results of this study. Figure 20 shows the CoV spectra corresponding to three different levels of yield strength ( = 2, 4, 6) in the case of elasto-plastic oscillator with = 6.5, = 50 km, and rock site condition (i.e., Spectrum VII). It may be seen that dispersion for any remains almost constant for > 0.2 s, while it shoots up by about 50% for < 0.2 s. This rise in the dispersion levels for < 0.2 s is perhaps due to inherent instability in the factors as elastic displacement demands become negligibly small at these periods.
6 SCALING MODEL FOR INELASTIC DISPLACEMENT RATIO SPECTRUM
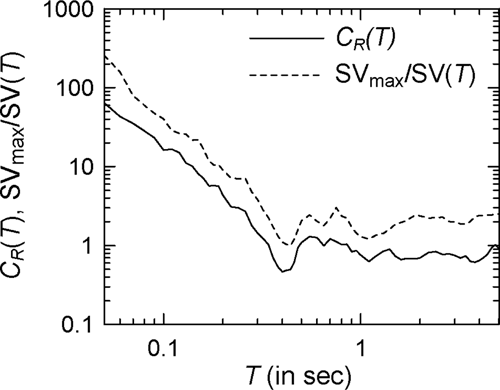
This implies that can be regressed on , with (=, say) and being the linear regression coefficients.
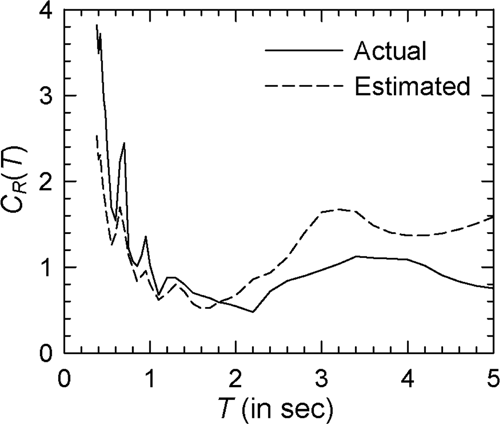
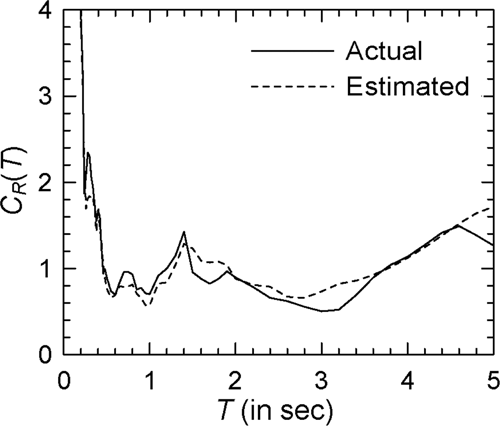
For illustration, 10 accelerogram records as listed in Table 4 are considered. The regression coefficients obtained for these accelerograms along with the starting period are shown in Table 5 for the elasto-plastic and modified Clough oscillators with = 4. It may be observed that the values of and vary significantly from one ground motion to another. Those also depend strongly on the type of nonlinearity as seen in the case of Record Nos. 3 and 7, and on the extent of nonlinearity as shown by the results in Tables 6 and 7 for = 2 and = 6, respectively. Figures 22-24 show the comparisons of (actual) and (estimated) spectra for Record Nos. 4, 5, and 8, respectively, in the case of elasto-plastic oscillators with = 4 (see Supporting Information: Figures S17–S19, respectively, for the log–log versions), while Figures 25-27 show these results in the case of the modified Clough oscillators with = 4 (see Supporting Information: Figures S20–S22, respectively, for the log–log versions). It may be observed that the estimated spectra are able to capture various trends in the actual spectra reasonably well, and that the two sets of spectra are in good agreement at most periods in almost all the cases considered. One could have considered SD() (in place of SV()) in the proposed model due to similar characteristics as SV() for very stiff and very flexible oscillators. However, SD() has energy at long periods and is likely to lead to improvements at periods longer than the usual range of interest.
| Record no. | Earthquake event | Site | Component |
|---|---|---|---|
| 1 | Kern County, 1952 | Taft Lincoln School Tunnel, Kern County | Vertical |
| 2 | Mt. Diablo, 1980 | Del Valle Dam (toe), Livermore | S66W |
| 3 | Oroville Aftershock 6, 1975 | Oroville Airport, Oroville | N90W |
| 4 | San Fernando, 1971 | 1013 Cholame-Shandon Array No. 2 | N51E |
| 5 | Northridge, 1994 | Sylmar-Converter Station, Valve Group 7, Free-Field | E52S |
| 6 | San Fernando, 1971 | 1013 Cholame-Shandon Array No. 2 | N39W |
| 7 | Mexico Earthquake, 1985 | Suchil (Guerrero Array) | N00W |
| 8 | Imperial Valley, 1940 | Imperial Valley Irrigation District, El Centro | S00E |
| 9 | Parkfield, 1966 | Lincoln School Tunnel, Taft | N21E |
| 10 | Livermore, 1980 | Fidelity Savings, Walnut Creek | East |
| Record no. | Elasto-plastic | Modified Clough | ||||
|---|---|---|---|---|---|---|
| (s) | (s) | |||||
| 1 | 0.30 | −0.146 | 0.715 | 0.30 | −0.205 | 0.709 |
| 2 | 0.22 | −0.320 | 0.814 | 0.20 | −0.368 | 0.941 |
| 3 | 0.40 | −0.126 | 0.972 | 0.40 | −0.281 | 1.204 |
| 4 | 0.60 | −0.100 | 0.860 | 0.50 | −0.186 | 0.895 |
| 5 | 0.36 | −0.327 | 0.861 | 0.38 | −0.288 | 0.931 |
| 6 | 0.40 | −0.118 | 0.898 | 0.44 | −0.149 | 0.919 |
| 7 | 0.18 | −0.176 | 1.116 | 0.17 | −0.163 | 0.843 |
| 8 | 0.17 | −0.215 | 0.993 | 0.20 | −0.243 | 1.163 |
| 9 | 0.26 | −0.216 | 0.902 | 0.26 | −0.279 | 0.948 |
| 10 | 0.16 | −0.233 | 0.662 | 0.16 | −0.178 | 0.558 |
| Record no. | Elasto-plastic | Modified Clough | ||||
|---|---|---|---|---|---|---|
| (s) | (s) | |||||
| 1 | 0.15 | −0.116 | 0.316 | 0.16 | −0.150 | 0.355 |
| 2 | 0.13 | −0.227 | 0.573 | 0.20 | −0.218 | 0.591 |
| 3 | 0.22 | −0.112 | 0.461 | 0.24 | −0.199 | 0.714 |
| 4 | 0.28 | −0.154 | 0.575 | 0.28 | −0.187 | 0.584 |
| 5 | 0.17 | −0.141 | 0.381 | 0.24 | −0.151 | 0.465 |
| 6 | 0.19 | −0.069 | 0.311 | 0.22 | −0.095 | 0.440 |
| 7 | 0.16 | −0.072 | 0.534 | 0.16 | −0.109 | 0.565 |
| 8 | 0.12 | −0.166 | 0.614 | 0.08 | −0.121 | 0.416 |
| 9 | 0.14 | −0.112 | 0.281 | 0.26 | −0.143 | 0.393 |
| 10 | 0.14 | −0.100 | 0.275 | 0.16 | −0.191 | 0.543 |
| Record no. | Elasto-plastic | Modified Clough | ||||
|---|---|---|---|---|---|---|
| (s) | (s) | |||||
| 1 | 0.44 | −0.201 | 1.064 | 0.30 | −0.209 | 0.959 |
| 2 | 0.28 | −0.361 | 0.981 | 0.26 | −0.420 | 1.081 |
| 3 | 0.44 | −0.157 | 1.201 | 0.40 | −0.279 | 1.206 |
| 4 | 0.75 | −0.141 | 1.418 | 0.65 | −0.141 | 0.928 |
| 5 | 0.38 | −0.390 | 1.102 | 0.44 | −0.321 | 0.947 |
| 6 | 0.46 | −0.134 | 1.086 | 0.50 | −0.103 | 0.958 |
| 7 | 0.26 | −0.101 | 0.933 | 0.17 | −0.139 | 0.985 |
| 8 | 0.22 | −0.172 | 1.061 | 0.22 | −0.188 | 1.141 |
| 9 | 0.38 | −0.308 | 1.593 | 0.30 | −0.313 | 1.191 |
| 10 | 0.18 | −0.324 | 1.034 | 0.22 | −0.207 | 0.695 |
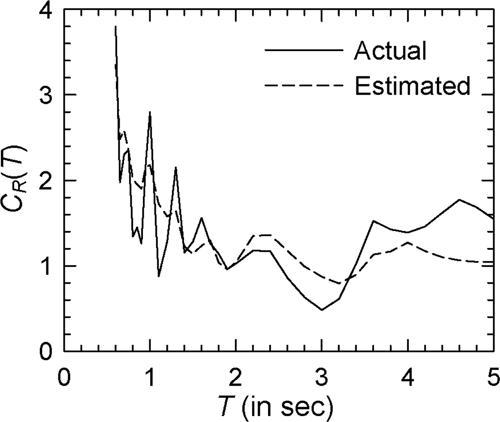
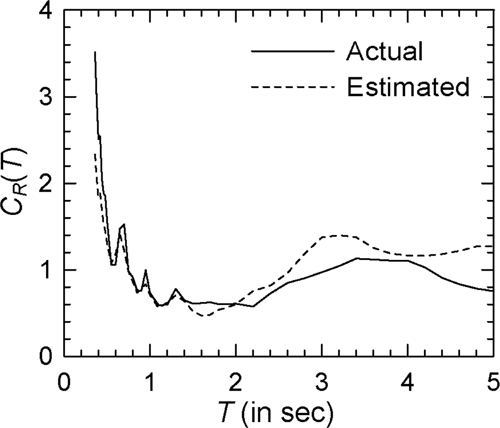
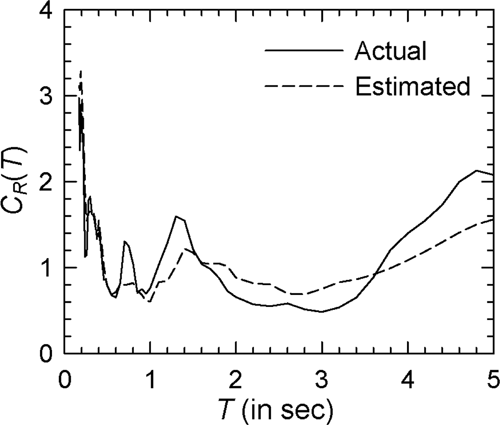
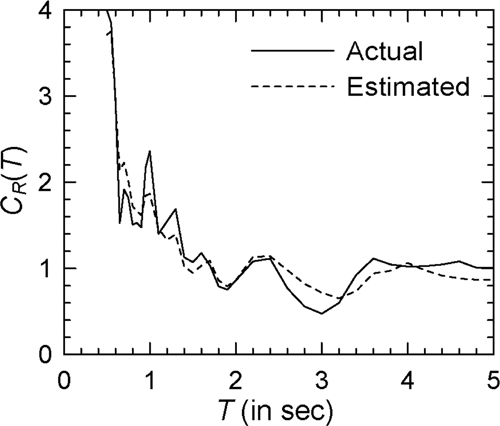
The estimates, = and = , giving the best fit of to and smoothed along are obtained. Thus, the spectrum for a given confidence level may be estimated by calculating the spectrum corresponding to = and = in Equation (6) and by using Equation (5) along with Equation (4).
The validity of the normal distribution assumption for the error residuals is checked by using the two well-known “goodness-of-fit” tests, namely, the χ2 statistics and the Kolgomorov–Smirnov statistics KS tests. The two tests are performed at each for a given set of SV, , , , , and , and the results are checked against the 95% cut-off levels for the respective tests.
For the purpose of numerical illustrations, PSA spectra are considered (instead of the SV spectra) to specify seismic hazard for the given source and site characteristics, and the corresponding SV spectrum in each case is obtained by smoothing the SV spectrum for an arbitrarily selected PSA()-compatible accelerogram. The estimates and are obtained in the case of Spectra V, VI, and VII (refer Table 1) for both elasto-plastic and modified Clough oscillators with = 4. It may be noted that all three target spectra correspond to different earthquake magnitudes, with the other parameters remaining fixed. While the entire suite of 1274 accelerograms is considered in the case of the elasto-plastic oscillators, the ensembles of 63, 64, and 52 accelerograms with strong motion durations of 9.5–10.5 s are employed, respectively, for Spectra V, VI, and VII in the case of the modified Clough oscillators. The value of is arbitrarily taken as 0.10 s for all three target spectra. Regression coefficients obtained for all six cases are shown in Table 8. The mean and standard deviation values of the error residuals, that is, and , at 16 periods are presented in Supporting Information: Tables S1–S3, respectively, for Spectra V, VI, and VII. Supporting Information: Figure S23 shows the results of the chi-square test in the case of Spectrum VII for the elasto-plastic oscillators with = 4, while Supporting Information: Figure S24 shows those for the modified Clough oscillators with = 4. Parallel results for the KS test are shown in Supporting Information: Figures S25 and S26. The dashed line in each figure denotes the 95% cutoff level for the corresponding test. It is found that the performance in both tests is satisfactory in the case of the modified Clough oscillators except at a few periods (see Supporting Information: Figures S24 and S26). This is however not true with the chi-square test in the case of the elasto-plastic oscillators, with most of the points exceeding the cutoff level (see Supporting Information: Figure S23). However, since about 90% of the points in the KS test lie below the cutoff level (see Supporting Information: Figure S25), the assumption that the error residuals as computed in Equation (5) are normally distributed, may be considered acceptable in the case of the elasto-plastic oscillators also. A similar picture is found to be applicable in the case of the other target spectra.
| Spectrum no. | Elasto-plastic | Modified Clough | ||
|---|---|---|---|---|
| V | −0.014 | 0.707 | −0.028 | 0.457 |
| VI | −0.057 | 0.792 | −0.039 | 0.781 |
| VII | −0.068 | 0.789 | −0.023 | 0.712 |
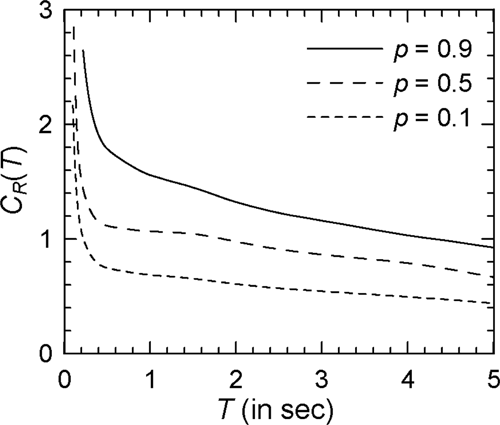
Supporting Information: Figures S27 and S28 show the comparisons of the actual error residuals with those based on Equation (6) with = and = , for Spectrum VII in the case of the elasto-plastic and modified Clough oscillators (with = 4), respectively. The solid lines represent the curves based on the actual probability distribution, , while the dashed lines correspond to the estimated values based on the normal distribution of Equation (6). An excellent match is observed among the two sets, thus confirming the validity of the description of uncertainty in via , , and Equation (6). A comparison of the spectra for = 0.1, 0.5, and 0.9 is shown in Figure 28 in the case of Spectrum VII and elasto-plastic oscillators with = 4 (see Supporting Information: Figure S29 for the log–log version). This figure shows that the values of may vary from 0.8 to 1.9 for 0.5 s oscillators within an 80% confidence interval due to uncertainty with the temporal characteristics of the ground motion. Therefore, it may be advisable to consider spectra for a higher value of (rather than the mean spectra) for real-life applications.
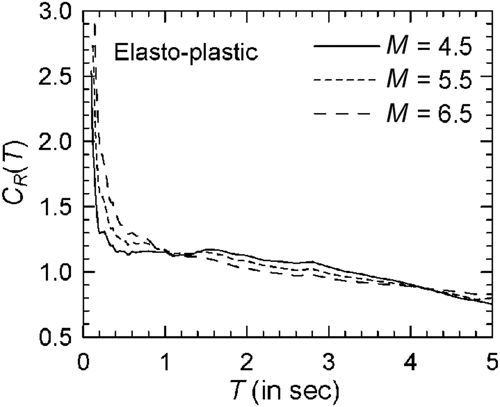
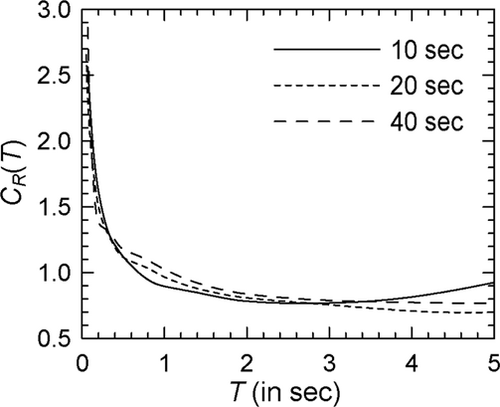
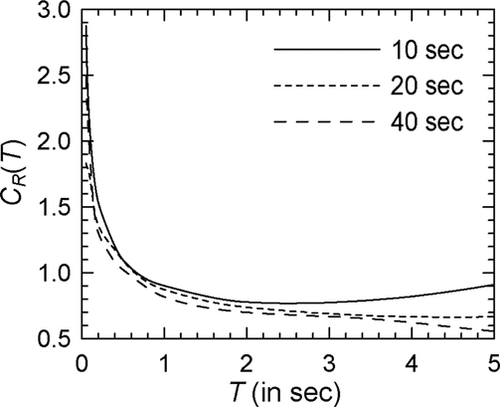
A comparison of the estimated spectra for = 0.5 and elasto-plastic oscillators ( = 4) with Spectra V, VI, and VII as the target spectra is shown in Figure 29 (or Supporting Information: Figure S30 showing the log–log version). Since the three target spectra differ only in the values of earthquake magnitude, this comparison reflects how spectra depend on the earthquake magnitude (with other parameters remaining unchanged). Similar trends are observed here related to the effects of earthquake magnitude as in the parametric study. Further, to test whether the trends observed for the dependence on strong motion duration are also preserved with the estimates of the proposed scaling model, spectra are obtained for the 10, 20, and 40 s duration ground motion ensembles (with the sample sizes of 74, 55, and 32, respectively) having compatibility with Spectrum I. Figures 30 and 31 respectively show the comparisons of the curves for the three (central) durations in the case of the elasto-plastic and modified Clough oscillators with = 4, where is taken as 0.05 s (see Supporting Information: Figures S31 and S32, respectively, for the log–log versions). No definite trends are observed from these figures, as regards the dependence in the case of elasto-plastic oscillators. In the case of modified Clough oscillators, shorter durations appear to be associated with greater values. However, this effect is significant only for the durations close to 10 s, and in the case of the flexible to very flexible oscillators. Similar conclusions were obtained previously from the direct parametric study of the spectra.
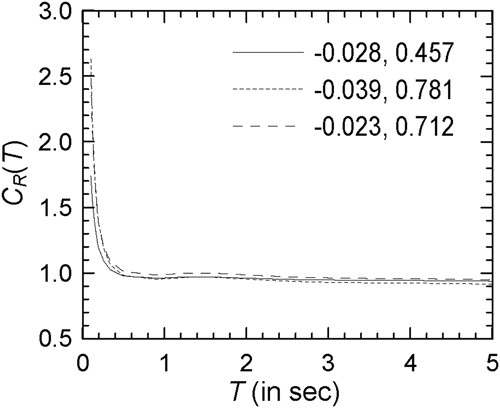
The proposed scaling model can be used to estimate the spectrum from the specified SV spectrum at a given level of confidence, provided and values are available for the given SV spectrum, and type and level of nonlinearity of the oscillator, along with the corresponding error estimates. While the SV spectrum may be estimated from a specified PSA spectrum using the formulations of Gupta,60 Pal and Gupta,61 and Samdaria and Gupta62 for the short, intermediate, and long periods, respectively, the need of a different set of and values for a different PSA spectrum (with the type and level of nonlinearity remaining unchanged) appears to limit the utility of the proposed scaling model. To this end, it will be useful to explore whether the regression coefficients computed for a specific seismic hazard can be used when a different PSA spectrum represents the seismic hazard. Figure 32 shows the comparison of spectra obtained by using the SV spectrum obtained from Spectrum VI together with three different pairs of regression coefficients for modified Clough oscillators with = 4 (see Supporting Information: Figure S33 for the log–log version). As shown in Table 8, these pairs are (a) = −0.028 and = 0.457 (for Spectrum V), (b) = −0.039 and = 0.781 (for Spectrum VI), and (c) = −0.023 and = 0.712 (for Spectrum VII). Since no error estimates are added, the spectra shown in Figure 32 are the best-fit estimates. The closeness of these spectra indicates the possibility of a single pair of and values becoming applicable to a wide variety of PSA spectra in estimating the best-fit spectra for a given type of nonlinear oscillator and level of nonlinearity (in terms of the R value). However, further study needs to be carried out to verify this possibility.
7 CONCLUSIONS
A study has been carried out for the parametric dependence of the inelastic displacement ratio spectrum and for a scaling of this spectrum for convenient application in the evaluation of existing structures. The parametric dependence of spectrum has been studied in the case of earthquake magnitude, epicentral distance, strong motion duration, and site geology parameters and elasto-plastic and (stiffness-degrading) modified Clough oscillators. This has been done by considering a suite of 1274 accelerograms recorded in the western USA and by modifying those to create several ensembles compatible with the chosen target PSA spectra.
No definite trends have been observed in the parametric dependence of the mean spectrum on strong motion duration in the case of elasto-plastic oscillators. In the case of modified-Clough oscillators, longer durations appear to be associated with lesser displacement ratios, but only when the durations are not significantly longer than 10 s. This effect of duration has been found to be prominent for the oscillators with periods greater than 0.5 s in the case of alluvium sites and 2 s in the case of rock sites. Similar trends have been observed on using the Trifunac–Brady and McCann–Shah duration definitions.
Earthquake magnitude has been found to affect the mean spectrum significantly for both elasto-plastic and modified Clough oscillators. Lower values have been obtained for greater magnitudes in the case of oscillators with periods between 1 and 4.5 s, while this trend is reversed for the periods greater than 1 s. Parametric dependence on epicentral distance has been found to be insignificant. Site geology has been found to affect the mean spectrum to a considerable extent for the periods less than 2 s in the case of elasto-plastic oscillators and 0.8 s in the case of modified Clough oscillators, with greater displacement ratios obtained for the alluvium sites. It has also been observed that ground motions considered for the parametric study are associated with comparable levels of dispersion in the inelastic displacement ratios at all the periods greater than 0.2 s.
The scaling model proposed to estimate the spectrum uses the SV spectrum normalized to the maximum unit value, and involves two coefficients required to be obtained from a regression analysis. This model has been found to nicely capture the trends in the actual spectra with good matching observed at most periods. The proposed model has been used to estimate the regression coefficients for different seismic hazard situations corresponding to different source and site parameters by considering the ensembles of (spectrum-compatible) accelerograms used in the direct parametric study. Error estimates have also been obtained for the spectra corresponding to the estimated coefficients, and those have been found to follow the log-normal distribution. The median inelastic displacement ratio spectra predicted with the help of the computed coefficients and error estimates have been found to be consistent with the trends obtained from the direct parametric study.
It may be mentioned that the SDOF oscillators considered in this study do not represent the behavior of the structures having large plan dimensions, in which the assumption of single-point excitation does not remain valid and the effects of differential ground motions need to be considered, as in Jalali and Trifunac,63 Jalali et al.,64 and Trifunac et al.65 for example.
CONFLICTS OF INTEREST
The authors declare no conflicts of interest.


