High-frequency decay of Fourier spectra of strong motion acceleration and nonlinear site response
Abstract
We examine how the decay of high-frequency amplitudes of Fourier spectra of strong earthquake ground acceleration (described in seismological literature by the slope parameter ) depends on the soil and geological site conditions at the recording stations in the Los Angeles metropolitan area. Then, we introduce a Gedanken numerical experiment, in which we analyze nonlinear wave motion in shallow soil and show that it also leads to similar decay of the high-frequency spectral amplitudes. The results of both of our studies are consistent with the interpretation that the decay of high-frequency Fourier spectra of strong motion acceleration, described by , occurs at the recording site near the ground surface.
1 INTRODUCTION
In the high-frequency range (), the amplitudes of Fourier spectra of strong earthquake ground acceleration begin to decay with increasing frequency. On log-linear plots of spectral amplitudes, plotted versus linear frequency scale, the early studies of this decay chose to describe it by a straight line, with a slope , and when extrapolated to zero epicentral distance they called it .1 During the following four decades, little has changed, and the researchers continue to work with such a straight line fit, without exploring whether a higher order fit should be considered, and, if so, based on what models of the underlying physical process. The papers on the subject often begin by just noting that it is not certain what causes this high-frequency decay and cite several alternatives that it might be a result of attenuation in the top layers of crust, the local site effects, the nature of slip at the earthquake source,2, 3 or the wave propagation along the wave path.
What is common among most of the papers on is that (i) the ground motion is viewed as linear wave propagation, and (ii) in some studies the recording site conditions are considered in terms of (engineering parameter that describes the shear wave velocity in the top 30 m below the surface). In many other papers, the site conditions are ignored. Many papers just describe the values of and in a specific seismic region in which the data has been recorded.4-15 How the geological site environment might influence the observed values of has been rarely considered,1 but a number of papers do show that the soil parameter does influence the observed values of . This suggests that the attenuation of ground motion at high frequencies occurs close to the ground surface, where the wave velocities in the soil are low. In this paper, we further examine this interpretation and also conduct a Gedanken numerical experiment based on the hypothesis that the reduction of high-frequency amplitudes is caused by the nonlinear wave motion through the soil deposits.
Published results show considerable scatter in the observed values of . This is apparently caused by the common sources of variability that accompany most other aspects of strong ground motion: (i) different source-to-station paths for different earthquakes,16-18 (a) wave paths through different geological materials, and (b) different depths reached by the wave paths,19 (ii) variations in the geological site conditions beneath and surrounding the recording sites, (iii) variations in the soil properties at depth, bellow the top 30 m,20 (iv) fluctuations introduced into the end results by inaccurate determination of the site conditions (according to Idriss21 less than 37% of all assignments are based on site measurements), (v) selection of scaling parameters for earthquake size (magnitude, epicentral intensity), (vi) ambiguities associated with the representative source to station distance, and (vii) departures of wave motion from its classical linear representation, among several other. To reduce some of this scatter in the example that we will consider in the first part of this paper, we revisit the data from only one event, the San Fernando, 1971, California earthquake, for which many of the abovementioned sources of fluctuations would not contribute, and for which the recording site parameters all have been carefully verified. We will also perform simple numerical study to explore the possible role of nonlinear waves in the soft soil deposits.
For the design of earthquake-resistant structures, it is necessary to describe the strong ground motion for intermediate and strong ground shaking amplitudes, typically for > 5 and near the earthquake source. Many studies of used recordings of acceleration from small events, less than ~ 5,5, 8, 9, 22-31 with only few studies reporting on for strong motion data that also includes some larger events.1, 32-36 If one further restricts the scope of analyzing to only damaging amplitudes of strong ground motion (e.g., with peak ground velocities greater than 25 cm/s37; that is, large earthquakes with surface and near-surface faulting, and at small epicentral distances, say less than 25 km), one would find no published papers that describe under such conditions. Therefore, the existing literature on is useful for the studies of the physical nature of high-frequency attenuation of small and almost linear amplitudes of earthquake ground motion. To be useful for engineering applications, the lessons learned then have to be extrapolated to the domain of damaging levels of strong motion amplitudes in a typical urban environment where soft sediments and soils will be associated to various degrees with nonlinear site response.38, 39 To a degree, the nonlinear site response can be beneficial because it reduces the power of strong motion waves entering into the structures,40-46 but it also changes the site characteristics inferred from small amplitude, linear site response analyses.47-50 Consequently, it is not sufficient to state that the data used for the analysis of correspond to a certain earthquake magnitude unless the distance to the fault is also documented. For relative scaling purposes it would be better to include the peak ground velocity at the site, because, when combined with information on , it can be used to infer approximately the amplitudes of strain in the soil.51, 52 Furthermore, the results from studies that include site amplification (via H/V ratios or by one-dimensional (1D) modeling of the soil response) cannot and should not be used in the specification of strong motion amplitudes for engineering design, because the nonlinear site response completely changes the nature of site response determined from small amplitudes and linear response. The frequencies at which the site amplification occur for small wave amplitudes are shifted or completely disappear during nonlinear site response.47-49, 53
2 SITE CONDITION PARAMETERS BEYOND
The studies that investigate the dependence of on the local site conditions have used only . Few studies discuss the role of the site conditions deeper than 30 m, and they do so only qualitatively and in connection with the contribution to attenuation from the dependence on the quality factor at depth.54 The site parameter has appeared in many empirical scaling equations of spectral amplitudes of strong motion21, 55-60 in spite of the fact that it is not a statistically significant proxy for describing the site amplification effects.61, 62 The lack of its significance is attributed to the fact the does not include the dependence on soil properties at depth greater than 30 m.63
The sketch in Figure 1 describes a more general set of site parameters and how these parameters relate to the transmission along the seismic wave path. “Linear” describes models based on linear mechanics and includes essentially all seismological formulations. “Nonlinear” describes the nonlinear response of soil and sediments. “Chaos” refers to the cases that involve very large nonlinear deformations at the site (lateral spreading, sliding of blocks, landslides, and alike). The “box” in Figure 1 describes the volume wherein a particular model of “site parameters” applies, and its size depends on the frequency band under consideration. For frequencies between 0.2 and 25 Hz and a layered half space with, for example, a surface layer having shear wave velocity of, say, 100 m/s and a “deep” layer having 2 km/s, the range of the considered wavelengths would be from several meters to 10 km. Thus, the size of the appropriate box representing the site parameters may have to be large.
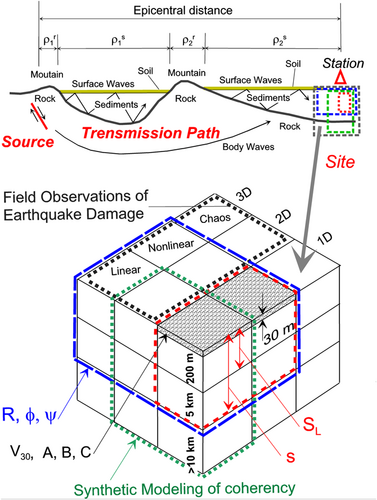
In Figure 1, 1D, 2D, and three-dimensional (3D), refers to the dimensions of the model adopted for analysis. 1D corresponds to most engineering models that assume vertically propagating shear waves. 2D represents models that aim to approximate the 3D space by representative 2D cross sections. 3D will model the 3D space surrounding the site.
The three “layers” in Figure 1 illustrate how a particular parameterization of the site extends below the ground surface. The shaded shallow layer on the top corresponds to models in which the site conditions are parameterized in terms of only one categorical variable . The site parameterization that uses both the soil and the geological site parameters, and , respectively, will include the top two layers, the top one for , and the layer below for (Trifunac20, 64 for a description of all those variables). The site parameterization that requires all three layers, and, hence, may extend to considerable depths below the surface, will be required for modeling of coherencies in parallel-layered structures.65 The recording site parameters should (a) reflect the main features of the process studied and must be relevant from the earthquake engineering point of view, and (b) to the extent possible, the site parameters should play mutually independent roles in the regression analyses leading to the empirical scaling laws.
In this paper, we will work with , for soil sites (, for sites with a shear-wave velocity of less than 800 m/s and a thickness of less than 10 m; stiff soil sites , with a shear-wave velocity of less than 800 m/s and a soil thickness of less than 75–100 m; deep soil sites , with shear-wave velocity less than 800 m/s and thickness between 100 and 200 m; and soft-to-medium clay and sand, : in which the notation , 1, 2, 3 is as introduced and used in Trifunac66 and Lee67), and geological site parameters ( for sites on sediments; for intermediate sites and for sites on geological basement rocks).
3 CASE STUDY: SAN FERNANDO CALIFORNIA EARTHQUAKE OF 1971
To illustrate how depends on the various site parameters, we will consider only one example, of an earthquake for which we have a fairly complete set of site parameters. By selecting the data from only one earthquake, we eliminate the contributions to the data fluctuations caused by the earthquake size, and variations caused by regional dependence of attenuation, as it may vary with the depth of the wave paths and regional differences in the geology surrounding the site.
We use the values of κ1 and κ2 from Table 2 in Anderson and Hough.1 Their values of κ have been determined from the instrument and baseline corrected accelerograms, published in the series of Caltech EERL reports, in volumes C through S.68 For 98 sites at which strong motion was recorded during the San Fernando earthquake, in addition to κ1 and κ2, their Table 2 gives the duration of the time window for which the Fourier spectra were analyzed, the epicentral distance to the recording station, and the geological site parameter . For 73 of those stations, we have soil site parameters , and for 68 of those stations, we have data on the average shear wave velocity in m/s in the top 30 m of soil.
In Table 1, the first number shows the number of sites for that combination of and parameters, and the second number, after/, gives the percentage of this number relative to the total of 73. Thus, 16/22 shows that there were 16 sites on deep soil () below which are sediments (), and only two deep soil sites below which were intermediate rocks ().
| = 2 | = 1 | = 0 | |
|---|---|---|---|
| = 0 | 16/22 | 28/38 | - |
| = 1 | 2/3 | 17/23 | 4/5.5 |
| = 2 | - | 2/3 | 4/5.5 |
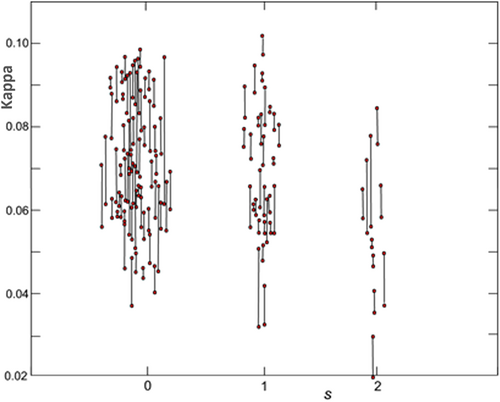
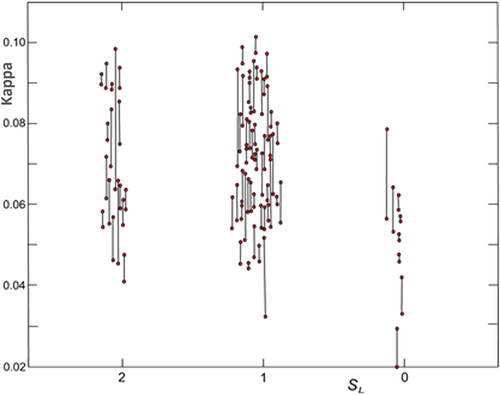
Figures 2-4 show , computed from the records of the Sam Fernando earthquake, respectively, versus the geological site parameter, , the soil site parameter, , and the average shear wave velocity in the top 30 m of soil, in m/s. The vertical line in Figures 2-4 connects evaluated from the two horizontal acceleration components at a particular station, while the circles at the end of the lines show the values of κ1 and κ2.
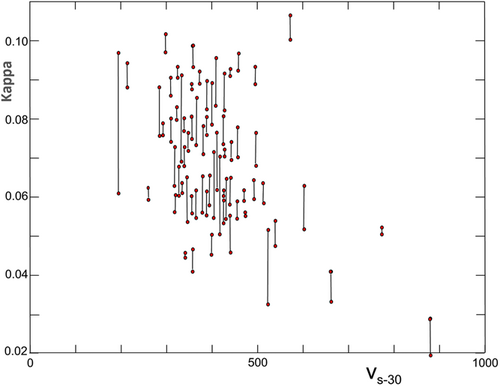
Figures 2 and 3 show that there is no significant difference between the distributions of the values of between the sites with and , and between and . The average values of are smaller at (geological basement rocks) and (“rock” soil sites). In spite of the large scatter of the data points, Figure 4 does show gradually decreasing values of with increasing . Together, Figures 2-4 show that significant reduction of occurs near the ground surface.
The selection of 30 m depth, where is evaluated, has no physical basis. It was adopted as a practical engineering depth because it is relatively easy to measure velocity in shallow soil using portable surface vibrators and with only several recorders placed on the ground surface. can also be approximately determined from empirical correlations with the standard geotechnical penetration test values, and by travel times near the ground surface determined by hammer tests, for example.
In Figure 5A, we show the distribution of versus approximate estimates of the strain near the ground surface, which is in terms of , where is the horizontal component of recorded peak velocity of strong ground motion and is the average shear wave velocity in the top 30 m of soil at the corresponding recording station. Horizontal peak velocities, , during the San Fernando earthquake (Figure 5B) were less than 32 cm/s at most recording stations throughout the Los Angeles metropolitan area, and only in 18% of time above 20 cm/s, which is the threshold beyond which major damage to buildings begins to occur.37 The largest horizontal peak velocities were recorded at the Pacoima dam site (113.2 cm/s in the S16E direction and 57.7 cm/s in the S74W direction), above the fault plane.69-72 The histogram of the corresponding recorded peak displacements shows that most peaks of strong motion displacement were bellow 20 cm (Figure 5C), with exception of the S16E component at the Pacoima dam site, which was 37.7 cm.
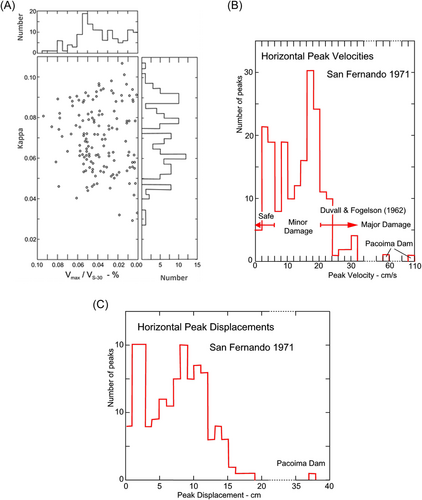
It is seen from Figure 5A that the values of surface strain accompanying the strong motion accelerations recorded during the San Fernando, California, earthquake range from 0% to 0.1%, for between 0.03 and 0.15.
4 NONLINEAR MODEL
In the following, we explore a hypothesis, via a numerical Gedanken experiment, that the high-frequency spectral decay of Fourier spectra of strong motion acceleration, as described by , might be explained, at least in part, as a consequence of energy loss accompanying the nonlinear seismic waves near the ground surface. We calculate the spectral decay of the Fourier amplitude spectra of acceleration on the ground surface, at high frequencies, for a simple nonlinear layer of shallow soil (Appendix A) for several yielding amplitudes, 0.05%, 0.10%, 0.5%, and 1%, in assumed elasto-plastic soil within depth –100 m bellow the ground surface and for amplitudes of vertically incident strong motion SH wave pulses , 5, and 10 cm. We assume the shear wave velocity in the soil is in the range from 300 to 1500 m/s. We compute the peak amplitude of the ground velocity on the surface of the soil layer, , for a pulse that has traveled through nonlinear soil layer of thickness . By dividing it by the amplitude of the incident pulse , arriving from the linear half space bellow, and by repeating the calculation of this ratio for different pulse frequencies, we obtain the reduction of spectral amplitudes illustrated in Figure 6. We calculated such ratios for the thickness of the soil layer in the range from to 100 m. We found only small variation in the results among the models with , 30, 50, and 100 m and, therefore, in the following, we present results only for m.
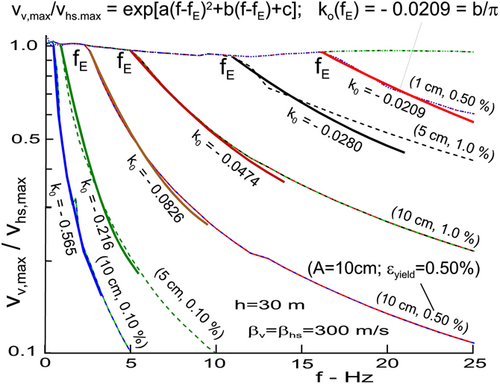
As it can be seen from Figure 6, a departure from a straight line fitted to begins beyond , with increasing amplitude of the incident wave and for decreasing .
Figure 7 shows that, for large amplitudes of strong motion, , small , and small , in the nonlinear model studied in this paper, is typically less than 2 Hz, but larger than Brune's corner frequency .
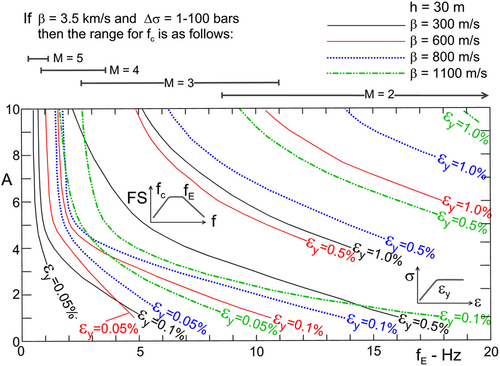
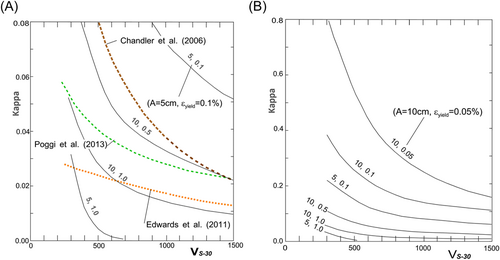
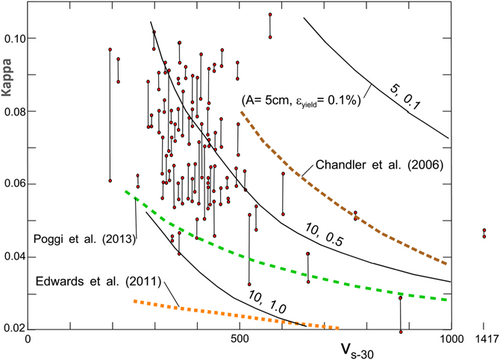
Figure 8A,B show variations of versus . Figure 9 shows that the extrapolated empirical dependence of versus in Chandler et al.54 is similar to the trend of in our nonlinear model for cm and 0.5%.
5 DISCUSSION AND CONCLUSIONS
The measured by Anderson and Hough,1 further analyzed in this paper in terms of the corresponding recording site conditions , , and , and the results of our simple model of nonlinear waves in the soil both suggest that the energy loss as described by occurs in the shallow soil near the ground surface. Our analysis applies only to strong motion amplitudes, during intermediate and large strong ground motion, for which the soil bellow the recording stations is expected to be nonlinear.38, 39, 45, 49, 50
In our nonlinear model (Appendix A), the decay of high-frequency spectral amplitudes begins for frequencies above . Frequency decreases with increasing amplitudes of strong motion, yielding strain in the soil , and . For intermediate and large earthquakes, > 5, in the vicinity of the earthquake source, our model predicts that will be less than about 2 Hz (Figure 7). For frequencies beyond and for intermediate and small earthquakes, the decay of spectral amplitudes can be approximated by a straight line in log-linear plots. However, with increasing amplitudes of strong motion, for small , and with increasing frequency, this decay slows down and cannot be described by a straight line. We approximated this decay above by the parabola in Equation (1) and computed from the slope of this parabola at . Thus computed for our nonlinear model are shown in Figure 8A,B, and are compared with measured by Anderson and Hough1 in Figure 9.
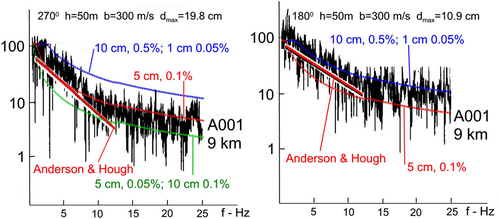
As noted above there is a considerable scatter of measured from station to station and among the horizontal components of recorded motions at each station (see vertical bars shown in Figures 2-4). In all published cases, the slope eventually decreases with increasing frequency, which typically results from the recorded signal gradually approaching the recording noise. But there are also examples of gradually decreasing slope of Fourier spectral amplitudes beyond , which are well above the recording noise amplitudes, and which, in the context of our Gedanken experiment, could be viewed as being caused by nonlinear waves in the soil beneath the recording station. One such example is the recording at El Centro strong motion station (record A001 in Hudson et al.69), during May 19, 1940, the Imperial Valley earthquake (). The Fourier spectra for the west ( = 270°) and south ( = 180°) recorded components of strong motion are plotted in Figure 10 and show decreasing slope for frequencies increasing beyond 10 Hz. This trend is consistent with the behavior of our Gedanken nonlinear model.
There are also examples of published spectral amplitudes, which show a decreasing slope () with increasing frequency, for which other than nonlinear site response must be sought to explain the observed trends. Figure 6 in Edwards et al.25 is one such example. Their case is in a different category relative to the San Fernando 1971 earthquake data we examine in this paper. It is from a recording of an event at 233 km epicentral distance, and at a recording site with 1600 m/s, the conditions which lead to essentially linear site response, and hence their example cannot be assumed to be associated with nonlinear site response.
For increasing site stiffness of rock (increasing ) and soil ( 800 m/s), our model shows moving toward high frequencies (Figures 6 and 7), and eventually beyond 25 Hz, which is typically the highest frequency used in earthquake engineering. This implies that for the analyses in such conditions, the Fourier spectra of band-limited strong motion accelerograms up to 25 Hz, will result in that is essentially zero. Indeed, zero slopes () of Fourier spectra have been observed for recordings on rock sites in eastern Canada and on firm soil sites in Ontario for Hz.11
The frequency range chosen for fitting the slope to Fourier spectra of recorded accelerations varies considerably from one study to the next, but usually does nor exceed 30 Hz, and only occasionally reaches 40 Hz.73 Most authors discuss and its relation to Brune's74 corner frequency , but do not try to measure it systematically and then report the values of for each Fourier spectrum in their study. Documenting the values and the associated trends of based on observations would help with further comparisons with the properties of nonlinear models and their more detailed verification.
CONFLICTS OF INTEREST
The authors declare no conflicts of interest.
APPENDIX A: THE MODEL AND FINITE DIFFERENCE (FD) FORMULATION
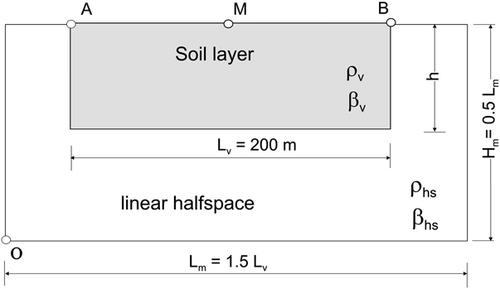
The model used in this paper is comprised of nonlinear valley with width and height h embedded in linear half space (Figure A1). We denote with and the peak velocities on the free surfaces of the valley and on the half space and with the velocity spectrum. Because we want to focus on the dependence of the velocity spectrum in terms of the nonlinear response of the soil, in our computations we take that the valley and the half space have the same density and the same shear wave velocities and restrict the nonlinear behavior to the soil layer only. In this way the values of the spectrum different than one will be only due to the nonlinear response of the valley. In all computations, we keep the same valley width , same densities 2000 , but we vary the shear wave velocities from 300 to 1500 m/s.
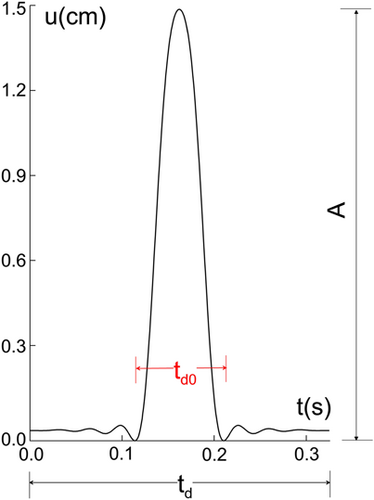
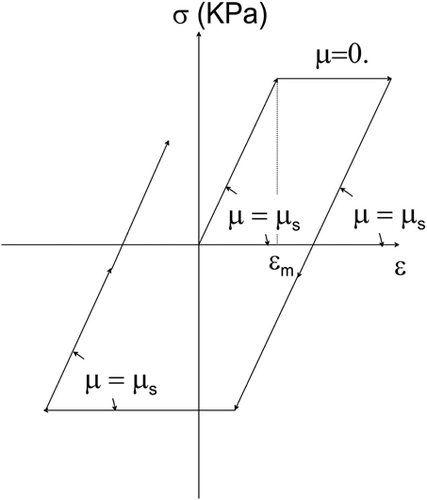
The incoming wave is taken to be a half-sine pulse (Figure A2), plane SH wave that is intended to model strong motion pulses observed in the ground motion near faults.75 For simplicity and as the first order consideration, in this paper we consider only the vertical wave incidence. To study how the level of non- linearity influences the velocity spectra, we vary the amplitude of the pulse from 0.1 cm to 10 cm, the frequency of the pulse from 0.1 to 25 Hz, and we also vary the yielding strain of the soil (Figure A3).
Accuracy of the FD grid depends on the ratio of the numerical and physical velocities of propagation , which ideally should be 1. The parameters that influence this accuracy are: (1) the density of the grid ( is the number of points per wavelength , and is the spacing between the grid points); (2) the Courant number, ( is time step); and (3) the angle of the wave incidence, . It has been shown by Alford et al.,77 Dablain,78 and Fäh79 that the error increases when decreases, decreases, and is close to 0 or . For a second-order approximation, the above authors recommend = 12.
To model the soil response numerically, we chose a rectangular soil box with dimensions m and m where m (Figure A1). The finest grid will be required for the shortest pulse corresponding with the highest considered frequency Hz and for the model with the lowest considered shear wave velocities m/s. For this case, the duration of the pulse is s and the length of the pulse is 6 m. However, the mode participating with at least 3% of the rigid body mode has wavelength m. Following the recommendations of points per wavelength, we find that for the lowest grid spacing we obtain = 3/12 = 0.25 m. In this way, for our numerical model (Figure A1) with dimensions 300 m/150 m the densest grid will have 1200/600 spatial points.
In our earlier papers,80, 81 we low-pass filtered the pulse, because the objectives of those studies were not related with extremely high frequencies and in that way we saved computational time. Here, because we study decrease of spectra at high frequencies, we do not low-pass filter the excitation.
We assume that the shear stress in the direction depends only upon the shear strain in the same direction and is independent of the shear strain in the direction. The motivation for this assumption comes from our simplified representation of layered soil, which is created by deposition (floods and wind) into more or less horizontal layers. The soil is assumed to be ideally elastoplastic, and the constitutive relationship is shown in Figure A3. Further, it is assumed that the contact points between the soil and half space remain bonded during the analysis, and that the contact cells remain linear, as does the zone next to the artificial boundary (the bottom four rows and the left-most and right-most four columns of points in the soil box shown in Figure A1).
Numerical tests have shown that the viscous-absorbing boundary rotated toward the middle of the scattering object—in this case, soil valley—reflects only a negligible amount of energy back into the model.82
The first equation in (A6) is the dynamic equilibrium of forces in the direction with neglected body force . The second and third equations give the relation between the strains and the velocity. The Lax-Wendroff computational scheme84 is used for solving Equation (A6).82


