A seismic emergency performance optimization model for infrastructure systems under demand differences: A case study in China
Abstract
Infrastructure systems play a crucial role in ensuring the safety of cities and the well-being of residents after earthquakes. Meanwhile, infrastructure systems are vulnerable to earthquakes and may fail to provide necessary services, highlighting the significant need to improve seismic emergency performance. Nevertheless, the seismic emergency performance of infrastructure systems still lacks effective enhancement strategies and optimization models, which makes it challenging to devise and benchmark appropriate emergency enhancement actions. This study proposes an emergency performance optimization model for infrastructure systems against earthquakes. The model aims at maximizing the effects of resistance actions and short-term recovery actions on infrastructure systems with consideration of residents' expectations of infrastructure performance after earthquakes. The efficacy of the proposed model is tested by a case study in China. Experiments and results illustrate advantages of the seismic emergency performance optimization and prioritize resistance and short-term recovery activities within constraints set by available resources.
1 INTRODUCTION
Earthquakes have caused serious problems in urban systems due to their unpredictable and destructive characteristics.1, 2 According to the Centre for Research on the Epidemiology of Disasters, the global deaths caused by earthquakes reached 721,318 from 2000 to 2019, accounting for 58% of the total deaths from natural disasters.3 Under earthquakes, the safety of infrastructure systems is essential to the well-being of the affected cities and people.4 For example, the 2008 Sichuan Earthquake caused 11,117 deaths and 36.6 billion dollars of direct losses to infrastructure systems, including transportation, power, and communications systems in Mianzhu City, Sichuan Province.5
During a seismic emergency, essential infrastructure systems are required to be more than structurally safe. They must maintain performance and continue to provide services for residents.6-8 The concept of seismic resilience provides a new perspective for infrastructure systems to explore emergency management.1, 9 Seismic resilience emphasizes the comprehensive capacity to resist, absorb and recover quickly from the disruption of earthquakes.10, 11 Emergency measures help absorb seismic energy, reduce economic losses when an earthquake occurs, and recover quickly to meet residents' needs provided by infrastructure systems.6 Therefore, improving emergency performance capabilities is the basis for improving the resilience of infrastructure systems.11, 12 Optimizing emergency performance is essential and fundamental to improving emergency capabilities, which aims to reduce the decline in system performance after earthquakes and quickly restore necessary services without the help of external resources.11, 13 Two corresponding preparedness measures are required: one for resistance actions and the other for short-term recovery actions, which work together for the infrastructure system to improve emergency performance. To be specific, resistance actions ensure the safety of residents' lives, such as engineering reinforcement measures to prevent houses from collapsing.14, 15 Short-term recovery actions maintain the well-being of residents, such as providing redundant medical supplies, food, and water shortly after the earthquake.16 This study uses this framework to optimize the effectiveness of resilience measures in infrastructure systems to improve emergency performance under earthquake strikes.
Performance optimization models for infrastructure systems have been developed to formulate the optimal combination of performance enhancement measures to improve the emergency ability of infrastructure systems.17, 18 Several performance indicators have been proposed to study the problem of optimizing infrastructure system performance under extreme events. Faturechi and Miller-Hooks19 maximized the system performance of transportation networks by travel time. Ouyang20 studied the functionality of different stages of a nine-node power system, quantifying infrastructure performance by accumulating system functions in stages. Zhang et al.21 proposed a bilevel optimization model for the configuration of logistics service centers, quantifying the system performance by cumulative travel time. These studies particularly focus on the performance of infrastructure systems from the engineering perspective. However, residents' needs for the expected performance of infrastructure systems remain a gap in these studies. Postdisaster residents' demand for services provided by infrastructure systems typically changes, leading to a severe imbalance of supply and demand.22, 23 For example, the hospital system performance dropped significantly during the 2008 Sichuan Earthquake.24 If the performance of the infrastructure system was simply restored to the pre-disaster levels, the services provided by the hospital system would not be able to meet the growing medical needs of residents. Therefore, optimization baselines need to be set for residents' expected system performance to make the optimization results meaningful. Statistical experiments show that the service demands of infrastructure systems can be estimated and simulated through experiments.25, 26 The needs for a certain type of disaster can be summed up from the analogous historical disaster cases, and statistical methods are used to derive the models and rules.27-29
Although the mathematical model of system performance optimization has been studied in different fields, there still lacks universal agreement on how to connect the infrastructure system performance with postdisaster demand changes. This study proposes a novel emergency performance optimization model considering residents' demand for the infrastructure system. The developed optimization model incorporates the effects of the resistance actions and the short-term recovery actions. Furthermore, a series of experiments are performed in a real hospital system as a case study to illustrate the emergency performance optimization model.
The contributions of this study are as follows. A comprehensive optimization model is formulated to maximize the effect function of resistance actions and short-term recovery actions of the seismic emergency performance, with the consideration of demand differences and different types of infrastructure systems. In addition, the expected performance of the residents is proposed to set the baseline for the target of the emergency performance optimization model, which provides practical significance for the optimization results. Moreover, this study illustrates the circumstances under which resilience enhancement actions may fail and that external assistance is necessary. The rest of this paper is organized as follows: Section 2 describes the research method and the proposed model formulation; Section 3 introduces the emergency performance optimization model and the algorithms for the solution; Section 4 demonstrates a case study and numerical analysis to illustrate the proposed model; Section 5 presents the concluding remarks and possible future research directions.
2 PROBLEM DESCRIPTION
This section presents a detailed description of the emergency performance optimization problem studied herein. The model aims at maximizing the effects of emergency enhancement measures to meet the expected performance of the residents with constraints set by available resources. Through the process of the change of the system performance, three functionality variables are designed in the stage of emergency. Denote NP as the normal performance of the infrastructure system. NP represents the system performance under normal daily conditions at a certain seismic intensity, which can be quantified by the daily number of inpatients in the hospital system, and the water supply of the water supply system before the disaster. Denote PP as the postdisaster performance. PP represents the lowest seismic system performance, which takes into account the effects of cascading failures. Denote EP as the expected postdisaster performance. EP represents the residents' expectation of the system performance and stands for the baseline that the system performance needs to achieve. Three patterns of possible changes in infrastructure system performance are illustrated in Figure 1. For example, when earthquakes occur, the system performance drops from NP to PP in a short period due to the fragility of the infrastructure system. The rebound from PP to EP is the response of the infrastructure system to changes in the demand of residents. In the emergency recovery stage, the rebound process from PP to EP is the response of the infrastructure system. The more resilient an infrastructure system is, the faster it achieves the desired performance, and the more effective its ability to respond to residents' demands.

-
Type 1 infrastructure systems (EP > NP > PP)
The services provided by a Type 1 infrastructure system are vital to the lives of urban residents. Infrastructure systems of PP drop significantly while EP increases significantly. Take the hospital system as an example. The gap between NP to PP is obvious after the 2008 Sichuan Earthquake, but the need for medical services surged. Even if the infrastructure system recovers to the full capacity of the NP level, it cannot adapt to the surge of postearthquake residents' demands.
-
Type 2 infrastructure systems (NP > EP > PP)
Moreover, when the residents' demands have not increased but the PP drops significantly, causing the services to fail to meet the EP. This type of infrastructure system should be assigned to a Type II infrastructure system. For example, some lifeline infrastructure systems belong to this type, such as power systems, transportation systems, water supply systems, and communication systems.30 The main reason that this type of infrastructure cannot reach a satisfactory state is poor vulnerability.31
-
Type 3 infrastructure systems (NP > PP > EP)
Lastly, other types can be assigned to a Type III infrastructure system. The services provided by this type are not urgent, such as the high-level needs of human beings.32 Even if the PP decreases, the infrastructure system can still fully meet the needs of the residents' EP due to the low level of the expected performance, such as the cultural system and entertainment systems.22
3 MATHEMATICAL MODEL DEVELOPMENT
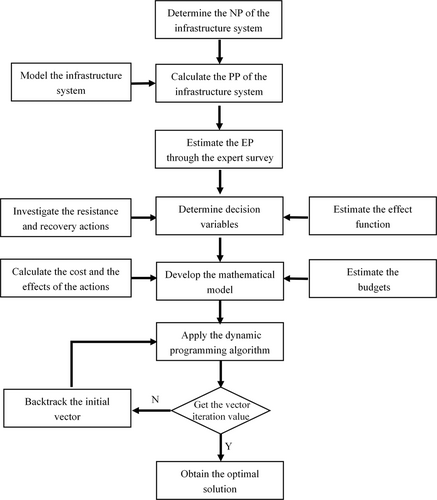
The emergency performance optimization problem addressed in this study is formulated as a group knapsack problem. The notations employed for the mathematical model are described in Table 1, and the computational flowchart is shown in Figure 2.
| Model type | Nomenclature | Description |
|---|---|---|
| Sets | S = {s1, …, sn} | Set of resistance actions |
| T = {t1, …, tn} | Set of short-recovery actions | |
| Pa | Set of upstream infrastructure systems | |
| Decision variables | Xs: s ∈ S | =1 if resistance action s is taken and 0 otherwise |
| Xt: t ∈ T | =1 if short-recovery action t is taken and 0 otherwise | |
| Parameters | Vs, s ∈ S | The function of effects of resistance actions |
| Ls, s ∈ S | Level of resistance action (e.g., number, scale, utility time of action) | |
| Ns, s ∈ S | Number of resistance action | |
| Vt, t ∈ T | The function of effects of short-recovery action | |
| Lt, t ∈ T | Level of short-recovery action (e.g., number, scale, utility time of action) | |
| Nt, t ∈ T | Number of short-recovery action | |
| ε | The Gaussian noise | |
| σ | The standard deviation | |
| q | The seismic intensity | |
| p, p ∈ Pa | Single upstream infrastructure system | |
| Kp, p ∈ Pa | The system performance of the infrastructure system | |
| Cs, s ∈ S | Given the cost of implementing resistance enhancement actions | |
| Ct, t ∈ T | Given the cost of implementing short-recovery enhancement actions | |
| C, s ∈ S t ∈ T | Given the cost of implementing resilience enhancement actions |
3.1 Model formulation
The decision variables Xs and Xt are binary variables indicating whether resistance actions and short-term recovery actions are taken. The objective function (1) maximizes the comprehensive effects of resistance actions and short-term recovery actions. The effects are achieved by taking resistance actions and short-term recovery actions , respectively. Constraint (2) is the budget constraint, in which the given cost under seismic funds does not exceed budget C. The different types of optimized infrastructure systems can allocate budgets according to the importance of nodes. Constraint (3) restricts the system performance by taking into account the functional degradation caused by upstream-related infrastructure. Kp indicates the maximum performance that the infrastructure system can provide, and p represents one upstream infrastructure system. For example, the number of people treated by the hospital system depends on the performance of the upstream system such as the power system and water supply system. Constraints (4) and (5) specify that at most one set of resistance actions and short-term recovery actions can be taken. Constraints (6) and (7) are binary variable constraints.
The effect functions of performance enhancement measurements include effect function and . The effect function of resistance actions reflects the fragility of the infrastructure system, which coordinates engineering and nonengineering resistance measures, such as reinforcement of structures, and maintenance of important instruments.14, 15 The performance of infrastructure systems usually declines under a certain intensity of earthquake disasters. For the resistance actions, NP drops to PP when the resistance optimization measures are not carried out, which is counted as the initial state and . As resistance actions move up to the maximum unit , PP gradually increases to NP. With the increase of the resistance action levels, the improvement effects gradually decrease. When approaching the limit state of NP, the boosting effect per unit measure level approaches zero. Therefore, the effect function can be represented by a convex polynomial form passing through the origin. However, the effect function of short-term recovery actions reflect the ability of infrastructure systems to respond to residents' demand changes. Short-term recovery actions show the characteristics of an emergency, such as the storage of important materials, and the set of backup instruments. Each additional unit of short-term recovery action level brings an additional unit of effect. The effect function can be represented by a linear function form.33
Constraint (12) sets the goal of optimization effect from PP to EP. Constraint (13) sets the goal for recovery actions from NP to EP. Vs is the resistance action effect function, Ls is the level of resistance actions such as the number, scale, and utility time of action s. When no measures are taken, Ls is regarded as 0, the effect function reaches the level of PP. When all effective measures are taken, the effect function reaches the level of NP. Vt is the short-term recovery action effect function, Lt is the level of short-term recovery action such as the number, scale, and utility time of action t. When no measures are taken, Lt is regarded as 0, When all effective measures are taken, the effect function reaches the level of EP.
3.2 Solution algorithm
This study applies the dynamic programming algorithm to solve this group knapsack problem.34 The emergency performance optimization problem aims at maximizing the value of the item within the size of the package, considering only one option can be selected for the same group. This emergency performance optimization aims at maximizing the effect of resilience action level under a series of constraints, with only one option can be selected for the same action.
To be specific, a series of items in the group knapsack problem corresponds to the resilience enhancement action level ls and lt in the optimization model. The items in the knapsack problem are divided into groups according to categories, and different actions of resilience enhancement measures are divided into resistance action s and short-term recovery action t in the optimization model. it should be noted that the items in each group in the knapsack problem conflict with each other, that is, only one item can be selected in the group. Corresponding to this, only one action level can be selected for each enhancement measure in the optimization model. For example, the action xi for reserve materials has three different resilience action level: reserving half of the current materials, reserving the current level of materials, and reserving twice the current materials. Each item in the knapsack problem has a certain size and value, which corresponds to the constraint and effect of the resilience enhancement measures action level in the optimization model.
The knapsack problem is a classic nondeterministic polynomial problem. The polynomial-time algorithm of the knapsack problem obtains an approximate solution under a certain accuracy. This study uses an approximate algorithm to adjust the accuracy of the approximate solution according to the accuracy parameter set by the infrastructure management department, that is, given the accuracy parameter , the algorithm can get an approximate solution in the range of .
where is the accuracy parameter set for the optimized infrastructure system, is the optimal effect of all the resilience enhancement actions, action level l is the number of all resilience actions , represents the value related to the precision parameter, is the effect of a resilience action level, and is the result of rounding down the value of each item.
4 CASE STUDY
To demonstrate the optimization model of the infrastructure system and to assess its applicability, the model is implemented in a hospital system located in Mianzhu City in China, as shown in Table 2. The hospital system in this case refers to a comprehensive infrastructure system with four hospitals in Mianzhu City. For this case, the optimization model is employed to simulate the impacts caused by the extreme earthquakes during the 2008 Sichuan Earthquake, and the results are used to test emergency performance enhancement strategies of the hospital system and derive the optimal actions. An expert interview was conducted in Mianzhu City in March 2018, and a total of 15 experts were invited to evaluate the hospital resilience enhancement measures and their effects. Experts who participated in the survey were the medical staff and managers of four hospitals in Mianzhu City, 14 were involved in the disaster emergency rescue, as shown in Table 3.
| Item | No. of hospitals | |||
|---|---|---|---|---|
| A | B | C | D | |
| Initial capacity (beds) | 500 | 180 | 171 | 72 |
| Maximum capacity (beds) | 695 | 300 | 206 | 100 |
| Number of staff | 1040 | 280 | 66 | 54 |
| Building | 3 | 2 | 1 | 1 |
| Reconstructed after the 2008 Sichuan Earthquake or not. | Not reconstructed | Reconstructed | Reconstructed | Reconstructed |
| Item | Position | Experienced the Wenchuan earthquake or not | Participated in emergency rescue or not |
|---|---|---|---|
| 1 | Director of Emergency Office | Yes | Yes |
| 2 | Director of emergency department | Yes | Yes |
| 3 | Director of Medical Department | Yes | Yes |
| 4 | Emergency department nurse | No | No |
| 5 | Emergency doctor | No | Yes |
| 6 | Director of emergency department | No | Yes |
| 7 | Associate dean | Yes | Yes |
| 8 | Director of emergency department | Yes | Yes |
| 9 | Director of Emergency Office | Yes | Yes |
| 10 | Director of Nursing | Yes | Yes |
| 11 | Director of Medical Department | Yes | Yes |
| 12 | Associate dean | Yes | Yes |
| 13 | Associate dean | Yes | Yes |
| 14 | Office manager | Yes | Yes |
| 15 | Dean | Yes | Yes |
The functionality variables (EP, NP, PP) are quantified to conduct numerical experiments on the hospital system. The hospital system belongs to the Type I infrastructure system (EP > NP > PP) as aforementioned. The system performance can be quantified as the number of patients treated or cured. For instance, normal performance is quantified as the number of patients received daily.
q represents the seismic intensity of an earthquake disaster, corresponding to the Modified Mercalli Intensity scale. For example, when the seismic intensity reaches 10 and above, the intensity scale reaches extremes of earth vibrations, which is represented by a q value of 10.
Note that and represent the emergency performance enhancement actions. For example, each action is mapped to the activities at different action levels , respectively corresponding to the current level, the halved level, and the doubled level through the way of expanding alternative measures. The levels of resistance actions and short-term recovery actions are listed in Table 4.
| Activity | Action | Action level |
|---|---|---|
| Resistance actions | Prepare the frequency of large-scale maintenance of equipment | |
| Improve the layout of departments and repair the structure | ||
| Improve equipment record and status registration system | ||
| Replace old significant equipment such as ECG machine | ||
| Replace shock-absorbing pads | ||
| Short-term recovery actions | Restore emergency supplies and damaged infrastructure | |
| Emergency rescue training and drills for personnel |
5 RESULTS AND ANALYSIS
A series of experiments are carried out with different Gaussian noise under the different budget C and seismic intensity q. Three scenarios are designed to illustrate the emergency performance optimization model. In each scenario, an independent optimization model is established and the optimal solution obtained is the combination of a series of emergency performance enhancement actions [. In three scenarios, the experiment analyzes the impact of budget C and seismic intensity q on the optimization of hospital system performance.
Scenario 1: Evaluating effects on performance optimization at different seismic intensity levels.
Scenario 1 simulates the optimization value of the hospital system performance at different resilient intensity levels within a sufficient budget. The available budget is assumed to be 3 million RMB for optimization actions of each hospital system. A total of 100 trials are conducted under each intensity under the Modified Mercalli Intensity scale. The seismic intensity increases from 1 to 10. The results in Scenario 1 are shown in Figure 3. The abscissa represents seismic intensity q, and the ordinate is the average optimal objective value of the emergency performance optimization model in 100 random trials. This shows that the effect of optimal resilience enhancement actions gradually decreases when the seismic intensity q increases. In addition, the magnitude of the reduction becomes flat with the increase of the seismic intensity q, which indicates that the seismic intensity q makes less impact on the optimization effect when it increases to a higher level. However, when the seismic intensity reaches q = 6, the optimal target value of hospital A drops rapidly from 3200 to 0. This is due to the high floor of buildings and the lack of seismic design.
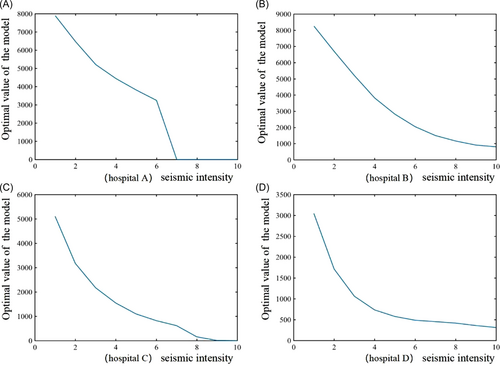
EP sets the baseline for optimization results. In Figure 3, when the optimal objective function value reaches 0, it shows that there is no solution to the optimization problem under the current disaster intensity. In other words, even the optimal resilience enhancement action cannot make up the gap between PP and EP. For example, when the intensity reaches q = 7, no matter what measures hospital A takes, it cannot meet the EP after the earthquake.
Scenario 2: Evaluating effects on performance optimization at different budget.
Scenario 2 simulates the optimization value of the hospital system performance at different budgets. The budget increases from 0 to 3 million RMB and 100 trials are conducted under each level of budget. The results in Scenario 2 are shown in Figure 4. The abscissa represents the different budgets, and the ordinate is the average optimal value of the emergency performance optimization model in the trials. When the budget increases, the effect of the optimal resilience measures under the intensity increases monotonously. The results indicate that the stage where the effect improves rapidly is the initial investment of the budget. In this stage, the optimization work shows more significant effects than in other stages. For example, when the budget of hospital C reaches 1.5 million RMB, the unit budget effect decreases after this inflection point of the first derivative is exceeded.
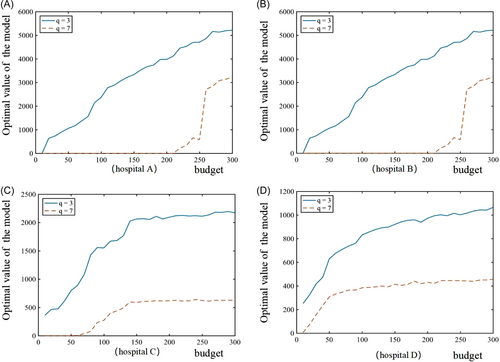
EP sets a baseline for optimization results. In Figure 4, when the optimal objective function value reaches 0, it shows that there is no solution to the optimization problem when not enough budget is invested. For example, when the budget investment is less than 2 million RMB, no matter what measures hospital A and hospital B takes, they cannot meet the expected number of treatments after the earthquake. This brings enlightenment to government managers. If there is no adequate budget for the corresponding intensity planning, the hospital system cannot achieve the EP of the residents.
Scenario 3: Evaluating priority of emergency performance enhancement action.
Scenario 3 simulates the priority of two types of emergency performance enhancement actions. This experiment set a sufficient budget to ensure that all alternative measures have a chance to be selected as the optimal solution. We assumed that each hospital has a budget of 3 million RMB. The priority of the emergency performance enhancement measures varies with different levels of seismic intensity, as is shown in Figure 5. The proportion of effects of resistant actions accounts for more than 50% in a series of optimal solutions such as hospital A and hospital C of , hospital B of and hospital D of . When seismic intensity increases than the value above, the proportion of effects of short-term recovery enhancement actions is dominant. The results show that different maximum points are in seismic intensity q = 3, seismic intensity q = 2, seismic intensity q = 2, and seismic intensity q = 1. It could be noticed that the resistance activities would be taking the leading role early under a relatively low seismic intensity. Thus, the hospital systems are supposed to take measures to increase the resistance actions first, and then increase the level of short-term recovery actions after the resistance effects reach a certain level.
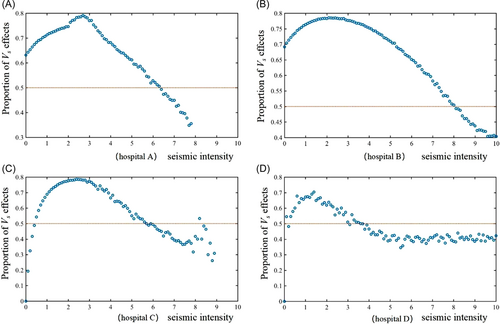
EP sets the baseline for optimization results. Under a relatively low seismic intensity, the number of people treated by the hospital system reaches a satisfactory state, mainly due to the improvement of the instantaneous decline in the emergency stage. Under a relatively high seismic intensity, meeting EP is mainly due to the improvement of the recovery actions. When seismic intensity reaches the higher-level q = 8 for hospital B or q = 9 for hospital C, no measures can make them reach a satisfactory state.
6 CONCLUSIONS AND FUTURE RESEARCH
This study proposed a seismic emergency performance optimization model for infrastructure systems under demand differences. Specifically, the model considered different seismic intensities, aiming at maximizing the effects of resilience enhancement measures to meet the expected performance of residents within the resource constraints. In addition, the model set the baseline for the optimization results by means of three functionality variables in earthquake scenarios. The group knapsack problem and the dynamic programming algorithm were applied to the solution of the mathematical formulation. Moreover, a case study was developed based on the realistic data of the hospital system in Mianzhu City during the 2008 Sichuan Earthquake. Three scenarios were designed to examine the impact of the seismic intensity, budget, and priority on the optimization results through experimental simulations. The results indicated that adequate budget allocation and the priority of appropriate resilience enhancement actions can serve as a tool for decision-makers to improve the emergency performance of infrastructure systems.
The study suggested that government decision-makers should consider the concept of resilience in the emergency management of infrastructure systems, including the system performance enhancement actions for self-resistance and recovery strategies. Government should pay attention to improving self-aid ability before the assistance of external resources. Furthermore, constructing the baseline for the optimization results was suggested to cope with the needs of residents under earthquake conditions. After establishing the emergency performance optimization model, decision-makers were supposed to determine the baseline for the optimization results to maximize the optimal allocation of resources.
The proposed approach bears several limitations that should be acknowledged. Future research should implement the developed emergency optimization model for other types of natural or man-made hazards, such as floods, and public health events, which may require more interdisciplinary knowledge in resilience and management. In addition, there can be additional cases for other types of infrastructure systems to explore seismic emergency optimization, such as the emergency performance improvement of the urban lifeline system. For a practical optimization model, consideration of the uncertainties of the external environment is suggested, such as changes in residents' needs and expected performance. Lastly, while the EP baseline of the optimization model has been demonstrated, how to develop a set of criteria that quantify the expected performance, requires more attention in future research.
We acknowledge the potential limitations of the proposed approach and opportunities for future work. First, some parameters in the proposed optimization model are set based on assumptions, and the appropriate value range under different earthquake intensities has not been explored. In addition, due to the very nature of different types of infrastructures, the specific characteristics of infrastructure have not yet been fully considered. This represents an opportunity to explore models in greater depth through future research. Future research should implement the developed emergency optimization model for other types of natural or man-made hazards, such as floods, and public health events, which may require more interdisciplinary knowledge in resilience and management. In addition, there can be additional cases for other types of infrastructure systems to explore seismic emergency optimization, such as the emergency performance improvement of the urban lifeline system. For a practical optimization model, consideration of the uncertainties of the external environment is suggested, such as changes in residents' needs and expected performance. Lastly, while the baseline of the optimization model has been demonstrated, how to develop a set of criteria to quantify the expected performance requires more attention in future research.
ACKNOWLEDGMENT
This material is based on work supported by the National Natural Science Foundation of China (NSFC) under Grant Nos. U1709212 and 71974106, the National Key Research and Development Program of China under Grant No. 2018YFC0809900, and the Beijing Natural Science Foundation (BJNSF) under Grant No. 8202027. Any opinions, findings, conclusions, or recommendations expressed in this paper are those of the authors and do not necessarily reflect the views of the funding agencies. The authors are thankful to the experts in Mianzhu for providing valuable advice on this study.
CONFLICTS OF INTEREST
The authors declare no conflicts of interest.


