Hazard considerations in the vulnerability assessment of offshore wind farms in seismic zones
Abstract
Offshore wind power is increasingly becoming a mainstream energy source, and efforts are underway toward their construction in seismic zones. An offshore wind farm consists of generation assets (turbines) and transmission assets (substations and cables). Wind turbines are dynamically sensitive systems due to the proximity of their resonant frequency to that of loads considered in their analyses. Such farms are considered lifeline systems and need to remain operational even after large earthquakes. This study aims to discuss hazard considerations involved in the resilience assessment of offshore wind farms in seismic regions. The complexity of design increases with larger turbines installed in deeper waters, resulting in different types of foundations. In addition, Tsunami inundation is shown to be an important consideration for nearshore turbines.
1 INTRODUCTION AND BACKGROUND
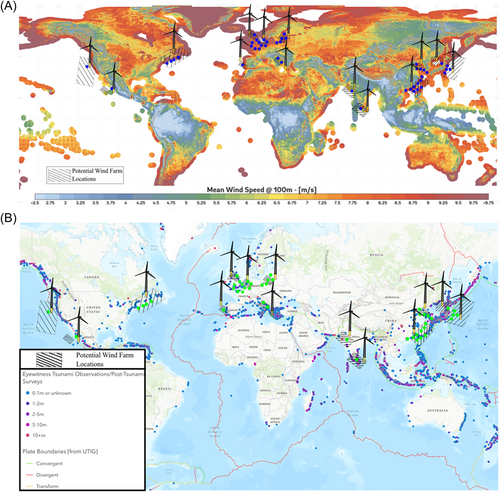
Within the built enviornment, offshore wind farms are considered lifeline systems and should remain operational even after large earthquakes. Investment towards such wind farms are rapidly increasing, facilitating their construction in regions of high seismicity. Figure 1A shows the investments in offshore wind farms overlaid on a wind speed map. Seismic hazards can be of various types, ranging from fault rupture to liquefaction to Tsunamis. Examples include fault rupture leading to subsidence/movement of the seabed affecting the foundations, seismic shaking leading to additional inertial loads on the turbine, liquefaction of the ground leading to the floatation of cables and changes in the dynamic characteristics of the structure, and additional loads on the tower and blades due to tsunami. Figure 1B shows global Tsunami hazards and potential offshore wind farm locations.
2 SEISMIC HAZARDS
There are two types of offshore wind turbine (OWT) systems: (a) a grounded system, where the turbine foundation is attached to the seabed, and (b) a floating system, where the anchor is attached to the seabed. The hazards induced from the earthquakes on OWTs require detailed investigation. In general, there are three types of categories in this field: (i) effect of significant fault movement, (ii) ground shaking, (iii) and liquefaction. Figure 2 collates the possible hazards for an offshore wind farm.
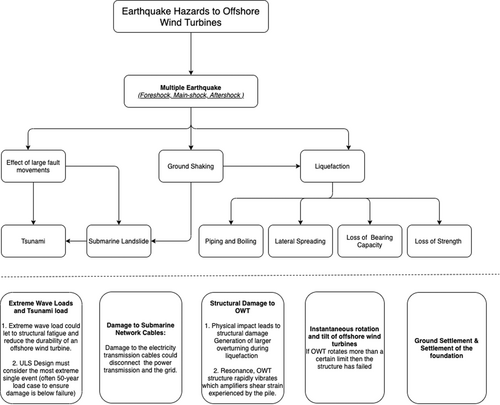
Due to the highlighted hazards, the scale of damage on the OWTs could be different. To illustrate, foundation type, structural stiffness, and degree of the hazards are some factors that could impact the scale of damage.4
There are two types of energy infrastructure assets: generation and transmission assets. While the turbines fall under generation assets in the sense that these produce power, the electric cables that transfer electricity from the turbines to the onshore grid represent transmission assets. Potential hazards related to large fault ruptures include anchor/mooring line failure in floating OWTs and electrical cable failure. There are two types of cables: (a) inter-array cables, which connect different turbines and links with the offshore substation; and (b) an export cable, which connects the offshore substation to the onshore grid, that is, exports power.
2.1 Fault rupture effects on floating wind turbines
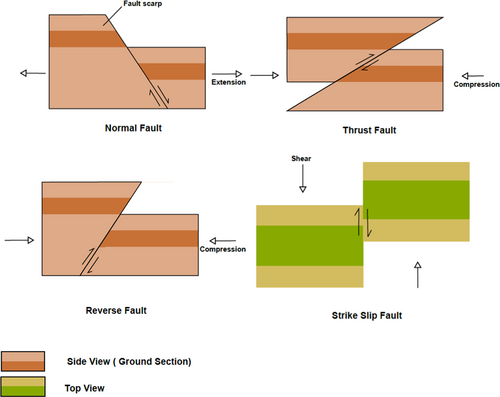
Deterministic hazard analysis is an approach to determining approximate fault displacement based on empirical relationships. Wells and Coppersmith5 is a well-known correlation for this method. The formulation depends on the magnitude of an earthquake event and the type of fault rupture (e.g., Strike-Slip, Reverse, Normal). These input parameters are surface rupture length, subsurface rupture length, downdip rupture width, rupture area, maximum displacement, and average displacement. Two methods are available to carry out seismic hazard assessments. The most straightforward and most economical is Deterministic Seismic Hazard Analysis (DSHA), and the other is Probabilistic Seismic Hazard Analysis (PSHA). The DSHA approach considers a specific earthquake scenario. However, the PSHA approach adds the probability to address the uncertainties in earthquake events. The main inputs studied in this approach are scale, location, distance from the epicentre for several events in the past.6 Therefore, DSHA is essentially a specific case of PSHA. Different types of fault ruptures are shown in Figure 3.
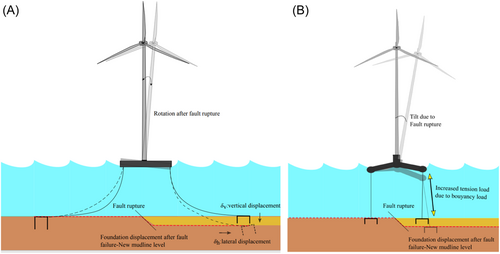
Fault rupture in floating foundations could cause rupture and destabilization of the structure. Figure 4 shows two main floating systems classified based on mooring lines. In one case, the mooring line is taut, which restricts the movement, and the system is known as TLP (tension leg platform). The mooring system that allows excursion, known as the catenary mooring system (See Figure 4A). The fault rupture between the supports could cause loosening of cables and a minor tilt in the tower system. However, in a pre-stressed mooring system, for example, TLP, any amount of fault rupture between the supports could lead to a considerable amount of tilt, as shown in Figure 4B. The tilt significance is proportional to the displacement at the fault rupture location or even due to the response of earthquake motion at the surface level.3, 8
2.2 Liquefaction and possible hazards
Due to the cyclic loading applied to the soil particle, the excess pore pressure will cause a reduction in the effective stress. This excess pore pressure loosens the contact between the soil particles, and as a result, a fluid-like behavior occurs in saturated soil, also known as liquefaction.9 An increase in the pore pressure results in effective stress reduction, and therefore, the stiffness of the soil also decreases. Therefore, this results in different types of failure mechanisms such as overall settlement, excessive rotation, and increased period of the system. Further details can be found in Amani et al.10 Lombardi and Bhattacharya11 and Bhattacharya et al.6, 12
2.3 Blade collision during a seismic event
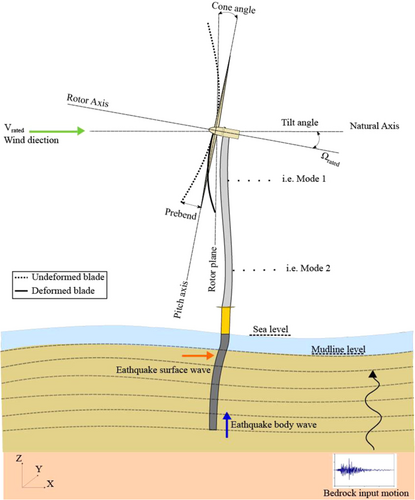
One of the other possible hazards during the cyclic loading event (particularly in the seismic event) is the crash of the blade with the tower. Improving the wind turbine's rated power requires a higher wind capture area and longer blades. Longer blades during the seismic events are more likely to cause higher deformation and, therefore, collision. Besides, the importance of other parameters such as the tower specification, RNA mass, tsunami loads, and unexpected ground accelerations is not negligible. This hazard is demonstrated schematically in Figure 5.
2.4 Electrical cables failure
Cable (inter-array and export) design of OWTs in seismic regions will need some extra considerations. A study conducted by KIS-ORCA13 concludes that seismic activities, landslides, and current abrasion in water depths exceeding 1000 m could be associated with cable failures. For water depths less than 200 m, cable failures mainly occur due to anchoring and fishing activities. Statistics revealed that 70% of cable failures are due to human-related activities (i.e., fishing and anchoring), and the remaining is due to natural calamities, that is, earthquakes. Therefore, it is highly likely that for the current installation depths (which is less than 200 m), the risk of cables failure due to only seismic effects (such as shaking, i.e., inertia) is low. However, since OWTs are relatively expensive assets, cable failure (array cables) could cut power. Therefore, no risk should be left unconsidered.
2.5 Discussion on potential hazards for some upcoming wind farm sites
- a.
Taiwan, China (floating and bottom fixed systems) is located between the Philippine Sea Plate and Eurasian Plate. Typical hazards in this region include (1) Slope failure, (2) Fluid seepage, (3) Earthquakes, (4) Volcanism, (5) Subsidence, (6) Bedforms, (7) Positive/Negative Reliefs, (8) Diapers, and (9) Faulting. Further details can be found in Ref. [14].
- b.
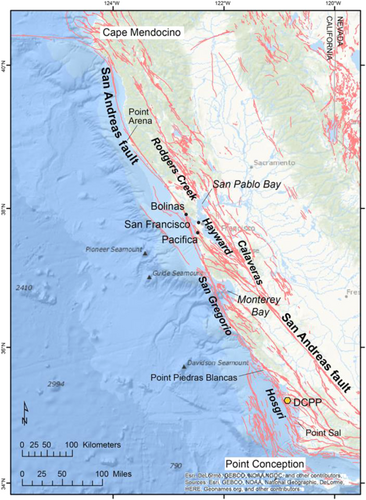
Pacific Coast, USA (floating systems) has several potential floating wind farms near the US Pacific Coast. This region could face several geohazards and, therefore, the design should include (1) the fault condition and its impact on electrical cables, (2) the soil condition at the sites and the effects of liquefaction, and (3) the impact of earthquakes on the mooring i.e. loads imposed on the mooring and cables. One of the main issues with the US coastline is the existence of active faults, and Figure 6 shows the primary faults in northern and central California.
3 LOADING SCENARIOS ON OWTS
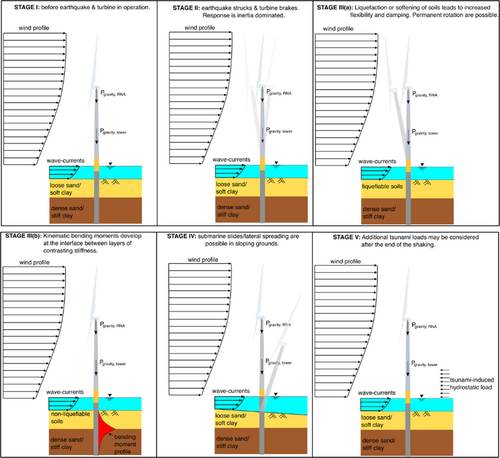
The main loads applied on the offshore foundations are Wind, Wave, 1P load, and 2P/3P load. However, the seismic design of OWTs demands different types of loading configurations. In addition to the typical loading conditions, these configurations include the loads induced from earthquake events (Shake, Tsunami) and accidental loads.6 Figure 7 shows the different loads in seismic regions and the loading scenarios and it shows the stages of loading. The loads can be divided into five stages, and readers are referred to Bhattacharya et al.16
-
Gravitational and Inertial loads: Consider static and dynamic loads induced from gravity, vibration, rotation, and seismic activity.
-
Aerodynamic loads: Consider static and dynamic loads induced from airflow and their interaction with the fixed and moving sections. The rotational speed of the rotor (e.g., 1P, 3P loads), the air density, and aerodynamic shape are the main factors in aerodynamic loads.
-
Hydrodynamic loads: Wave load is an example of a hydrodynamic load. The sea wave loads are typically in the form of a cyclic load applied along with the structure. However, for simplification, static loading could be considered in the form of a uniformly distributed load (UDL).
-
Actuation loads: The operation and control of wind turbines generate loading over the wind turbine structure. Examples are torque control, yaw and pitch actuator load, and breaking loads.
-
Earthquake loads: These loads are of two types: inertia and kinematic. Lateral force imposed on the superstructure generates inertia loads. Moreover, the lateral soil movement along the length of the pile generates a kinematic load.
-
Other loads: Load types include wake loads, impact loads, and ice loads.
-
Tsunami loads: Tsunami loads are loads induced by the elevation of seawater surface level. The seawater elevation due to tsunami depends on water depth. In deep waters, tsunami elevation (referred to as local Tsunami depth) is minor and may be non-detectable. When the tsunami arrives in shallow water, the tsunami elevation is amplified.19 Figure 8 shows the tsunami wave propagation in offshore and nearshore locations.
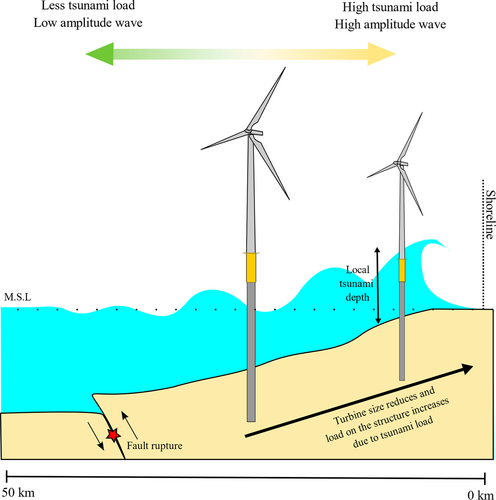
In general, there are three main parameters to define the magnitude and application of tsunami loads: (1) local Tsunami depth, (2) the tsunami flow velocity, and (3) the impact direction. Furthermore, these are dependent on (i) tsunami wave height, (ii) topography of the wave travel distance, and (iii) roughness of the coastal inland.20
Several codes of practices are available to estimate the tsunami load on the structures and are developed for onshore purposes. For example, the Japanese code of practice MLIT 257021 provides a static loading recommendation to design the tsunami load. This guideline applies the water depth coefficient based on the distance from the source to the static load configuration. The Japanese code of practice assumes a trapezoidal load distribution on the structure for the hydrostatic load.
In contrast, the US guidance recommends considering hydrodynamic forces for tsunami event design. This code of practice recommends the consideration of coefficient of drag, the momentum of flux, and the accumulated debris in the flow.21-23 It must be mentioned here that these are yet to be verified for OWT applications.
This section of the paper compares the loads based on different scenarios. Lateral load variation is plotted against the local tsunami depth, as shown in Figure 9. In this plot, Equations (1)–(4) were considered. This study compared three main loads: (i) hydrodynamic load, (ii) hydrostatic load for typical onshore applications, and (iii) impulsive loads. Hydrodynamic loads of OWTs were calculated based on the Japanese codes of practice MLIT 2570.21, 24 The hydrodynamic and impulsive loads were calculated based on the American guidance ASCE 7-1623—the results indicate the rise in the tsunami scale where the local tsunami depth increases. The value of hydrostatic load shows a higher magnitude than the hydrodynamic and impulsive loads and is unlikely to be experienced for farther offshore sides. This high value is due to a significant wave depth coefficient value (a = 3, no shelter between the incoming wave and the facility) that is assumed for the hydrostatic load.
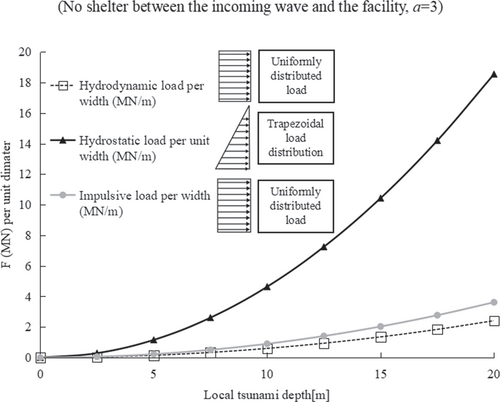
Readers are referred to Macabuag et al.4 for more information about tsunami load estimation.
4 METHODS OF ASSESSING THE OWT FOUNDATION IN SEISMIC ZONES
Several methods are presented in this section to illustrate the vulnerability assessment methods of OWTs in seismic regions.
4.1 Plotting the moment (MR) and lateral (HR) resisting capacity curve in liquefiable and non-liquefiable soil
Offshore wind farms are currently being constructed in potentially liquefiable soil. Moreover, young offshore deposits are particularly vulnerable to soil liquefaction during strong shaking. Soil liquefaction occurs in stages where the supporting ground behaves as a heavy fluid, resulting in lateral and vertical resistance loss. Further, upward artesian flow due to excess pore pressure generation can result in high buoyant forces, resulting in cable floatation if not accounted for in the design. Aleem et al.27 suggest a methodology to predict the load utilization ratio of monopiles supporting OWTs for non-liquefiable soils. This paper presents a method as an extension to adopt this method on liquefiable soils.
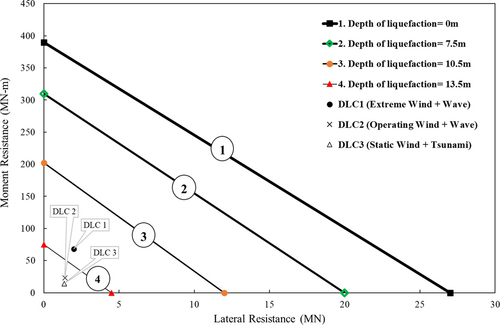
Figure 10 presents a simplified sketch to plot the capacity of the foundation in two stages: no liquefaction (pre-liquefaction) and maximum liquefaction (post-liquefaction). The plot also includes the design load cases. The effect of soil liquefaction is the loss of the foundation's lateral and moment-resisting capacity. Such a simplified approach estimates the capacity of pre- and post-liquefaction properties to aid preliminary sizing of offshore wind farm foundations. Once resistance (capacity) is estimated, a linear line presents the failure envelope under ULS condition for the conisdered foundation.
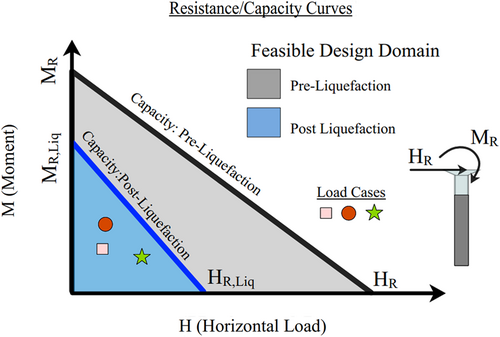
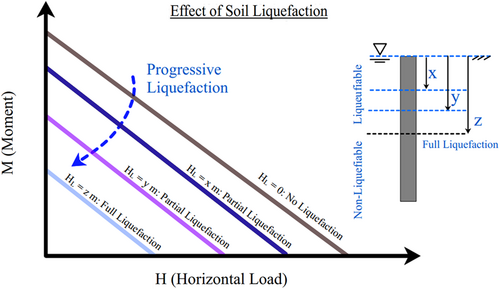
During earthquakes, soil deposits often liquefy top-down. The upper layers lose strength, and the liquefaction front progressively travels to deeper layers, as highlighted by Scott.28 Therefore, as shown in Figure 11, it is expected that with progressive liquefaction, the foundation capacity will reduce in stages.
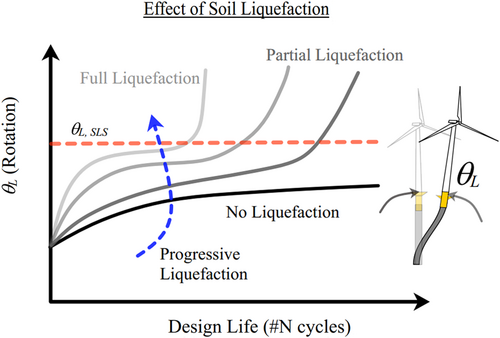
Therefore, considering the design life of the wind farm and tolerable risk, a probabilistic assessment can be performed for liquefaction triggering potential, thereby reducing the requirement for expensive ground remediation measures. An additional hazard due to loss of foundation capacity is the accumulated tilt of the system. As shown in Figure 12, pre-liquefaction, the ground offers sufficient resistance (capacity) to prevent excessive tilt of the superstructure. However, strong shaking can result in high inertial demands at the hub level, resulting in significant moments on the mudline. These demands can lead to tilting of the foundation, which can be exacerbated by soil liquefaction and additional long-term loading if not corrected.
Two methods could be used to conduct this assessment: (i) complete removal of the p–y springs in the liquefiable soil region and (ii) consideration of p–y springs for the liquefiable region. Several techniques currently exist in the literature to model the p–y curve for liquefied soil, including p multiplier reduced p–y curves,29 Cu-factor method,30 hybrid curves,31 and zero-strength p–y curves.32
Strain hardening p–y curves, as a new method, consider the effects of soil dilation during the liquefaction process as mentioned in Lombardi et al.33 or Dash et al.,34 also known as the hyperelastic model. Therefore, the selection of inappropriate p–y springs could lead to overestimation or underestimation in design based on the problem analyzed. A typical p–y spring for the liquefied soil using the p multiplier (8%), reduced API p–y, and a hyperelastic p–y curve is shown in Figure 13.
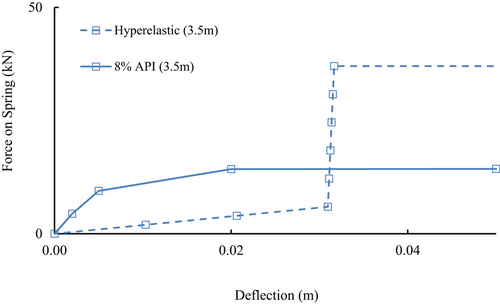
These p–y curves could be modeled as springs to carry out a soil-structure interaction analysis and assess the wind turbine structure performance in seismic regions.
4.2 Examples of the moment and lateral resisting capacity curve in liquefiable soil
A sandy soil profile is considered in this example. The moment and lateral resisting capacity values were estimated using the methodology presented in Aleem et al.27 For the estimation of the liquefied soil the p–y springs were removed to represent the loss of the soil strength in that regions. For an accurate representation of p–y springs the readers are referred to Lombardi et al.11 or Dash et al.34—the depth of liquefied soil presented by the removal of p–y springs. API35 p–y springs are used to represent the non-liquefiable depth. The results shown in Figure 14 show a nonlinear reduction for the moment and lateral resisting capacity.
5 PARAMETRIC STUDY ON THE STRUCTURAL PERFORMANCE OF OWTS
To assess the vulnerability and resilience of offshore wind farms, an offshore wind farm with a typical 2 MW in the region of Ibaraki, Japan, was considered. The turbines were fixed to bedrock using 3.5 m diameter monopiles, which extended 17 m below the seabed. More details on the dimensions and turbine properties are presented in Table 1. This parametric study considers the Tohoku earthquake (2011) with a 9.1 Mw scale.37, 38 The earthquake acceleration was estimated along the monopile surface using site response analysis. In this event, the soil was estimated to be liquefiable up to 4 m from the surface level.
| Turbine capacity | 2 MW |
| Hub height (m) | 60 |
| Pile length (m) | 17 |
| Top mass (tons) | 108 |
| Tower top and bottom diameter (m) | 1.5–4.3 |
| Diameter of the transition piece (m) | 3.8–4.35 |
| Tower thickness average (mm) | 15 |
| Pile thickness (mm) | 42 |
| Pile diameter (m) | 3.5 |
| Pile thickness (mm) | 42 |
| Tower thickness average (mm) | 15 |
| The thickness of the transition piece (mm) | 20 |
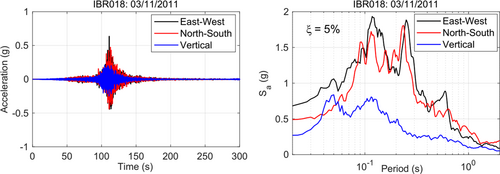
Figure 15 shows the recorded motion and corresponding 5% damped response spectra at the considered region (IBR018). During this event, the peak ground acceleration (PGA) was recorded to be 0.65 g at the ground surface. For the liquefiable and non-liquefiable layers, hyper-elastic33, 34 and API35 p–y curves were considered in this study.
5.1 Load scenarios
This study considers two prominent design load cases based on typical values. These loads consist of wind, wave, earthquake, and tsunami loads.
-
Wind: Extreme wind load applied on the tower-foundation system as a static point load on the top of the tower with a force of 985 kN.
-
Wave: 138 kN/m load applied as a UDL from the mudline level up to a height of 6.92 m. In this study, 4.5 m water depth with about 13 s of wave period was assumed.
-
Earthquake: Earthquake loads applied on the far ends of compatible p–y curves, using the free-field response of the ground obtained from the site response analysis.
-
Tsunami: The tsunami load estimated in Figure 9 is used in this study.
-
Load combination (1): Wind + Wave + Earthquake
-
Load combination (2): Wind + Earthquake + Tsunami
5.2 Parametric study
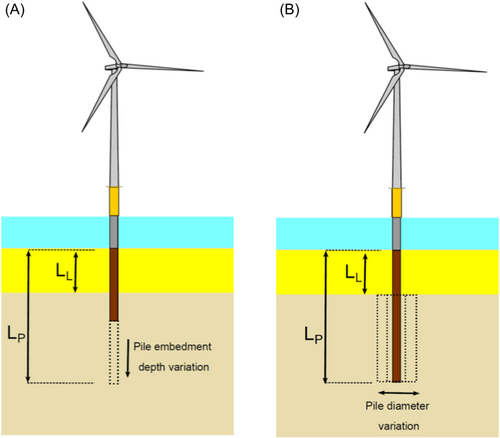
The parametric study often helps to determine the level of design optimization. The sensitivity of the original wind turbine is dependent on various parameters studied. The various parameters are the diameter of the pile and the length of the pile in liquefied soil deposit. In Study 1, the pile length (LP) varied versus the liquefied depth (LL). Furthermore, in Study 2, the diameter of monopile (DP) varied versus the liquefied depth (LL). Figure 16 shows a comparison between these two studies.
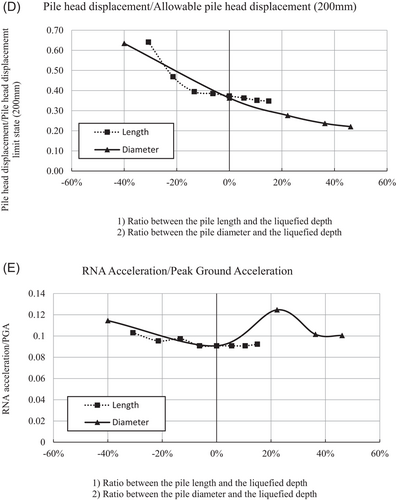
The analysis considered load combination (1) with a 1% damping ratio for the structural time history analysis. Then, as part of parametric Study 1, the length of the pile (LP) varied. Moreover, in Study 2, the diameter of the pile (DP) also varied. Figure 17 outlines the combined outputs from parametric Studies 1 and 2 against the liquefied depth of the considered soil.
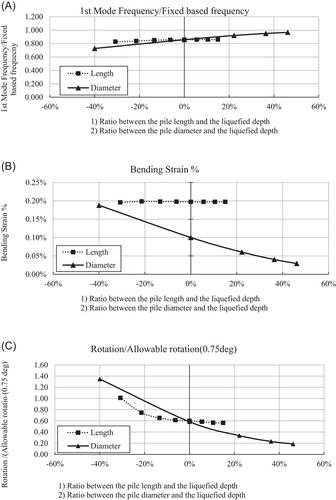
The fixed based frequency of the studied wind farm was estimated as 0.43 Hz. In this parametric study the 1st mode frequency (Natural frequency) of the tower-pile system was estimated. Figure 17A compares the ratio between the whole structures (foundation and tower) 1st mode frequency versus the tower fixed based frequency ratio. This demonstrates the structural stiffness, with respect to the dimensional variation. On increasing the length of the pile, the foundation frequency remained unchanged. However, increases or decreases in the pile diameter affected the pile frequency. Therefore, a change of the foundation length has a minor impact on the system frequency compared with a change in the foundation diameter.
Figure 17B shows the pile's bending strain (%) under varied dimensions. Length variation shows a minor impact on the bending strain value. The alteration of dimeters has the most impact on the structure's bending strain (%). Bending strain increases when the pile diameter reduces and reduces when the pile diameter increases.
Figure 17C,D shows the pile head displacement against the typical allowable pile head displacement (200 mm. 0.75 degrees). Therefore, this study shows that changes in the diameter and length could impact the foundation displacement and rotation.
Figure 17E shows RNA acceleration versus the considered PGA. In general, RNA acceleration is very low compared to the assigned PGA load to the system. This study shows that changes in both length and pile dimension could have a minor impact on the outcome of the results. The results indicated that RNA acceleration is 0.09 to 0.12 times the given PGA defined in this study.
In addition to Figure 17, Tables 2 and 3 show the detailed results.
| Normalized pile length change in comparison with the initial design and liquefied depth (%) | −31% | −21% | −13% | −6% | 0% | 6% | 11% | 15% |
| Depth liquefied/total pile length | 0.308 | 0.286 | 0.267 | 0.25 | 0.235 | 0.222 | 0.210 | 0.2 |
| Depth liquefied (m) | 4 | |||||||
| Pile length (m) | 13 | 14 | 15 | 16 | 17 | 18 | 19 | 20 |
| 1st mode natural frequency (Hz)/fixed based frequency of the tower (0.43 Hz) | 0.828 | 0.837 | 0.851 | 0.856 | 0.858 | 0.858 | 0.861 | 0.861 |
| Residual lateral displacement (mm)/limit displacement (200 mm) | 0.64 | 0.47 | 0.4 | 0.39 | 0.37 | 0.36 | 0.35 | 0.35 |
| Pile head tilt (°)/limit of rotation (0.75°) | 1.01 | 0.75 | 0.65 | 0.61 | 0.60 | 0.58 | 0.57 | 0.56 |
| RNA acceleration (g) (damping 1%)/PGA (g) | 0.103 | 0.095 | 0.097 | 0.091 | 0.091 | 0.0908 | 0.091 | 0.092 |
| Bending moment strain of the pile (%) | 0.2% | |||||||
- Abbreviation: PGA, peak ground acceleration.
| Normalized pile diameter change in comparison with the initial design and the liquefied depth (%) | −40% | 0% | 22% | 36% | 46% |
| Depth liquefied/diameter of pile | 1.60 | 1.14 | 0.89 | 0.73 | 0.62 |
| Liquefied depth (m) | 4 | ||||
| Diameter of monopile (m) | 2.5 | 3.5 | 4.5 | 5.5 | 6.5 |
| 1st mode natural frequency (Hz)/fixed based frequency of the tower (0.43 Hz) | 0.72744 | 0.8581 | 0.92093 | 0.95116 | 0.967 |
| Residual lateral displacement (mm)/limit of displacement (200 mm) | 0.63 | 0.36 | 0.28 | 0.24 | 0.22 |
| Pile head tilt (°)/limit of rotation (0.75°) | 1.35 | 0.58 | 0.34 | 0.23 | 0.19 |
| RNA acceleration (g) (damping 1%)/PGA (g) | 0.11446 | 0.09077 | 0.12462 | 0.10154 | 0.100 |
| Bending moment strain of the pile (%) | 0.19% | 0.10% | 0.06% | 0.04% | 0.03% |
- Abbreviation: PGA, peak ground acceleration.
In addition to the above analysis, the resilience of OWTs to Tsunami height run-up was assessed by varying the tsunami height and force in liquefied soil using load combination (2). The typical loads are assigned based on Figure 9, assuming a hydrostatic load scenario. The rise of tsunami load and height in this analysis showed a nonlinearity in the assessed parameters (e.g., pile head displacement, rotation, and the bending moment). Tsunami load was estimated based on Figure 9 for different local tsunami depths. The results are shown in Figure 18.
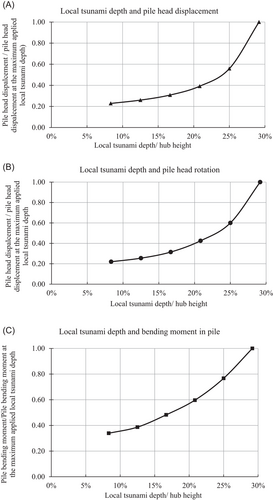
The output data of tsunami results shown in Figure 18 are presented in Table 4.
| Local tsunami depth (m) | 5 | 7.5 | 10 | 12.5 | 15 | 17.5 |
| Tsunami load (KN/m)-UDL (based on Figure 9) | 173.8 | 260.7 | 347.6 | 434.5 | 521.4 | 608.2 |
| Tsunami height/hub height-60 m (%) | 8 | 13 | 17 | 21 | 25 | 29 |
| Residual lateral displacement/maximum lateral displacement (at 17.5 m–368 mm) | 0.23 | 0.26 | 0.31 | 0.39 | 0.56 | 1.00 |
| Tilt/maximum tilt (at 17.5 m-2̊) | 0.22 | 0.26 | 0.32 | 0.43 | 0.60 | 1.00 |
| Max bending moment/max bending moment (at 17.5 m–240 MNm) | 0.34 | 0.39 | 0.48 | 0.60 | 0.77 | 1.00 |
- Abbreviation: UDL, uniformly distributed load.
6 A COMPARISON BETWEEN MONOPILE AND JACKET FOUNDATIONS
OWTs on jacket structures behave differently than monopile structures. Therefore, a comparative study between two types of foundations is carried out. One model represents a 9.5 MW wind turbine sitting on a monopile foundation with a 105 m hub height. Moreover, the other represents the same wind turbine capacity sitting on a Jacket foundation with a hub height of 157 m. Table 5 shows a summary of structural dimensions.
| Description | Monopile | Description | Jacket | Units |
|---|---|---|---|---|
| Turbine model | 9.5 MW | Turbine model | 9.5 MW | – |
| Hub height | 105 | Hub height | 157 | m |
| Pile length | 40 | Each pile length | 20 | m |
| RNA mass | 495 | RNA mass | 495 | tons |
| Tower top diameter | 4 | Tower diameter (thickness) | 4–8.8 (0.055) | m |
| Tower bottom diameter | 8.8 | Jacket leg diameter (thickness) | 1.5 (0.04) | m |
| Tower thickness average | 0.055 | Jacket bracing diameter (thickness) | 1 (0.03) | m |
| Pile diameter (Thickness) | 8 (0.09) | Pile diameter (thickness) | 1.5 (0.025) | m |
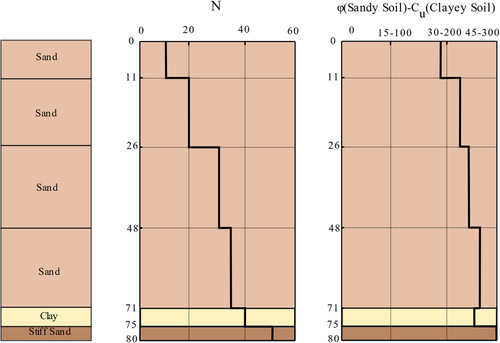
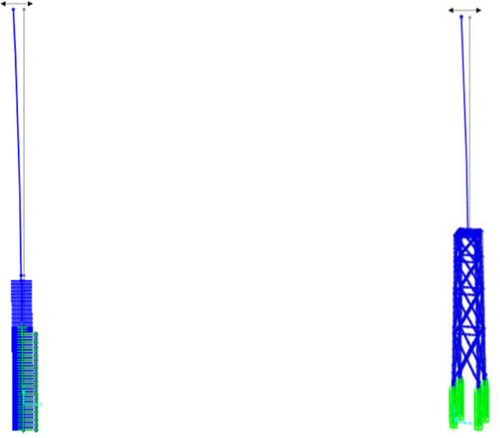
This study considered a typical soil profile from the Changbin wind farm in Taiwan, China with mainly sandy soil layers and a thin layer of clay. Figure 19 shows the soil profile of the Changbin wind farm.40 During this study, an effective stress ground response analysis was carried out using Cyclic 1D41 using the unscaled Takatori record (1995 Kobe earthquake) to obtain ground displacements imposed on appropriate p–y curves study the lateral response of the OWT-foundation system. For the liquefiable and non-liquefiable layers, hyper-elastic34, 42 and API35 p–y curves were considered in this study.
The results showed that the monopiles are less vulnerable to seismic motion than a Jacket foundation. Table 6 and Figure 20 show a summary of the results and an example of the deformed shape of the foundation, respectively.
| Monopile | Jacket | ||||
|---|---|---|---|---|---|
| Load cases | Residual lateral displ., δ (mm) | Pile head rotation, θ° | Residual lateral displ., δ (mm) | Pile head rotation (θ°) | |
| 1 | Wind + Wave (pre-liquefaction) | 57 | 0.29 | 28 | 0.20 |
| 2 | Wind + Wave + EQ (pre-liquefaction) | 120 | 0.57 | 32 | 0.28 |
| 3 | Wind + Wave + EQ (post-liquefaction) | 128 | 0.68 | 65 | 0.4 |
7 DISCUSSION AND CONCLUSIONS
Table 7 presents a summary of the main risks to different foundations in seismic regions.
| Foundation type | Engineering risk in seismic areas |
|---|---|
| Monopile |
|
| Jacket Foundation |
|
| Caissons |
|
| Floating System |
|
- Abbreviation: OWT, offshore wind turbine.
- 1.
OWTs are sensitive to tsunami loads. The local tsunami depth is proportional to the increase in tsunami loads applied over the structure. Therefore, OWTs could collapse as a result of large tsunami loads in conjunction with liquefaction related effects.
- 2.
RNA acceleration is typically between 9% and 12% of the PGA.
- 3.
The moment and lateral resisting capacity of the pile within the LU (Load Utilization) framework can be used to assess the performance of OWTs in liquefiable soil.
- 4.
Blade collision in seismic events with high PGAs is likely. Therefore, OWTs should consider blade effects for the seismic zones.
- 5.
Floating wind turbines with TLP systems are more vulnerable to fault ruptures than OWTFs with catenary systems. The authors recommend considering catenary mooring systems (e.g., semi-submersibles) for seismic regions.
- 6.
There is limited information on the tsunami load calculation offshore; therefore, this needs further verification.
CONFLICTS OF INTEREST
The authors declare no conflicts of interest.


