Switching CO2 Electroreduction Selectivity Between C1 and C2 Hydrocarbons on Cu Gas-Diffusion Electrodes
Abstract
Regulating the selectivity toward a target hydrocarbon product is still the focus of CO2 electroreduction. Here, we discover that the original surface Cu species in Cu gas-diffusion electrodes plays a more important role than the surface roughness, local pH, and facet in governing the selectivity toward C1 or C2 hydrocarbons. The selectivity toward C2H4 progressively increases, while CH4 decreases steadily upon lowering the Cu oxidation species fraction. At a relatively low electrodeposition voltage of 1.5 V, the Cu gas-diffusion electrode with the highest Cuδ+/Cu0 ratio favors the pathways of hydrogenation to form CH4 with maximum Faradaic efficiency of 65.4% and partial current density of 228 mA cm−2 at −0.83 V vs RHE. At 2.0 V, the Cu gas-diffusion electrode with the lowest Cuδ+/Cu0 ratio prefers C–C coupling to form C2+ products with Faradaic efficiency topping 80.1% at −0.75 V vs RHE, where the Faradaic efficiency of C2H4 accounts for 46.4% and the partial current density of C2H4 achieves 279 mA cm−2. This work demonstrates that the selectivity from CH4 to C2H4 is switchable by tuning surface Cu species composition of Cu gas-diffusion electrodes.
1 Introduction
Electrocatalytic CO2 reduction reaction (ECO2RR) into value-added hydrocarbon fuels and chemicals is a promising technology to recycle carbon, especially when it couples with renewable electricity.[1] Many efforts have been made at the catalyst level to achieve high-performance ECO2RR in recent years.[2-4] The significant issues of ECO2RR are still low selectivity toward a single target product, low energy efficiency, and short stability. Copper (Cu) is the only metal that steers ECO2RR to produce appreciable amounts of hydrocarbons (e.g., CH4 and C2H4) and oxygenates (e.g., C2H5OH).[5-7] However, Cu catalysts suffer from high overpotential and low selectivity with wide product distribution from C1 to C2+ products. The key intermediate of adsorbed can be either dimerized at the lower overpotential region or hydrogenated at higher overpotentials, leading to the pathways to the formation of C2H4 and CH4, respectively.[8]
Various studies showed that the activity and selectivity of the C1–C2 hydrocarbon products can be tuned by various strategies applied to Cu-based materials surface or interface between the catalyst and electrolyte, such as the control of surface roughness,[9-12] facet,[13, 14] local pH,[15, 16] oxidation state,[17-19] subsurface oxygen,[20] grain boundary,[21-23] and tandem catalysis.[24-27] Morphology-directed ECO2RR study revealed that the surface roughness of Cu foam catalysts regulates hydrocarbon products. The presence of surface active site and the temporal confining of gaseous intermediates inside the mesoporous played key role in the selectivity toward C2+ products.[11, 28] The variation in morphology of Cu catalysts often triggers the facet-dependent selectivity of ECO2RR.[14] Extensive theoretical and experimental studies revealed that the Cu (111) facet governs CO2 reduction pathways for CH4 generation, while the Cu (100) facet directs the C–C coupling step for C2+ products.[13, 29] The bulk electrolyte pH had been demonstrated to have direct influence on the CO2 reduction performance on Cu catalysts.[16] However, the local pH near the electrode surface often differs from the bulk electrolyte pH due to the dynamic formation of OH− by coupled H+/e− transfer and consumption of OH− by neutralization with CO2 in the electrolyte. The difference in roughness results in variation of local pH, which subsequently affects product selectivity on Cu catalysts.[30-32]
Besides, the surface composition of Cu catalyst also plays an essential role in controlling the selectivity and activity toward C2H4 or CH4.[33, 34] However, the authentic active site, namely Cu oxidation species (Cuδ+) vs metallic species (Cu0), is still under debate.[4, 18, 33, 35] For instance, in situ Raman spectroscopy revealed the surface composition of electrodeposited Cu2O films was rapidly reduced to metallic Cu0 during the ECO2RR.[36] These metallic Cu0 particles were proposed to be the active catalytic species for CO2 reduction toward C2H4 and C2H5OH. The recent study drew the same conclusion that the surface oxide layer on polycrystalline Cu was fully reduced to metallic Cu before the onset potential for CO2 reduction through in situ characterization of grazing incidence X-ray absorption spectroscopy (XAS) and X-ray diffraction (XRD).[37] The findings differed from the previous studies suggesting that Cu+ species was responsible for C2H4 formation.[38] Cu+ species was resistant to reduction and remained on the surface of oxide-derived copper during the ECO2RR as illustrated by operando XAS.[38] Additionally, the coexisting of Cu+ and Cu0 species on the Cu surface was reported to promote the formation of C2+ products synergistically; however, the role of single Cu+ or Cu0 species on the adsorption of intermediates remained controversial.[17, 35] The effects of structural morphology, surface oxidation state, local pH, and facet on Cu catalysts are always coupled, which imposes the difficulty to resolve the governing factor that determines the activity and selectivity toward C1–C2 hydrocarbons.
Herein, we report that the selectivity of ECO2RR on Cu gas-diffusion electrodes (GDEs) is switchable between C2+ products (mainly C2H4) and CH4 by regulating the surface composition of Cu species simply through electrodeposition voltages. The interrogation of physical characterization and electrocatalytic performance shows the governing factor that controls selectivity toward CO2 electroreduction is the surface composition of Cu species rather than the surface roughness, local pH, and Cu facet. Low-voltage electrodeposited Cu GDE with a high fraction of Cuδ+ (δ = 1 or 2) species prefers producing CH4 while high-voltage electrodeposited Cu GDE with a low proportion of Cuδ+ species favors C2+ products, including predominant C2H4. This finding provides insight into the long-standing issue: origin of selectivity diversity in Cu-based catalysts for CO2 electroreduction.
2 Results and Discussion
2.1 Synthesis and Characterization of Cu GDEs
The Cu GDEs (Cu-X GDEs, X denotes the deposition voltage) were prepared by the potentiostatic electrodeposition method, as illustrated in Figure 1a. During the synthesis process, Cu foam at the anode was first anodized to form Cu2+ ions, while the hydrogen evolution reaction (HER) occurred on the cathode of gas-diffusion layer (GDL, Sigracet 35 BC) (stage I). Most of Cu2+ ions were released to the KOH solution, followed by coordination with OH− ions to form [Cu(OH)4]2− complexes. The [Cu(OH)4]2− complexes diffused to the cathode where they were reduced and electrodeposited onto the GDL to form Cu GDEs (stage II and III). Due to the accumulating formation of Cu(OH)2 on the surface of Cu foam, the predominant reaction on the anode was switched from Cu anodization to oxygen evolution reaction (OER) on Cu(OH)2 (stage III). The corresponding time-dependent current density curves revealed these three stages (Figure 1b). Stage I only lasted for about 35 s under the different deposition voltages, indicating the same reactions occurred in stage I. The period of stage II became shorter as the electrodeposition voltage increased. That is because the formation rate of Cu(OH)2 layer was increased by increasing the electrodeposition voltage. At the transition from stage II to stage III, the current density abruptly decreased because the sluggish kinetics OER started to restrict the current density. The electrodeposition on the cathode continued at stage III. However, the electrodeposition rate would decline as the residual [Cu(OH)4]2− was gradually consumed. We propose the possible reaction mechanism of the electrodeposition process, as demonstrated in the following Equations 1-7:
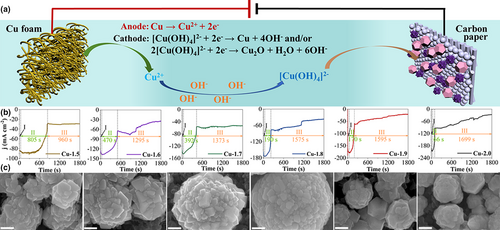
The real-time electrodeposition process at 1.5 V was captured by the photo images (Figure S1). The color of Cu foam changed from brick-red to dark green as the electrodeposition proceeded (Figure S2), illustrating that the generated Cu2+ ions nearby the Cu foam were turned into Cu(OH)2 which was coated onto the surface of Cu foam. We observed hydrogen gas bubbles resulting from HER on the cathode, while no oxygen gas bubbles emerged on the anode in the stages I and II of the electrodeposition process (Figure S2). However, after the formation of a thick Cu(OH)2 layer on the Cu foam as the electrodeposition elapsed beyond 900 s, a significant number of oxygen gas bubbles appeared due to OER on the anode. These results support the proposed three-stage mechanism of the electrodeposition process.
The electrodeposition voltage plays a significant role in regulating the morphology and bulk composition of the as-prepared Cu GDEs. The scan electron microscopy (SEM) images show that Cu GDEs possess distinct morphologies by varying the electrodeposition voltage (Figure 1c and Figure S3). Of note, the different electrodeposition voltage would cause the different electrodeposition time between stages II and III, especially for the stage II. The hydrogen bubbles generated in stage II from the hydrogen evolution reaction would affect the morphology structure and size of the as-prepared Cu GDEs. The Cu-1.5 GDE exhibited a nano-mulberry structure composed of some small tetrahedron nanoparticles. When increasing the voltage to 1.6 V, tetrahedron nanoparticles were also presented in nano-mulberry structure, but the size of the nano-mulberry became larger due to the decreasing amount of the released hydrogen bubbles on the cathode. The size of the nano-mulberry increased continuously as the voltage increased up to 1.8 V. However, the morphology of nanoparticles in nano-mulberry changed from tetrahedrons to cubes as the voltage increased to 1.7 V, and evolved into irregular spheres when the voltage rose to 1.8 V. When the voltage exceeded 1.8 V, the morphology of the Cu nanoparticles became quasi-polyhedral structure with a decreased size. The TEM images show a tetrahedron shape of the Cu-1.5 GDE (Figure 2a), a cube shape of Cu-1.7 (Figure 2b), and a quasi-polyhedral structure of Cu-2.0 (Figure 2c), which are consistent with the SEM results. The HRTEM image, combined with the corresponding fast Fourier transform (FFT) diffraction pattern in Figure 2d, reveals the Cu2O (111) plane with the lattice distance of 0.243 nm in Cu-1.5, and Figure 2e,f show the Cu (200) and Cu (111) planes with the lattice distance of 0.181 and 0.208 nm in Cu-1.7 and Cu-2.0, respectively.

The XRD results show that all the Cu GDEs present a dominant phase of metallic Cu0 with the diffraction peaks at 2θ = 43.3°, 50.4°, and 74.1° corresponding to (111), (200), and (220) plane, respectively (Figure 2g). The diffraction peaks of Cu2O phase are discernable for Cu-1.5 and Cu-1.6, indicating the coexistence of Cu and Cu2O phases in the Cu GDEs prepared by low electrodeposition voltages. The intensities are weakened with the increase in electrodeposition voltage, and Cu2O diffraction peaks even disappear at high electrodeposition voltages of 1.9 and 2.0 V. To further obtain structural information of Cu GDEs, the XAS was performed for Cu-1.5 and Cu-2.0 GDEs. The Cu K-edge XANES of Cu-1.5 and Cu-2.0 agree well with that for the Cu foil (Figure 2h). The corresponding EXAFS results show that the Cu-1.5 and Cu-2.0 GDEs have the same coordination structure as the Cu foil (Figure 2i). Thus, the XAS results confirm that metallic Cu0 prevails in both Cu-1.5 and Cu-2.0 GDEs.
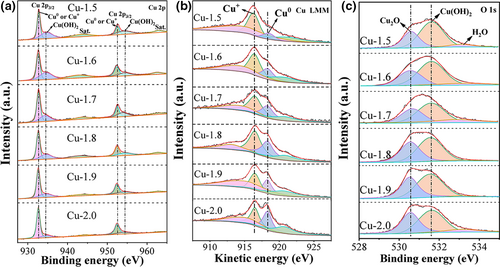
The electrodeposition voltage gradually regulates the Cu surface composition of the as-prepared Cu GDEs as well. The peaks of X-ray photoelectron spectroscopy (XPS) spectra for Cu 2p3/2 and Cu 2p1/2 can be deconvoluted into two subpeaks: a dominant subpeak at lower binding energy for Cu0/Cu+ and a secondary subpeak at higher binding energy for Cu2+ (Figure 3a). The formation of minor Cu2+ species is attributed to the oxidation of Cu0/Cu+ species, especially Cu+, in the alkaline solution. The ratio of Cu2+/(Cu++Cu0) (or the percent of Cu2+ species) progressively declines with the increase in the electrodeposition voltage. For example, the Cu2+/(Cu++Cu0) ratio decreases from 1.49 for Cu-1.5 GDE to 0.66 for Cu-2.0 GDE (Figure 3a and Table S1). The Cu LMM spectra distinguish Cu+ (kinetic energy of 916.4 eV) from Cu0 (kinetic energy of 918.2 eV) as shown in Figure 3b. The Cu LMM spectra show that the ratio of Cu+/Cu0 (or the fraction of Cu+) also decreases with the increase in electrodeposition voltage (Tables S1 and S2), corroborating the XRD results. Note that the ratio of Cu2+/Cu+ also decreases as the electrodeposition voltage rises, as derived from Cu 2p and Cu LMM spectra and confirmed by O 1s spectroscopy (Figure 3c and Table S1). Specifically, the content of Cu2+ is almost twofold of Cu+ for Cu-1.5 GDE and decreases to 1.33 times for Cu-2.0 GDE.
2.2 Electrocatalytic Performance for CO2 Reduction
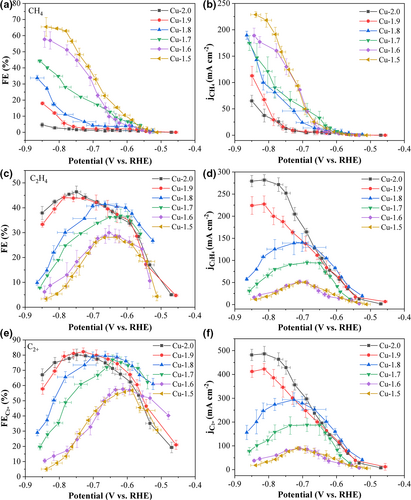
The electrochemical performance of the Cu GDEs for electrocatalytic CO2 reduction reaction (ECO2RR) was evaluated in a flow cell (Figure S4) operated under the potentiostatic mode. The selectivity toward C1 hydrocarbon and C2+ products, including C2H4 and C2H5OH, is switchable on electrodeposited Cu GDEs (Figure 4, Figures S5 and S6). Interestingly, the Cu-1.5 GDE achieved the highest selectivity of CH4 production among all GDEs, with the Faradaic efficiency (FE) of CH4 reaching 65.4% at a cathodic potential of −0.83 V (Figure 4a). In contrast, the FE of C2H4 was less than 3.5% at the same potential (Figure 4c). However, the selectivity was gradually shifted from CH4 to C2+ products as the electrodeposition voltage increased from 1.5 to 1.9 V. The FE for C2+ products achieved a maximum of 82.2% for the Cu-1.9 GDE at −0.73 V. Further increasing the electrodeposition voltage to 2.0 V, the top FE of total C2+ products slightly declined to 80.1% and that of C2H5OH decreased from 32.0% to 26.3% at −0.75 V (Figure 4e and Figure S5d). However, the FE of C2H4 kept increasing, which reached a maximum of 46.4% at −0.75 V (Figure 4c). Meanwhile, the CH4 selectivity was suppressed to 1.6% at −0.75 V for the Cu-2.0 GDE (Figure 4a). Accompanied with the shift of selectivity to C2+ products, the total current densities of ECO2RR for Cu GDEs monotonically increased as the electrodeposition voltage increased, surging from 350 mA cm−2 for the Cu-1.5 GDE to 750 mA cm−2 for the Cu-2.0 GDE at around −0.83 V (Figure S7). Corresponding to the selectivity shift, the partial current density of CH4 () decreased from Cu-1.5 to Cu-2.0 GDEs, whereas both partial current densities of C2H4 () and C2+ products () increased (Figure 4b,d,f). The Cu-1.5 GDE exhibited as high as 228 mA cm−2 and as low as 11 mA cm−2 at around −0.83 V. In comparison, the Cu-2.0 GDE achieved the maximum of 279 mA cm−2 and of 482 mA cm−2 at the identical potential.
2.3 Identification of the Origin of Catalytic Selectivity and Activity
The switchable electrocatalytic activity and selectivity toward CO2 electroreduction on these electrodeposited Cu GDEs are hypothesized to be resulted from the change of morphology and surface Cu species composition at different electrodeposition voltages. The effect of surface roughness or electrochemical active surface area (ECSA) in Cu GEDs with different morphologies was studied first. The ECSA, which reflects the number of accessible active sites in the Cu GDEs, can be estimated by measuring the double-layer capacitance (Cdl) of the electrode–electrolyte interface via the cyclic voltammetry method (Figures S8 and S9, Table S3). In general, the ECSA-normalized increases while ECSA-normalized decreases as the ECSA rises from Cu-1.5 GDE to Cu-2.0 GDE. However, the ratio of ECSA-normalized of Cu-2.0 GDE to Cu-1.5 GDE is only 7.9 at −0.83 V, which is much lower than that of geometric (23.9) (Figure S10). Conversely, the ratio of ECSA-normalized (13.5) of Cu-1.5 GDE to Cu-2.0 GDE is higher than that of geometric (5.8) at −0.83 V (Figure S10). These results demonstrate that the surface roughness itself cannot fully account for the switchable activity and selectivity toward CO2 electroreduction on these different Cu GEDs.
Next, we focused on the effect of surface roughness induced difference in local pH on the selectivity toward CH4 and C2+ products. The ECO2RR performance over Cu-1.5, Cu-1.7, and Cu-2.0 GDEs was first investigated and compared in electrolytes with different bulk pH values, including 1 m KHCO3, 1 m KOH, and 5 m KOH. For these three GDEs, the slightly decreased with the increase in bulk electrolyte pH while a reverse trend was observed for (Figure S11). Take Cu-1.5 GDEs as an example, the decreased 14% by changing the electrolyte from 1 m KHCO3 to 5 m KOH while the corresponding increased 24%. The results indicate that the low pH favors the ECO2RR toward CH4 while high pH promotes the formation of C2+ products, consistent with the previously reported works.[31, 32] However, there were no significant changes in selectivity of both CH4 and C2+ products among these three GDEs at the same electrolyte of either 1 m KHCO3 or 5 m KOH, suggesting that the bulk electrolyte pH has little influence on the reaction pathways between CH4 and C2+ products on the same GDE. The local pH near the Cu GDE surface differentiates from that in the bulk electrolyte due to the CO2–OH− neutralization reaction. The peak area ratio of can be used to estimate the local pH based on the Henderson–Hasselbach equation: pH = pKa + log(), where Ka is acid dissociation constant.[15] The local pH nearby the surface of GDEs can be calculated from the calibration curve by measuring in situ Raman spectra (Figures S12 and S13).[39] The local pH of all three GDEs slightly increased as the cathode potential was negatively swept (Figure S14), indicating the formation rate of OH− in CO2 reduction process was faster than its consumption rate by the neutralization reaction. Interestingly, these three GDEs displayed almost equivalent local pH values at each potential, indicating the similar local reaction environment during the ECO2RR. Taking the results of bulk pH effect and local pH measurement together, we conclude that the local pH variation is not the main factor that controls the selectivity between CH4 and C2+ products.
Afterward, we investigated the influence of Cu facet on the activity and selectivity toward CO2 electroreduction. The morphologies of Cu GDEs were well-maintained after ECO2RR, as shown in the SEM images (Figure S15). The HRTEM images reveal the distinguished lattice plane of Cu (111), Cu (200), and Cu (111) facets with distances of 0.208, 0.181, and 0.208 nm for Cu-1.5, Cu-1.7, and Cu-2.0, respectively (Figure S16). Of note, most of the oxide layer on Cu-1.5 was reduced to metallic Cu after ECO2RR, as evidenced by XRD and XAS results (Figures S17 and S18). The Cu-1.5 GDE with dominant exposed Cu (111) facet exhibited the main CH4 product. When Cu (200) facet was primarily exposed on Cu-1.7 GDE, the production rate and selectivity of C2H4 increased, accompanied by the decrease in CH4 product. However, the Cu-2.0 GDE with prevailing Cu (111) facet exhibited the highest selectivity toward C2H4 and C2+ products, indicating facet alone cannot be accountable for the difference in activity and selectivity.
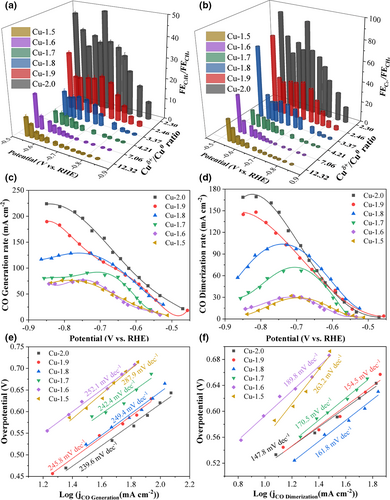
Finally, the dependence of the reactivity toward CO2 electroreduction on the surface composition was studied. The ratio of Cuδ+/Cu0 (Cuδ+ = Cu2+ + Cu+) declined from 12.32 for Cu-1.5 to 2.30 for Cu-2.0 (Table S1). The ratios of Cu+/Cu0 and Cu2+/Cu+ followed the same tendency. The Cu-1.5 GDE surface, preferring CH4 formation, was primarily constituted of Cu2++Cu+ species with a total percentage of 92.5% (Table S2). By contrast, Cu-2.0 GDE, achieving the highest production rate of C2H4, had 70.0% Cuδ+ species and 30.0% Cu0. This distinguishable result referred to the most important role of surface Cu species in selectivity toward ECO2RR. Of note, the ratio of Cuδ+/Cu0 in Cu GDEs decreased after ECO2RR (Figure S19, Tables S4 and S5), indicating that the Cuδ+ species can be reduced to Cu0 species during ECO2RR, which was consistent with our XRD and XAS results as well as previous results from operando analysis.[27] However, the content of Cu+ and Cu2+species in the Cu GDEs still followed the order of Cu-1.5 > Cu-1.7 > Cu-2.0 after ECO2RR. The surface Cu species composition under ECO2RR process cannot be accurately reflected by XPS due to the possible re-oxidation of Cu exposed in the air, which requires more advanced analysis techniques in the future work. Nevertheless, our result shows that both and ratios are inversely proportional to Cuδ+/Cu0 ratio for the pristine Cu samples (Figure 5a,b). The Cu-2.0 GDE with the lowest Cuδ+/Cu0 ratio (Cu+/Cu0 ratio of 0.99) achieved the highest and ratios among the six GDEs. The maximum and reached 48.6 and 89.5, respectively, for Cu-2.0 GDE at −0.66 V. These results suggest that the high Cuδ+/Cu0 ratio (Cu+/Cu0 ratio of 2.54) on the Cu surface favors the C1 hydrocarbon formation, while the low Cuδ+/Cu0 ratio (Cu+/Cu0 ratio of 0.99) facilitates the C–C coupling for C2+ products. This trend is consistent with the prior findings that demonstrated the oxide-derived Cu surface composed of Cu0 and Cu+ with equal amount enhances the selectivity toward C2+ products.[40] Combining all the above results, we may safely reach a conclusion that the selectivity toward CO2 reduction is principally governed by the Cuδ+/Cu0 ratio over the surface roughness, local pH, and facet in different Cu GDEs.
2.4 Mechanism of CO2 Reduction Reaction
Several previous studies proposed that is the key intermediate for CO2 conversion.[21, 41-43] CH4 pathway is proceeded by hydrogenation of to intermediate, while the pathway toward C2+ products mainly lies in CO dimerization (C–C coupling) step, especially at the low overpotential region.[21, 44] We posited that such different selectivity of CH4 and C2+ products on our Cu GDEs is attributed to the difference in surface coverage. We analyzed the CO generation rate and dimerization rate over six Cu GDEs aforementioned to unravel the underlying reaction mechanism toward CO2 conversion. The CO generation rate is the sum of the production rates of C2+, CH4, and CO products normalized by the electrons transferred per mole of product assuming CO is the reactant. The CO dimerization rate is referred to normalized production rates of C2+ products (See detailed calculation in Supporting Information). The CO generation rate increases in the order from Cu-1.5 to Cu-2.0 GDEs (Figure 5c), indicating that the coverage of on the electrode is greatly enhanced from Cu-1.5 to Cu-2.0 GDEs, especially at more negative potentials (<−0.75 V). Generally, the high surface coverage promotes the C–C coupling reaction kinetics on the Cu surface, while the low surface coverage favors the hydrogenation of to , the critical step to CH4 formation.[16, 45-47] Accordingly, an analogous increasing trend of CO dimerization rate can be observed from Cu-1.5 to Cu-2.0 GDEs (Figure 5d). These results validate that the Cu-2.0 GDE generates sufficient CO to increase the surface coverage, leading to the acceleration of CO-to-C2+ products conversion. To further study the reaction kinetics in terms of CO intermediate reactant, the Tafel plots of CO generation and dimerization were analyzed (Figure 5e,f). The Cu-2.0 GDE displays the smallest Tafel slopes of both CO generation and CO dimerization reactions, illustrating the fastest production rate of C2+ products.
In situ Raman spectroscopy was performed in a flow cell to further investigate the adsorption property of reaction intermediates during ECO2RR (Figure 6a–c). Two weak Raman signals of at 735 and 1556 cm−1 could be observed in Cu-1.5 GDE at potentials larger than −0.3 V and then the signals disappeared at more negative potentials. The Raman signals of peaks increased for Cu-1.7 GDE and were further enhanced for Cu-2.0 GDE. The higher intensity of peaks reflected a strong adsorption of intermediate on the surface of Cu-2.0 GDE, indicating more stabilized intermediate on Cu-2.0 GDE. The radical anion is regarded as the first reaction intermediate for ECO2RR, which can be further reduced to form the second key intermediate of for hydrocarbons.[48] Therefore, the strong adsorption/stabilization of intermediate promotes the conversion of CO2 to intermediate.[48, 49] A similar peak intensity tendency of intermediate adsorption behavior could be revealed among Cu-1.5, Cu-1.7, and Cu-2.0 GDEs. The Cu-2.0 GDE showed the strongest Raman peaks corresponding to at 301, 398, and 2060 cm−1, which are assigned to the Cu–CO frustrated rotation, Cu–CO stretch, and C≡O stretch, respectively.[50, 51] This result demonstrates that the Cu-2.0 GDE provides abundant active sites for efficient conversion of to intermediate, leading to high surface coverage on Cu-2.0 GDE, which agrees well with the calculation results of CO generation rate above.
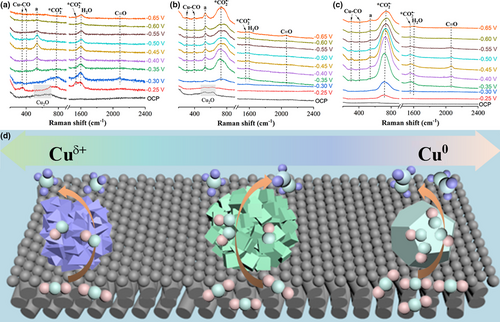
Previous studies implied that the surface components of Cuδ+ and Cu0 in Cu-based catalysts governed product selectivity by tailoring the adsorption of intermediates.[52, 53] Our in situ Raman results also suggest that Cuδ+/Cu0 ratio might play an essential role in tuning adsorption. As shown in Figure 6a–c, the peak at 536 cm−1 appears, which is assigned to the CuOx/(OH)y species.[54] Cu-1.5 and Cu-1.7 GDEs displayed high peak intensity of CuOx/(OH)y, while Cu-2.0 GDE showed a relatively low peak intensity, suggesting the higher content of Cuδ+ species can be remained in Cu-1.5 and Cu-1.7 GDEs. Moreover, to probe the stability of the surface Cuδ+ species in the Cu GDEs during CO2 reduction, we further investigate the in situ Raman spectra of Cu-1.5 and Cu-2.0 GDEs under continuous CO2 reduction at −0.45 V for 140 min, as shown in Figure S20. Both Cu-1.5 and Cu-2.0 GDEs exhibit a peak of CuOx/(OH)y species in the long-term test, demonstrating the stability of surface Cuδ+ species during CO2 reduction. Although the in situ Raman test cannot precisely quantify the amount of Cuδ+ species in the Cu GDEs, it can be well reflected the dynamic change of Cu species during CO2 reduction. The possible reaction mechanism of the formation of CH4 and C2H4 on Cu surfaces was proposed and depicted in Figure 6d. In the case of Cu-1.5 GDE with dominant Cu+, the low surface coverage results in a high energy barrier for C–C coupling that suppresses C2+ generation while leading to hydrogenation step for CH4 production. When the Cu0 species fraction increases in the Cu GDE as the electrodeposition voltage increases, more intermediate emerges on the Cu surface, especially at more negative overpotentials. The nearly equal content of Cu+ and Cu0 in Cu-2.0 GDE will generate abundant amount of intermediate, providing high surface coverage, which assists in dimerizing CO to form C2+ products.[17, 35]
3 Conclusion
In summary, we regulated the morphology and surface Cu species composition of Cu GDEs by simply changing the electrodeposition voltage. The selectivity of CO2 electroreduction is switched from CH4 to C2+ products upon lowering the fraction of Cu oxidation species. The Cu-1.5 GDE with the highest Cuδ+/Cu0 ratio favors hydrogenation pathways to form CH4. When lowering the Cuδ+/Cu0 ratio to the medium value, the Cu-1.7 GDE generates both C2H4 and CH4 in an appreciable selectivity. In contrast, the Cu-2.0 GDE with the lowest Cuδ+/Cu0 ratio prefers dimerization to form C2+ products. The highest FE of CH4 for Cu-1.5 GDE reaches 65.4% at −0.83 V, at which the partial current density achieves 228 mA cm−2. Compared to Cu-1.5, the FE of CH4 for the Cu-2.0 GDE is minimized to 1.6% at −0.75 V, while the FE of C2H4 tops 46.4% with a partial current density of 279 mA cm−2 at this potential. This work reveals the strong dependence of reactivity toward CO2 reduction on original surface Cu species composition rather than surface roughness, local pH, and Cu facet. Future work should focus on the unraveling of the underlying effect of Cu species evolution during the reaction process on the switchable selectivity from CH4 to C2H4.
4 Experimental Section
Synthesis of samples
The Cu GDEs were prepared by the potentiostatic electrodeposition. In a two-electrode cell, pure Cu foam and GDL with each size of 2 × 2 cm2 were worked as anode and cathode, respectively. The GDL (purchased from SGL Sigracet 35 BC) was composed of microporous carbon layer with 5% PTFE treatment and carbon fiber paper support. The distance between the anode and cathode was set to 2 cm. The aqueous solution of 3.0 m KOH was used as the electrolyte. The electrodeposition was carried on a Gamry electrochemical workstation (Gamry Interface 1010E) using a chronoamperometry mode with a duration of 0.5 h. The electrodeposition time of 0.5 h is chosen based on the theoretical calculation of the charges obtained from the time-dependent current density curves (See detailed calculation in Supporting Information). Six Cu GDEs were synthesized with different electrodeposition voltages of 1.5, 1.6, 1.7, 1.8, 1.9, and 2.0 V, which are denoted as Cu-1.5, Cu-1.6, Cu-1.7, Cu-1.8, Cu-1.9, and Cu-2.0, respectively.
Materials characterization
The morphology of the as-prepared Cu GDEs was imaged by a SU8020 field emission scan electron microscopy (FESEM). The crystalline structure was identified by XRD (Rigaku D/MAX2500VL). The lattice structure was analyzed by a JEM-2100F field emission transmission electron microscope (TEM). The Cu samples’ surface chemical composition was determined by X-ray photoelectron spectroscopy (XPS, ESCALAB250Xi). The bulk composition was measured by XAS at National Synchrotron Light Source II at Brookhaven National Laboratory.
Electrochemical measurement
The electrochemical measurements were performed on a Gamry electrochemical workstation. A flow cell equipped with cathodic and anodic compartments separated by an anion exchange membrane (Fumasep FAA-3-PK-75) was used as a reactor. The as-prepared Cu GDEs were directly used as a cathode with an active reaction area of 1 × 1 cm2. A Ni foam of an area 2 × 2 cm2 pressed onto a GDL was used as an anode. The electrolyte of 1.0 m KOH was pumped to the two compartments with a flow rate of 0.5 mL min−1. High-purity CO2 gas was purged into the cathode with a flow rate of 15.0 sccm. A constant cell voltage was applied to the flow cell during CO2 electrolysis. A Ag/AgCl (saturated KCl) electrode was linked to the cathode to measure the electrode potential. The solution resistance (Rs) was determined by potentiostatic electrochemical impedance spectroscopy (EIS) measurement under an open circuit potential at frequencies ranging from 0.1 Hz to 100 kHz. All potentials were converted to a reversible hydrogen electrode (RHE) scale with manual iRs compensation: ERHE = EAg/AgCl + 0.059 × pH + 0.197 − iRs. Before the electrocatalytic test, the cathode was pretreated by cyclic voltammetry from −0.5 to −1.0 V vs RHE for three cycles. The double-layer capacitance of each electrode was estimated from the cyclic voltammetric curves with different scan rates. The electrochemical active surface area (ECSA) of the electrodes was calculated based on the double-layer capacitance of each electrode.
Products determination
The gaseous products, including H2, CO, CH4, and C2H4, were detected by online gas chromatography (GC 5890; Agilent) equipped with a thermal conductivity detector (TCD) and a flame ionization detector (FID). High-purity helium (He) gases were used as the carrier gas. The outlet gas stream was injected into GC after an electrocatalytic test for 3 min at each potential. The liquid products were quantified by 1H NMR (Bruker AV 400 MHz spectrometer). To prepare the NMR samples, 500 µL of the collected electrolyte was mixed with 100 µL D2O solution consisting of 5 mm of 3-(trimethylsilyl)propionic-2,2,3,3-d4 acid sodium salt (TSP).
Acknowledgements
This work was partially financially supported by NSF CBET-2033343. J.Z. thanks the support from National Natural Science Foundation of China (52172293, 51772072, and 51672065) and the Fundamental Research Funds for the Central Universities (JZ2021HGQB0282 and PA2021GDSK0088). Y. Wang and Y. Wu also would like to acknowledge the financial support from the Key R&D Projects of Anhui Province (202104b11020016) and the 111 Project (B18018). This research used resources of the National Synchrotron Light Source II, a U.S. Department of Energy (DOE) Office of Science User Facility operated for the DOE Office of Science by Brookhaven National Laboratory under Contract No. DE-SC0012704. We acknowledge the use of facilities within the Eyring Materials Center at Arizona State University supported in part by NNCI-ECCS-1542160.
Conflict of Interest
The authors declare no conflict of interest.


