Process-based proxy of oxygen stress surpasses indirect ones in predicting vegetation characteristics
ABSTRACT
Robust relationships among soil, water, atmosphere and plants are needed to reliably forecast the plant species composition. In this paper, we show the need for, and the application of, a process-based relationship between soil moisture conditions and vegetation characteristics. We considered 366 groundwater-dependent sites, where oxygen stress, caused by a surplus of soil moisture, codetermines plant performance. We compared two existing indirect proxies for the soil oxygen status – namely mean spring groundwater level (MSL) and sum exceedence value (SEV) – with our newly developed process-based proxy, viz. root respiration stress (RS). The two indirect proxies and the process-based proxy for oxygen stress performed equally well in describing vegetation characteristics for the Netherlands under the current climate. However, relationships based on MSL and SEV appeared to produce systematic prediction errors when applied outside their calibration range, in contrast to the relationship based on RS. Hence, the two indirect proxies cannot be used in projections, such as in predicting effects of climate change on vegetation composition, all the more because they – unlike RS – do not account for essential parameters that determine oxygen stress (e.g. temperature and extreme rainfall events in the growing season). We advocate using RS for estimating vegetation impacts in climate projections to increase the reliability and effectiveness of adaptive strategies. Copyright © 2011 John Wiley & Sons, Ltd.
Abbreviations
-
- MSL
-
- mean spring groundwater level
-
- SEV
-
- sum exceedence value
-
- RS
-
- root respiration stress
INTRODUCTION
Currently, much attention is being paid to our ability, or rather inability, to predict the probability of occurrence of species groups and vegetation types (e.g. Guisan and Thuiller, 2005; Botkin et al., 2007). In order to obtain robust predictions, it is important, besides improving methods to describe ecological processes such as seed dispersion and competition between species for light and nutrients, to obtain reliable relationships between habitat characteristics and vegetation characteristics (Guisan and Zimmermann, 2000). Current habitat distribution models describe the habitat of plant species by statistically derived (e.g. by generalized regression, environmental envelopes or Bayesian modelling) response curves of a set of environmental variables (e.g. Guisan and Zimmermann, 2000; Bakkenes et al., 2002; Thomas et al., 2004; Guisan and Thuiller, 2005; Botkin et al., 2007). Various explanatory environmental variables have been proposed (Palo et al., 2005), ranging from elevation, slope and geology (e.g. Davis and Goetz, 1990; Ostendorf and Reynolds, 1998), to soil moisture content (e.g. Sykes et al., 2001) and air temperature (e.g. Ashcroft, 2006). However, the ecological relevance of these explanatory environmental variables is often indirect and overly simplified (Botkin et al., 2007). This implies that relationships between these variables and the vegetation do not allow for extrapolations (Guisan and Zimmermann, 2000).
To predict the impacts of environmental conditions in a reliable manner, process-based relationships between environmental conditions and species groups are a prerequisite because they, in contrast to indirect relationships, do not have to be recalibrated for future periods or other regions. It is therefore surprising that the habitat distribution models that have been used to forecast the effects of climate change usually make use of indirect relationships (Suding et al., 2008). Process-based relationships are especially necessary for forecasting ecological effects under environmental conditions that differ strongly from those under which these relationships were derived (Guisan and Zimmermann, 2000). The development of process-based relationships, with physiologically meaningful explanatory variables (Franklin, 1995; Guisan and Zimmermann, 2000), has been identified as one of the main objectives in ecological modelling (Guisan and Zimmermann, 2000). However, as far as we know, it has never been shown that process-based relationships actually lead to vegetation predictions that are different from those with indirect relationships.
In this paper, we investigate relationships between soil moisture (a habitat characteristic) and vegetation characteristics using explanatory variables with different levels of directness. Together with soil acidity and soil nutrient availability, the soil moisture regime is one of the most important factors in species selection (Ellenberg, 1992; Silvertown et al., 1999; Witte et al., 2007). Soil moisture affects plant performance both when it is deficient (drought stress) and when it is superfluous (oxygen stress). The mechanisms through which these stresses act are highly different. Drought stress limits the photosynthetic activity of plants (Tezara et al., 1999), whereas oxygen stress limits the metabolic activity of plants by decreased root respiration (De Willigen and Van Noordwijk, 1984; Amthor, 2000; Bartholomeus et al., 2008b). In this study, we focus on plant communities from groundwater-dependent sites, where the soil oxygen status is a primary determinant of plant performance.
Proxies for oxygen stress have been derived from measured groundwater levels in terms of, for example, mean groundwater levels (Runhaar et al., 1997; Ertsen et al., 1998; Schaffers and Sýkora, 2000; Dwire et al., 2004; Leyer, 2005) or the period and degree that the groundwater level exceeds a certain threshold value (Gowing et al., 1998; Silvertown et al., 1999; Barber et al., 2004). However, the groundwater level has only an indirect effect on the soil moisture content and thus on the oxygen availability in the root zone, namely by capillary effects (which depends on soil texture). Effects of other variables that determine oxygen stress (e.g. precipitation, potential evapotranspiration, soil temperature, plant characteristics) are not accounted for by groundwater levels. Experiments by Thompson and Fick (1981) and Tsukahara and Kozlowski (1986), for example, demonstrated an increased plant root stress under the coincidence of low aeration and high temperature. The combined effect of a shallow groundwater level and a high temperature reduced considerably the root dry weight (Thompson and Fick, 1981) and the root growth rate (Tsukahara and Kozlowski, 1986) compared with the reductions for a shallow groundwater level and a low temperature. The combined effect of a low aeration and a high temperature is expected to occur more frequently in a future climate (Van den Hurk et al., 2006; Solomon et al., 2007). Groundwater levels, however, will not reflect this increased root stress.
In this paper, we introduce a process-based proxy of oxygen stress on the basis of plant physiological and soil physical processes (accounting for both oxygen demand of and oxygen supply to plant roots) and its relationship with vegetation characteristics. We fit our process-based proxy of oxygen stress, as well as two existing (indirect) proxies, against the vegetation characteristics of vegetation plots in the Netherlands. The three relationships obtained are then applied to the Flemish region in Belgium to validate process-based and indirect relationships, illustrating their applicability outside their calibration range. Finally, we compare the forecasted change in vegetation characteristics for all relationships under four climate scenarios.
METHODS
General approach
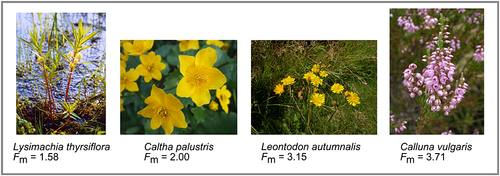
We compiled a database with site information on species composition, groundwater level and soil type from a large number of sites in the Netherlands. For each site, we computed the mean indicator value of the vegetation for moisture regime, Fm [–] (Witte et al., 2007), considered as the response variable of the vegetation to the soil oxygen status (Figure 1). This variable was regressed against three different proxies of oxygen stress, described in the succeeding discussions.
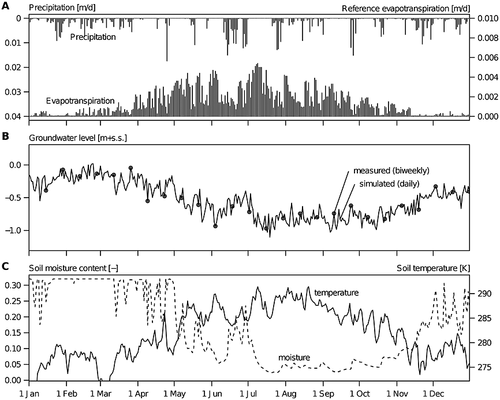
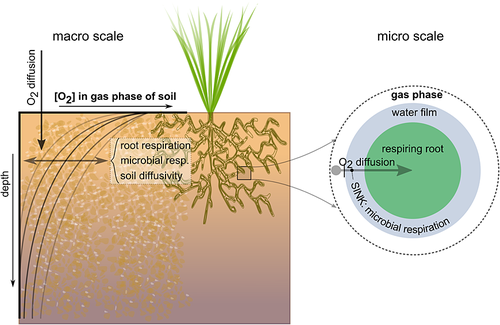
Daily groundwater levels were interpolated (Figure 2: A; Figure 3) from biweekly measurements. From these groundwater levels, existing indirect measures of oxygen stress, namely mean spring groundwater level [MSL (m above soil surface)] and sum exceedence values [SEV (m day)], were calculated. We considered root respiration stress [RS (kg O2 m−2 10 day−1)] due to anoxic soil conditions as a process-based measure. RS includes the most direct vegetation response to oxygen stress, as respiration is the first plant process that is affected by low oxygen availability in the root zone. For our process-based measure, first daily soil moisture and temperature (Figure 2: B and C, respectively; Figure 3C) were simulated with the dynamic Soil–Water–Atmosphere–Plant (SWAP) model (Van Dam et al., 2008) for the unsaturated zone. Then, the daily respiration reduction (Figure 2: D) was simulated with a recently developed model for oxygen stress to plant roots (Bartholomeus et al., 2008b), which involves macro-scale and micro-scale diffusion, as well as the plant physiological demand of oxygen (Figure 4).
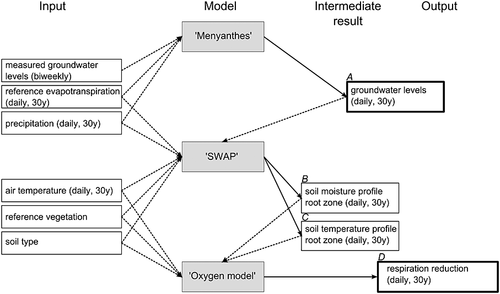
Next, the relationships thus obtained were used for a test of the applicability of these measures outside their calibration range. Thereto, we predicted Fm for the Flemish region in Belgium and compared prediction errors for MSL, SEV and RS. Finally, to investigate how the three measures behave under different future climates, we predicted Fm for four climate scenarios and investigated differences in Fm predicted on the basis of RS versus those by MSL and SEV.
Groundwater and vegetation characteristics data
We used vegetation plots from the datasets of Runhaar (1989) (188 plots) and the Netherlands State Forest Service (Hommel et al., 2007) (178 plots) to establish relationships between proxies for oxygen stress and Fm. The plots originate from a wide range of terrestrial vegetation types differing in succession stages, soil type, soil moisture regime, nutrient availability and soil pH. None of the investigated plots had been under the influence of a major change in hydrological conditions. All plots were representative of natural habitats in the Netherlands, a small and flat country with a temperate climate that has only small spatial differences in meteorological conditions. The mean summer and winter temperature is 289 K and 276 K, respectively, the mean yearly precipitation is 770 mm, and the mean yearly reference evapotranspiration [according to Makkink (1957)] is 563 mm.
Fortnightly measurements of groundwater level data were available in or immediately next to each plot, but only for specific periods and for a limited number of years. However, long time series of groundwater levels are required to define generally applicable relationships, i.e. relationships that are not biased by temporal deviations in meteorological conditions (Bartholomeus et al., 2008a). Therefore, the groundwater level series of all plots of both data sources were extended to the period 1971–2000, which is representative of the actual climatic conditions (Knotters and Van Walsum, 1997; Bartholomeus et al., 2008a) and interpolated to daily values with the Menyanthes impulse response software (Von Asmuth et al., 2002). Menyanthes transforms precipitation and evapotranspiration series (impulse) into groundwater level series (response) (Bartholomeus et al., 2008a) (Figure 3A, B). Daily local meteorological data on air temperature, precipitation and reference evapotranspiration [according to Makkink (1957)] were available from the Royal Netherlands Meteorological Institute (KNMI) from 1970 onwards. We omitted plots without soil descriptions, plots with variable soil surface levels and plots for which a reliable simulation of soil moisture conditions was impossible. Overall, 145 plots were used for further analysis. The same time series of groundwater levels were used to compute MSL, SEV and RS (Figure 2).
A list of moisture indicator values for plant species tailored to the Netherlands and the Flemish region in Belgium was used to compute the arithmetic mean moisture indicator value Fm for each plot. Witte et al. (2007) compiled this list of indicator values from published ecological groups for vascular plants (Witte, 2002; Runhaar et al., 2004), mosses and liverworts (Dirkse and Kruijsen, 1993) and Characeae (Van Raam and Maier, 1993). All plant species present in a plot were used to calculate its average vegetation characteristic in terms of mean indicator value Fm. Following the findings of Käfer & Witte (2004), no weight was given to species abundance. The indicator values range from one, for species from aquatic systems, to four, for species from extremely dry systems (illustrated in Figure 1).
We validated the relationships between proxies of oxygen stress and vegetation characteristics obtained for the Netherlands with data from the Flemish region in Belgium (Huybrechts et al., 2009), neighbouring the Netherlands. Detailed data on groundwater levels and species composition of the vegetation were available for each plot, and Fm was derived for each plot. Similar as for the Netherlands, the groundwater level series were interpolated to daily values and extrapolated to the period 1971–2000 with Menyanthes. All proxies were calculated for each plot. In contrast to the dataset from the Netherlands, only relatively coarse soil information was available for each plot, which introduced noise in the measures where soil properties are involved, i.e. SEV and RS.
Indirect proxies of oxygen stress
Mean spring groundwater level
The MSL (m above soil surface) has been used as a proxy for reference oxygen stress, on the basis of the assumption that the groundwater level at the beginning of the growing season is decisive for plant growth (Runhaar et al., 1997). MSL was originally selected as the best predictor of vegetation response compared with mean highest and mean lowest groundwater levels (Runhaar et al., 1997). We calculated the 30-year MSL on the basis of the groundwater level on 1 April.
This measure does not account for changes in extreme precipitation events during the growing season, nor for the effects of soil temperature, soil texture or soil organic matter content on oxygen stress. Another disadvantage of this measure is that it depends upon the implied assumption on the start of the growing season. Irrespective of the descriptive capacity of the relationship, which has been shown to be high (Runhaar et al., 1997; Bartholomeus et al., 2008a), it may not be applicable outside the calibration range, e.g. under changing climate conditions, when the growing season will start earlier because of rising temperatures (Menzel et al., 2006; Solomon et al., 2007).
Sum exceedence values
The SEV (m day) has been used as a proxy for reference oxygen stress and involves the duration and extent to which the water table rises above a threshold groundwater level during the growing season (March–September inclusive) (Gowing et al., 1998; Silvertown et al., 1999; Barber et al., 2004). Like MSL, SEVs are directly derived from time series of groundwater levels. Some process knowledge is involved in SEV: Silvertown et al. (1999) defined the threshold groundwater level as the groundwater level at which the gas-filled porosity in the topsoil in average summer conditions is less than 10%, which was assumed to be a critical value for sufficient soil aeration (Wesseling and van Wijk, 1957). This threshold value depends on soil type only.
For each growing season, we calculated SEV as the cumulative difference between the daily groundwater level and the threshold value according to Silvertown et al. (1999). Only positive differences (i.e. threshold exceedences) were included. A 30-year average SEV was calculated.
Similar to MSL, this proxy depends on assumptions with regard to the growing season period and does not account for the effects of soil temperature or of soil organic matter content. It indirectly accounts for precipitation and potential evapotranspiration (through their effect on the groundwater level).
Process-based proxy of oxygen stress
Respiration stress model
Soil microbial and root respiration are the main oxygen-consuming processes that take place in the soil. Root oxygen is determined by interacting respiratory (i.e. oxygen consuming) and diffusive (i.e. oxygen providing) processes in and to the soil, which were described by generally applied physiological and physical relationships, respectively (see Bartholomeus et al., 2008b). The respiration stress, RS (kg O2 m−2 10 day−1), defined as the yearly maximum reduction in respiration across a 10-day period (see 2.4.2Application of the respiration model in this research: reference stress), involves all these relevant processes in the soil–water–plant–atmosphere continuum (Figure 4). Under optimal soil aeration and thus non-limiting oxygen availability, plant roots respire potentially. This potential root respiration corresponds to the oxygen demand of plant roots, which is determined only by plant characteristics and soil temperature (Amthor, 2000).
Upon increasingly wetter conditions, however, the gas-filled porosity of the soil decreases and the oxygen availability becomes insufficient for potential root respiration. The method of Bartholomeus et al. (2008b; where details of all equations involved are provided) is applied to calculate the actual root respiration for a given gas-filled porosity. The difference between the potential and actual respiration (i.e. respiration reduction) determines the respiration stress. A combination of low soil temperatures (e.g. outside the growing season) and low soil oxygen availabilities will hardly affect plant functioning and coincides with a low daily respiration reduction. During the growing season, however, soil temperatures will be higher and low soil oxygen availabilities will thus cause a relatively high reduction. This combination is known to be strongly detrimental to plant survival (e.g. Sojka et al., 1972; Drew, 1983) and is accounted for in the method of Bartholomeus et al. (2008b).
Application of the respiration model in this research: reference stress
In natural vegetation, plants are adapted to oxygen stress, for instance by means of aerenchyma to transport air (e.g. Phragmites sp.), by avoidance of anoxic conditions by growing late and rooting only superficially (Drosera sp.) or by the absence of root-like organs (Sphagnum sp.). In this way, they avoid oxygen stress. The oxygen stress of plants that are adapted to wet and anoxic soils is thus practically zero, and therefore no relationship with Fm is to be expected. For this reason, and following Dyer (2009), we computed respiration stress RS for each site by applying plant characteristics of a hypothetical reference vegetation, defined as a temperate natural grassland not adapted to oxygen stress (cf. Bartholomeus et al., 2008b). The respiration stress thus obtained can be regarded as a site characteristic (such as MSL and SEV) that acts as a proxy for the soil oxygen status, to which the actual vegetation is adapted, independent of the actual (adapted) vegetation.
In the original model of Bartholomeus et al. (2008b), the soil was considered to consist of a single soil compartment and the top boundary for soil oxygen diffusion was given by the oxygen concentration in the atmosphere. Here, we applied the model to a complete soil profile, consisting of 16 layers to allow for layer-specific soil physical properties, moisture content and temperature. Consequently, the oxygen concentration in the gas phase of the soil at the bottom of the upper layer was used as the top boundary condition of the lower layer. This simulation of actual root respiration for the reference vegetation requires daily soil temperature and soil moisture contents in the root zone. These variables were simulated with SWAP (Van Dam et al., 2008), including an improved calculation procedure for nearly saturated conditions (Schaap and van Genuchten, 2005; Cirkel et al., 2010), for the period 1971–2000. The difference between potential and actual root respiration was calculated for each soil layer separately. These differences were summed, resulting in a daily value of respiration reduction for each site. As a measure of oxygen stress, we used the yearly maximum reduction in respiration across a 10-day period, averaged over 30 years. This measure (RS) enables us to account for the effects of both extreme rainfall events and high temperatures, as especially the combination of these conditions affects vegetation (e.g. Sojka et al., 1972; Drew, 1983) and this combination is predicted to increase in the near future (Van den Hurk et al., 2006).
The meteorological input consisted of precipitation and reference crop evapotranspiration data corresponding to those used for the simulations of groundwater levels (2.2) and temperature. Groundwater levels served as the bottom boundary conditions. Soil physical parameters according to Van Genuchten (1980) were derived from the soil database of Wösten et al. (2001).
Climate scenarios and resulting changes in moisture regime
To test the behaviour of the three proxies under changing climatic conditions, we considered four climate scenarios for the year 2050 (Van den Hurk et al., 2006) to predict changes in MSL, SEV and RS and subsequently in Fm. These national scenarios, developed by the KNMI, are based on general circulation model simulations published in the Fourth Assessment Report of the IPCC (Solomon et al., 2007) and include changes in temperature, precipitation and reference crop evapotranspiration (Table 1). The G and W scenarios comprise a +1 K and +2 K global temperature increase, respectively, but with unchanged air circulation patterns in summer and winter. The G+ and W+ comprise the same global temperature increases, but the ‘+’ indicates changed air circulation patterns (Van den Hurk et al., 2006). We transformed time series from 1971 to 2000 of these three climate variables to the 2050 climate, using transformation software supplied by the KNMI (Bakker and Bessembinder, 2007). In addition, on the basis of the data by Kruijt et al. (2008), we decreased transformed reference evapotranspiration values by 2% to account for the higher water use efficiency of plants at increased CO2 levels in 2050.
| Variable | Scenario | |||
|---|---|---|---|---|
| G | G+ | W | W+ | |
| Summer (June–July–August) | ||||
| Mean temperature (K) | +0.9 | +1.4 | +1.7 | +2.8 |
| Mean precipitation (%) | +2.8 | −9.5 | +5.5 | −19.0 |
| Wet day frequency (%) | −1.6 | −9.6 | −3.3 | −19.3 |
| Precipitation on wet day (%) | +4.6 | +0.1 | +9.1 | +0.3 |
| Reference evapotranspiration (%) | +3.4 | +7.6 | +6.8 | +15.2 |
| Winter (December–January–February) | ||||
| Mean temperature (K) | +0.9 | +1.1 | +1.8 | +2.3 |
| Mean precipitation (%) | +3.6 | +7.0 | +7.3 | +14.2 |
| Wet day frequency (%) | +0.1 | +0.9 | +0.2 | +1.9 |
| Precipitation on wet day (%) | +3.6 | +6.0 | +7.1 | +12.1 |
- Effects of climate change on temperature, precipitation and evapotranspiration in the Netherlands for four climate scenarios (Van den Hurk et al., 2006).
These future precipitation and evapotranspiration predictions were used to simulate future groundwater levels in Menyanthes (see 2.2). Subsequently, MSL and SEV were calculated. Future soil moisture and soil temperature profiles were created with SWAP for each scenario, using as input the future air temperature, precipitation, reference crop evapotranspiration and groundwater level series. Finally, future respiration stress RS was simulated on the basis of these soil moisture and soil temperature profiles.
Statistical analysis
We defined relationships between each of the explanatory variables (MSL, SEV and RS) and Fm through regression. First, we checked whether a linear regression model was suitable. If not, we tested non-linear regression equations. The optimal regression equation was selected on the basis of the Akaike information criterion. Non-linear regression models that were conceptually incorrect, because of local extremes or the exceedence of Fm limits within the measurement and predictions range, were not considered. For comparison of the predictive power among explanatory variables, we applied both the Pearson correlation coefficient r between observed and predicted Fm values and the root mean squared error (RMSE) of the predictions.
For the Flemish validation data, we tested whether observed Fm values deviated from predicted Fm values for each relationship (i.e. MSL, SEV and RS vs observed Fm). To do so, we analysed whether the slope and intercept of the relationship between observed and predicted Fm deviated significantly (P < 0.05) from slope 1 and intercept 0.
RESULTS
Relationships between proxies for oxygen stress and Fm
The relationship between MSL and Fm was best described by a sigmoid regression model (Figure 5A), as it levels off at both ends of the Fm scale, i.e. at deep and at shallow groundwater levels (Witte and Von Asmuth, 2003). MSL did not account for differences in Fm values at sites with relatively deep groundwater levels because, with given meteorological conditions, the moisture regime at such sites is completely determined by soil texture.
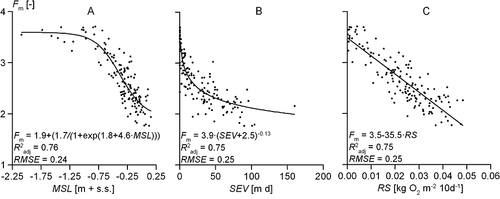
The relationship between SEV and Fm (Figure 5B) showed a vertical asymptote at SEV ≈ 0. This relationship was best described by a power function. Most important is the shallow slope for higher SEV values, representing high levels of oxygen stress. This implies that the proxy apparently does not differentiate much in the range of moderate to severe oxygen stress.
The relationship RS versus Fm (Figure 5C) was best described by a linear regression model, with the Fm values rather evenly distributed across the whole range of RS. The predictive power of the relationship was high and comparable with those based on MSL and SEV. Thus, all three measures performed equally well within the chosen calibration range, but the type of relationship was very different with the relationship between Fm and RS being the most straightforward.
Validation of relationships between proxies for oxygen stress and Fm
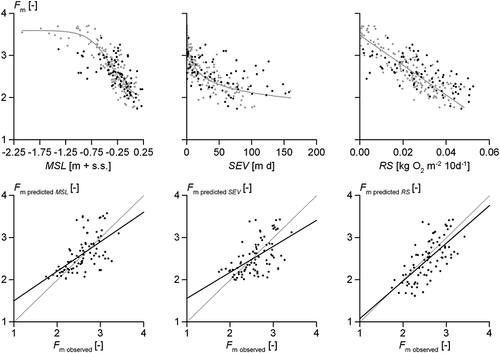
Figure 6 shows the simulated MSL, SEV and RS for our Flemish validation data. Compared with the Dutch calibration set, the validation data showed additional noise around the regression line for all three proxies. However, there were strong differences among the proxies. Large deviations in the MSL–Fm graph especially occurred at sites with relatively deep groundwater levels (appr. MSL < −0.50 m + s.s.), where the observed Fm values of the Flemish region are systematically lower than those of the Netherlands. This can be ascribed to the inclusion of more loamy soils with deep groundwater levels in the validation set. It is very likely that the additional scatter for SEV and RS is caused, at least partly, by the coarse soil data for the validation data. However, the differences for SEV are larger than for RS. Thus, despite the relatively coarse soil data for our validation data, RS is the only proxy for which predicted Fm values did not significantly deviate from the observed ones (Figure 6).
Vegetation predictions for different climate scenarios
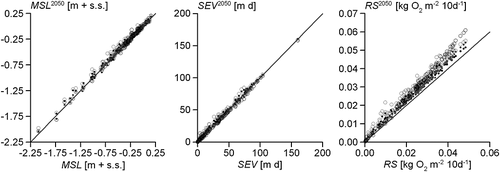
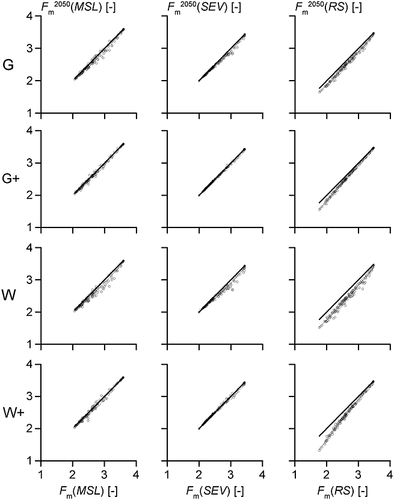
All climate scenarios include an increase in temperature and extreme rainfall events (Table 1). Consequently, like in the experiments of Thompson and Fick (1981) and Tsukahara and Kozlowski (1986), root oxygen stress was expected to increase. However, in contrast to the process-based measure RS, in none of the indirect measures, increased oxygen stress was apparent (Figure 7). This difference was also reflected in the predicted Fm values (Figure 8). The predictions based on MSL and SEV were higher (i.e. drier) than those based on RS for each scenario. For instance, for all climate scenarios, a plot with a predicted Fm2050(RS) of 1.8 appeared to have a predicted Fm2050(MSL) and Fm2050(SEV) of 2.1. Hence, using RS as predictor consistently led to more oxygen stress, especially for sites with a shallow groundwater table.
DISCUSSION
Process-based versus indirect relationships between oxygen stress and vegetation
Even though the two indirect proxies (MSL and SEV) and the process-based proxy for oxygen stress (RS) performed equally well in describing vegetation characteristics for the Netherlands under the current climate, only RS performed well in the vegetation validation. Our process-based proxy thus outperforms indirect ones, as relationships based on the latter seem only valid for the region in which they were determined and calibrated. This is most likely due to the fact that the use of root respiration reduction, which is the most direct plant physiological response to oxygen stress, allows the inclusion of all environmental drivers, including climate, in the estimates.
Assumptions on model parameters, schematization of relevant processes and numerical discretizations in our detailed simulation of soil moisture, soil temperature and soil oxygen (Figure 2) potentially introduces errors. Therefore, adding process knowledge may be at the cost of the goodness-of-fit of derived relationships. Despite this drawback, the explained variance of the relationship between Fm and RS is comparable with the explained variances of the relationships between Fm and MSL and SEV, which indicates that RS is a robust predictor for Fm. This is also confirmed by the strong predictive power of RS across the complete range of Fm values, which indicates that we considered the main processes that are relevant to vegetation composition. The fact that respiration stress is also a discriminating factor at relatively dry sites (Fm = 3–4) (Appendix A) demonstrates that it captures the entire moisture gradient. It is reasonable to expect, however, that drought stress will be the primary driver for vegetation characteristics at dry, groundwater-independent sites (Runhaar et al., 1997) and that respiration stress is only related to this driver in an indirect manner, i.e. through soil texture (Appendix A).
By using Fm, we are able to predict the type of plants that grow at a site. If desired, Fm can be translated into the occurrence probabilities of specific species groups (Witte et al., 2007). Instead of Fm, also plant traits may be used to characterize the vegetation (Suding et al., 2008). From a scientific viewpoint, the use of measurable plant traits that link directly to the most important drivers of vegetation responses would be ideal to relate vegetation characteristics to soil oxygen. However, because there are many physiological responses to oxygen stress, it is difficult to combine all possible adaptations into a single variable. In addition, information on physiological adaptations to oxygen stress for all representative plant species is lacking. Because such information is difficult and laborious to obtain, it is unlikely that it will become available in the near future. Considering both the strong relationship between oxygen stress and Fm and its proven applicability outside the measuring range, it seems that the concept of indicator values is, at least for the time being, the best alternative for plant traits.
Applicability of proxies for oxygen stress for climatic projections
Our analysis illustrates that there are differences between vegetation predictions for future climatic conditions that are based on RS versus those based on MSL and SEV (Figure 8). Our analysis suggests that the indirect proxies of oxygen stress may underestimate the increased oxygen stress under changing climatic conditions at a given future groundwater level dynamics. These differences in calculated oxygen stress occurred despite the fact that the same groundwater levels were used as input. In contrast to RS, especially the highest values for MSL and SEV (thus highest oxygen stress) are almost equal to those for the actual climatic conditions (Figure 7). Consequently, both MSL and SEV predict higher Fm values (i.e. drier vegetation) than RS (Figure 8). However, especially at shallow groundwater levels, large shifts in oxygen stress are expected with climate change, as the combination of a higher soil moisture content and an increased temperature will lead to increased oxygen stress (e.g. Sojka et al., 1972; Drew, 1983). The differences among Fm2050(RS), Fm2050(MSL) and Fm2050(SEV) were not caused by the choice of the non-linear regression models for MSL and SEV, because for each of these measures, an alternative design by a linear regression without asymptotes based on Fm < 3.0 led to highly similar differences in predicted Fm values.
The differences in predicted vegetation characteristics may have major consequences. For example, according to our findings, differences of 0.5 on the Fm scale are expected. Under the actual climate, this comprises a difference in MSL of about 0.25 m, which in turn determines the occurrence versus the absence of, for example, Molinea meadows or Sphagnum dominated bogs (Runhaar et al., 2003). Therefore, using process-based or indirect measures in habitat distribution models could lead to systematic and ecologically significant differences in the evaluation of the impact of climate change on vegetation.
We based our current climate relationships on a combination of two very detailed datasets, both of which were originally specifically compiled to analyse soil moisture–vegetation relationships (Runhaar, 1989; Hommel et al., 2007). Unfortunately, such a specific combination of accurate data is currently unavailable for different climates, obstructing the possibilities for validating the predicted Fm values for such climates. Nevertheless, there are several arguments that support the assumption that RS actually leads to more reliable vegetation predictions than MSL or SEV. First, the oxygen consumption of and supply to plant roots strongly depend on soil temperature, a variable that has been incorporated only in RS (2.4.2). Second, both MSL and SEV require assumptions on the starting date and length of the growing season, which are to some extent arbitrary and which will change with the changing climate. Third, extreme precipitation events are known to have a major effect on vegetation characteristics, which is expressed in RS, hardly in MSL or SEV. Fourth, unlike RS, the relationship of MSL and that of SEV versus vegetation characteristics have to be recalibrated for all new environmental conditions (as shown by Figure 6), which is impossible for a future climate.
On the basis of these arguments, we argue that vegetation predictions based on relationships that have relatively low levels of causality (i.e. indirect measures) should not be used to predict the vegetation response under future climatic conditions. As the predictions based on process-based and on indirect proxies differ, our analysis ratifies the need for process-based relationships in habitat distribution models. We advocate using RS as process-based measure to predict vegetation characteristics at groundwater-dependent systems, as it is based on relevant plant physiological, soil physical and climate-dependent processes.
We applied the respiration model to a hypothetical reference vegetation to obtain a site characteristic, independent of the actual (adapted) vegetation. The use of a reference vegetation improves the applicability of models in which stress measures are implemented, especially in predicting climate change effects (Dyer, 2009). The yearly average simulated soil respiration rates (for our reference vegetation, defined as a temperate natural grassland) were 1.47 and 1.06 kg O2 m−2 year−1, based on potential and actual root respiration, respectively. These simulations correspond reasonably well to measured average values for temperate grasslands (1.18 kg O2 m−2 year−1; Raich and Schlesinger, 1992) and respiration ranges across different terrestrial biomes (0.1 to 3.5 kg O2 m−2 year−1) in general (Raich and Schlesinger, 1992).
For the calculation of RS, we selected the period with the highest cumulative respiration reduction for each year. Focussing on these extreme events may be crucial to capture climate change effects on vegetation. For instance, suboptimal soil oxygen conditions do not necessarily impair the vegetation, because normal metabolism of plants is flexible, responding to moderate fluctuations in environmental changes (Gaspar et al., 2002; Körner, 2003). Therefore, the events that deviate most from the average conditions, i.e. the extremes, will have most impact on the vegetation (Chapin et al., 1993; Knapp et al., 2002; Weltzin et al., 2003; Van Peer et al., 2004; Bokhorst et al., 2007). To account for these extremes, we selected for each simulation year the 10-day period with highest reduction in plant metabolic functioning, i.e. in respiration reduction, because a period of 10 days of oxygen stress has been shown to hamper the plant metabolism already (Huang et al., 1998). However, using a period of, for example, 7 or 14 days led to highly similar Fm2050(RS) values for each of the climate scenarios [average absolute difference 0.01 (±0.01)]; thus, the proxy is robust for the period chosen.
Application in ecological prediction models
By including the relevant processes and the use of a site-independent reference vegetation, our novel proxy RS to characterize oxygen stress will be applicable to vegetation types and regions that differ from those considered in this research. The process-based approach makes superfluous the calibration of the RS versus Fm relationship in other regions, as shown by Figure 6. By defining the stress of a reference vegetation, specific information about the actual vegetation characteristics at a site is not required. This increases the applicability of our approach, because databases that combine the required environmental data and actual vegetation information are currently lacking (4.2).
Given the demonstrated ecological significance of process-based relationships, incorporating them into habitat distribution models is advised. The calculation of RS requires additional simulations compared with MSL and SEV, which may be considered undesirable or unfeasible. For the calculation of actual root respiration, we therefore constructed repro functions that reproduce the behaviour of the full respiration model Appendix B(Appendix B). The application of these repro functions simplifies and speeds up the calculations considerably. Still, the use of repro functions does not diminish the amount of soil data that are needed as input for the simulations. However, even when only coarse approximations of soil type, soil moisture and soil temperature are available, RS can be calculated. The model predictions thus obtained correspond quite well to the predictions based on the detailed simulations (Appendix B).
Conclusions
We have demonstrated that our process-based explanatory variable for oxygen stress surpasses indirect ones used so far to predict vegetation characteristics. We further suggest that indirect measures may be insufficient to analyse the effect of climate change on vegetation composition. Essential parameters that influence the occurrence of oxygen stress and that are expected to change in the future climate – higher temperatures and extreme rainfall events – are insufficiently accounted for. Hence, we propose a process-based relationship between oxygen stress and vegetation characteristics in terms of respiration stress. Our novel measure of root oxygen stress is an important quantitative step following the recommendations of previous studies (Franklin, 1995; Guisan and Zimmermann, 2000) to define relationships with high levels of causality that are indispensable for robust vegetation predictions.
ACKNOWLEDGEMENTS
This study was carried out in the framework of both Project A1 ‘Biodiversity in a changing environment: predicting spatio-temporal dynamics of vegetation’ of the Dutch national research program Climate Change and Spatial planning (www.klimaatvoorruimte.nl) and the joint research program of the Dutch Water Utility sector. We wish to thank Han Runhaar, Staatsbosbeheer and INBO for providing their valuable data.
Appendix A: Oxygen stress at groundwater-independent sites
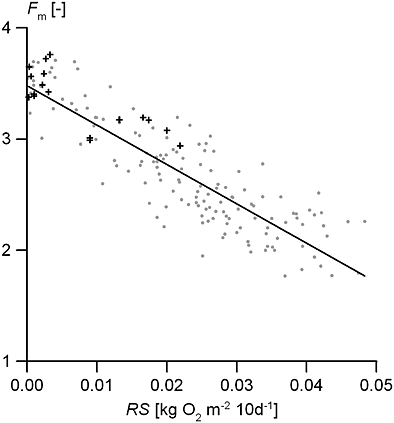
Figure 5(C) illustrates that Fm is related to RS over the whole range of Fm values. This indicates that respiration stress is a discriminating site factor at relatively dry sites (Fm = 3–4) too. Apparently, at deep groundwater levels, the soil moisture conditions can incidentally be that high that oxygen stress occurs. To investigate this, we calculated respiration stress for plots that are groundwater independent, i.e. the groundwater levels are so deep that they do not influence the soil moisture conditions in the root zone by capillary rise. We used 17 plots with soil descriptions from Jansen et al. (2000) and simulated soil moisture and soil temperature profiles with SWAP.
The groundwater-independent sites appeared to fit well within the relationship between RS and Fm, as derived for groundwater-dependent sites (Figure A.1). This can be explained by a negative correlation between oxygen stress and drought stress: the finer the soil texture, the higher the oxygen stress, but the lower the drought stress as well. However, the Fm values at the groundwater-independent sites seem to be somewhat higher (i.e. drier) than at groundwater-dependent sites, which indicates the absence of capillary effects at groundwater-independent sites.
Appendix B: Shortcuts for the calculation of RS
The advantage of simulated daily respiration reduction as proxy of oxygen stress is that relevant plant physiological and soil physical processes are considered in detail. The disadvantage is that the procedure is relatively laborious and time consuming. Therefore, we also calculated actual root respiration by repro functions (Bartholomeus et al., 2008b) that reproduce the behaviour of the full respiration model. These repro functions speed up the simulations considerably.
The repro functions are based on the plant characteristics of the reference vegetation (2.4.2) and are defined for all soil types of the Staring series (Wösten et al., 2001). The main difference with the full model is that the top boundary condition is always defined by the atmospheric oxygen concentration Catm. Consequently, the distance over which oxygen diffusion is calculated (z) is given with respect to the soil surface. Therefore, we simulated actual root respiration in a given soil layer based not on the gas-filled porosity of the specific layer but on the arithmetic mean gas-filled porosity of the layer and the upper layers instead. The resulting respiration stress is denoted as RSrepro.
In order to further increase the practical applicability of the computation, we investigated whether coarse approximations of the input parameters might still result in acceptable model predictions. The following approximations were made: (1) both the calculations of potential and actual root respiration were based on the air temperature instead of the simulated soil temperatures, (2) the soil characteristics were only defined by the most upper soil layer and (3) hydrostatic equilibrium was assumed to describe the soil moisture conditions and thus gas-filled porosities in each soil layer. On the basis of the data thus obtained, we simulated actual root respiration with the repro functions as described above. The resulting respiration stress is denoted as RSsimple.
The relationship RSrepro versus Fm [Figure B.1(B)] resulted in an approximately similar regression line as RSfull versus Fm [Figure B.1(A)], although the predictive power of the relationship is a bit lower. The relationship RSsimple versus Fm [Figure B.1(C)] resulted in a relationship with a relatively low predictive power. The assumption of hydrostatic equilibrium to describe the soil moisture conditions leads to an underestimation of the respiration stress at relatively dry sites. Consequently, both the slope and the intercept of the regression line are lower than for RSfull versus Fm [Figure B.1(A)].
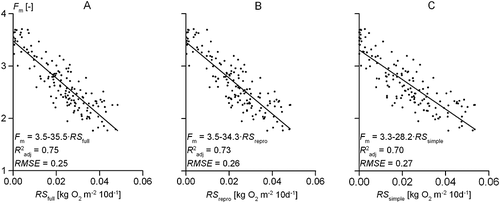
For each of the climate scenarios holds that predicted Fm2050(RSrepro) and Fm2050(RSsimple) values are not significantly different from predicted Fm2050(RSfull) values.


