Earth's Climate History Explains Life's Temperature Optima
Funding: This work was supported by Marsden Fund (MFPUOW1904).
ABSTRACT
Why does the growth of most life forms exhibit a narrow range of optimal temperatures below 40°C? We hypothesize that the recently identified stable range of oceanic temperatures of ~5 to 37°C for more than two billion years of Earth history tightly constrained the evolution of prokaryotic thermal performance curves to optimal temperatures for growth to less than 40°C. We tested whether competitive mechanisms reproduced the observed upper limits of life's temperature optima using simple Lotka–Volterra models of interspecific competition between organisms with different temperature optima. Model results supported our proposition whereby organisms with temperature optima up to 37°C were most competitive. Model results were highly robust to a wide range of reasonable variations in temperature response curves of modeled species. We further propose that inheritance of prokaryotic genes and subsequent co-evolution with microbial partners may have resulted in eukaryotes also fixing their temperature optima within this narrow temperature range. We hope this hypothesis will motivate considerable discussion and future work to advance our understanding of the remarkable consistency of the temperature dependence of life.
1 Introduction
Growth and reproduction for most organisms, including microbes, plants, and animals (ectotherms and homeotherms), reach a maximum at mesophilic temperatures (< 40°C; Arroyo et al. 2022; Dell, Pawar, and Savage 2011; Gillooly et al. 2001; Sørensen et al. 2018). Above an organism's temperature optimum (Topt), there is often a rapid decline in growth rate. Below Topt, growth rate gradually declines to near zero at 0°C. This asymmetric temperature response is determined by the temperature dependence of metabolic pathways, maintenance of cellular structures, and ability to access resources (Araújo et al. 2013; Bennett et al. 2021; Dell, Pawar, and Savage 2011; Figure 1). The origin of this remarkably consistent upper bound of Topt remains unknown but has been suggested to lie in Earth's paleo-environmental history (Bennett et al. 2021).
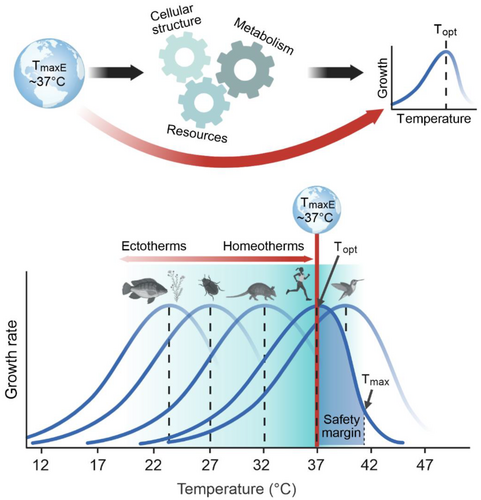
Earth's surface temperature history has been a controversial topic for a few decades (e.g., Jaffrés, Shields, and Wallmann 2007). Recently, the use of a new paired mineral oxygen isotope approach revealed that stable ocean temperatures did not exceed ~37°C on average for at least the last two billion years of Earth's history (Isson and Rauzi 2024). Furthermore, independent sedimentological and geochemical evidence suggest that the preceding Archean eon was characterized by similarly temperate conditions (Isson and Rauzi 2024).
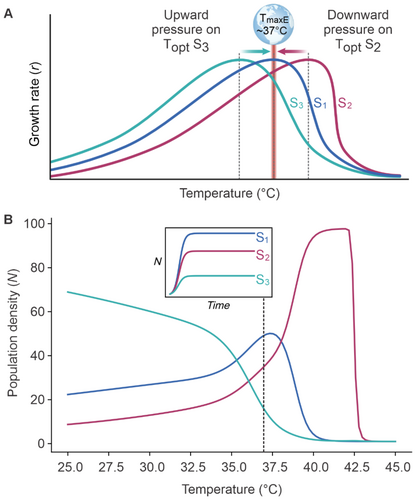
Here, we consider how this consistent temperature window constrained the evolution of Topt for growth in prokaryotes and the subsequent emergence of eukaryotes. We propose that the average global maximum temperature of the environment (TmaxE) imposed strong selection pressures on the upper bound of growth Topt in early prokaryote communities via competitive dynamics (Comeault and Matute 2021; Hillebrand 2011; Figure 1). This upper bound was constrained through two mechanistically distinct pressures that select against species with growth Topt above or below maximal environmental temperatures (Figure 2A). For warmer periods in Earth history (relative to the modern climate), evidence for a reduced equator-to-pole temperature gradient (Evans et al. 2018) suggests that life on Earth was subject to a more uniform climate with fewer colder and hotter refugia. This would have imposed a more globally homogeneous thermal selection pressure on the Topt of life forms toward ~37°C.
1.1 Conceptual Framework
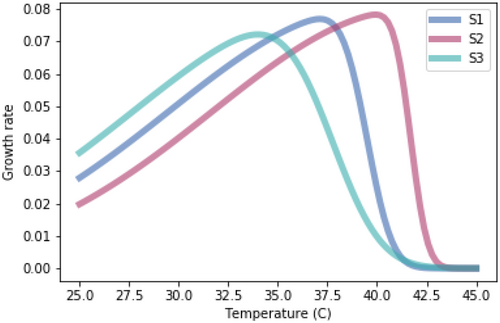
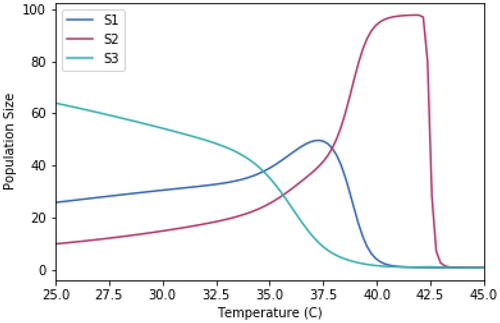
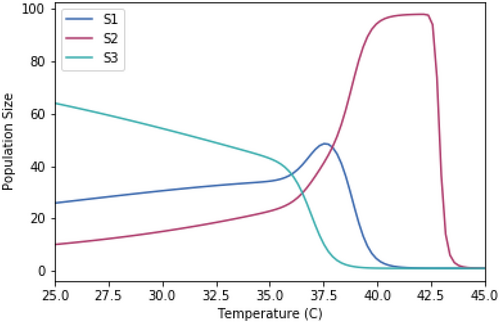
We considered competition between populations of three species at the proposed TmaxE of 37°C, each with a different Topt (Figure 2A): Topt of 37°C (species 1; S1), > 37°C (species 2; S2), and < 37°C (species 3; S3). At temperatures below TmaxE, S3 holds a competitive advantage over organisms with a higher Topt (e.g., S1 or S2). However, when the environmental temperature exceeds Topt of S3, they face large competitive penalties as individuals must invest energy into maintenance rather than growth unless they can retreat to colder refugia. Simply, this pressure will select for organisms with higher Topt approaching TmaxE. The inverse is true for S2 with a Topt above TmaxE (Figure 2A). These organisms can outcompete S1 and S3 but only at temperatures above TmaxE rarely observed during Earth's multi-billion-year history. This implies a persistent downward selection pressure on the Topt of organismal growth. These two selection pressures do not have equal strength, in that the downward pressure exerts a greater constraint on the upper limit of Topt (Bennett et al. 2021; MacLean et al. 2019). This is because organisms with a Topt higher than the TmaxE (such as S2) would have been poor competitors spanning the majority of Earth's history during which life evolved and diversified. In contrast, organisms with a Topt lower than TmaxE (such as S3; Figure 2A) are more likely to experience temperatures that allow for maximal growth. In this framework, organisms with lower Topt are allowed to be competitive across a broader and lower range of temperatures.
2 Results and Discussion
We test this conceptual framework using a simple Lotka–Volterra model of interspecific competition for three organisms with different Topt (see methods). By running the competition model across a range of temperatures, we demonstrate that organisms with lower Topt (such as S3) dominate at lower temperatures at the expense of any competitive advantage at higher temperatures (Figure 2B). Conversely, organisms with higher Topt (such as S2) have a competitive disadvantage at lower temperatures in exchange for a major competitive advantage at higher temperatures. Although the range of temperatures at which an organism with an intermediate Topt (such as S1) outcompetes all other organisms is narrow, it can survive and maintain reasonable population densities across the majority of the environmentally relevant temperature range (Figure 2B). Despite its simplicity, this competition model was highly robust to extensive variations in the thermal performance curves among competing organisms, including thermal sensitivities, temperature optima, and growth curve skewness (see appendices). These various scenarios were based on known interspecific variation in temperature performance curves within and among different lifeforms (Dell, Pawar, and Savage 2011; Kordas, Harley, and O'Connor 2011; Sørensen et al. 2018). It is important to note that many other temperature-dependent biological rates are not included in the classic Lotka–Volterra competition model (i.e., other than growth) that could alter the outcome of competitive interactions. For example, temperature positively affects movement speed, consumer–resource encounter rates, and consumption rates, all of which will further amplify the thermal dependence of interspecific competition and adaptation to optimal environmental temperatures (Dell, Pawar, and Savage 2014). Nevertheless, more complex models that incorporate additional temperature-dependent biological rates should produce equivalent conclusions, due to similar asymptotic thermal performance curves around a temperature optimum (Dell, Pawar, and Savage 2014) that are comparable to growth curves. On protracted timescales, these two selection pressures (Figure 2B) result in the optimal temperature for growth at and below TmaxE (Dell, Pawar, and Savage 2011; Sørensen et al. 2018). Our results demonstrate that temperature optima, alongside minimum and maximum temperature tolerances of organisms, are critical in determining the ecological and evolutionary consequences of shifting environmental temperatures.
This proposed framework does not preclude the evolution of thermophiles and psychrophiles (Engqvist 2018) that maintain lifetime reproductive success at more extreme temperatures. Critically, we note that enzyme Topt values are significantly higher than microbial growth temperatures for psychrophiles (Stark et al. 2022) and lower for thermophiles. This suggests that, to cope with the disconnect between enzyme performance and environmental temperature, extremophiles have evolved other metabolic adaptations such as heat shock proteins in thermophiles (Ezemaduka et al. 2014) that incur high maintenance costs, which make them less competitive in mesophilic environments. Despite these exceptions, the thermal performance of life appears to gravitate toward an optimum at 37°C because of the positive scaling of biological rates with temperature (Dell, Pawar, and Savage 2011).
The temperature optima of early unicellular life may also be responsible for the remarkably consistent upper bound of thermal optima of modern organisms (Dell, Pawar, and Savage 2011; Sørensen et al. 2018). The transfer of thermal constraints to more complex multicellular lifeforms could have arisen via multiple pathways. One possibility is that the consistent evolution of Topt for growth in early prokaryotes resulted in a biochemical system optimized to TmaxE so complex that it was inescapable under subsequent changes in environmental temperature. Core components of metabolism are thought to be present in the Last Universal Common Ancestor (LUCA) including the ribosome (protein synthesis), the TCA cycle and gluconeogenesis which link carbon fixing to nucleotide biosynthesis (Petrov et al. 2015; Smith and Morowitz 2004). Temperature constraints on these core processes may be fixed early in evolution and thus their expression today is a relic of early evolutionary innovations (Petrov et al. 2015; Smith and Morowitz 2004). Thus, the temperature optimization of early unicellular organisms could have led to the preordained thermal properties of metabolism in evolving lifeforms such as metazoans, plants, fungi, and algae. The constrained temperature response of inherited biochemistry would be further re-enforced during the co-evolution of the thermal performance of hosts and their microbiomes (Zilber-Rosenberg and Rosenberg 2008). This suggests most eukaryote hosts and their prokaryote partners faced the same selection pressures to optimize growth below ~37°C for mutual benefit.
If temperature-dependent competition has shaped the evolution of organisms because of stable temperatures below ~37°C for more than two billion years, this raises a multitude of intriguing questions. As metabolism regulates processes at the cellular level and in turn global biogeochemical cycles, how has Earth's temperature history shaped biodiversity and ecosystem processes from micro- to macro-scales and how have these processes created feedback to constrain changes in global temperatures through time? Further, does the existing Topt of life act as a hard constraint for ongoing adaptation to increasing global temperatures? Exploring these questions can advance our understanding of the past, present, and future variability of Earth's biodiversity.
3 Methods
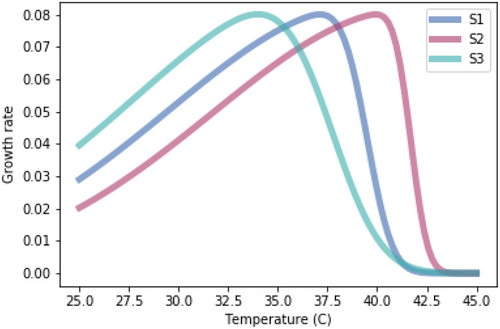
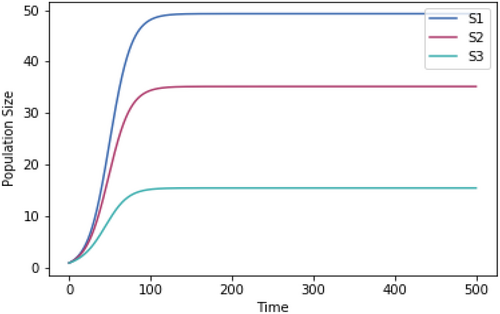
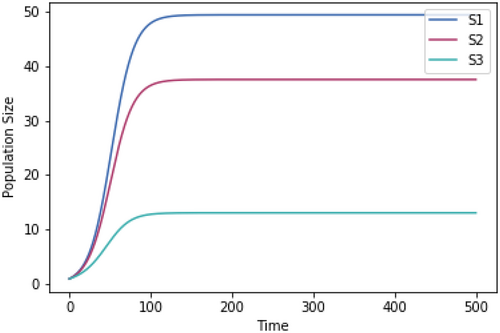
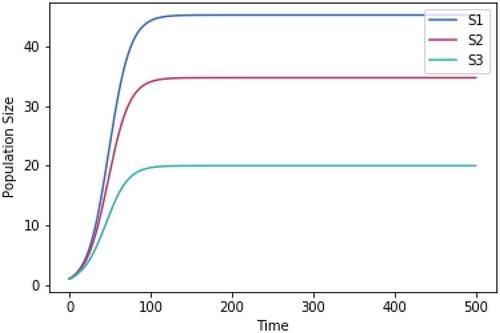
In this model, Ni is the density of competitor i and Ki is the carrying capacity of species i. In our initial model, temperature–growth curves for maximal intrinsic growth rates, r, were varied among species, with S1 having intermediate skewedness and Topt, S2 having high skewedness and Topt, and S3 having low skewedness and Topt (Table A1) to mimic potential scenarios of varied temperature–growth curves (Kordas, Harley, and O'Connor 2011). The temperature–growth curves were normalized to have the same temperature-dependent maximum growth rate for each species (Figure A1). At each temperature tested (spanning a continuous range from 25°C to 45°C), three-species interspecific competition models were run to steady state to determine outcomes in the relative population sizes for each species (Figure A2).
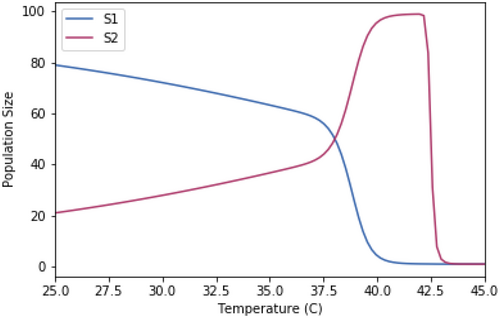
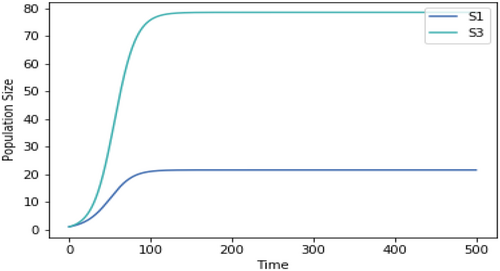
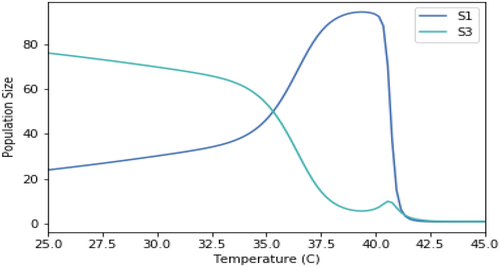
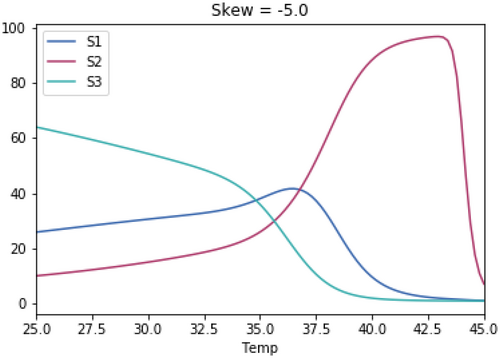
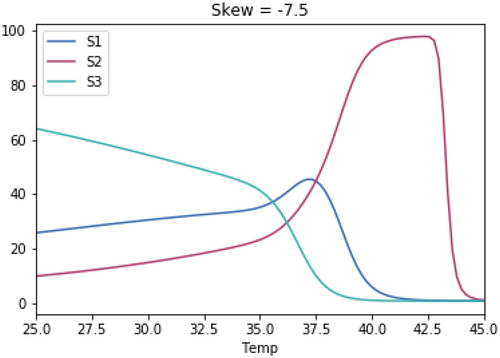
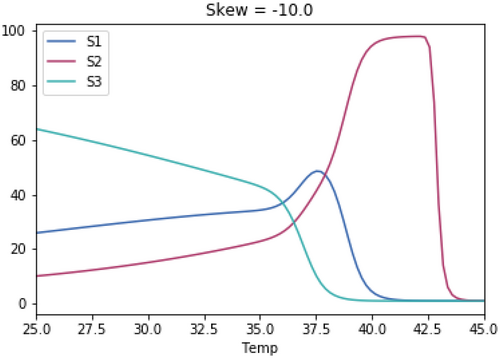
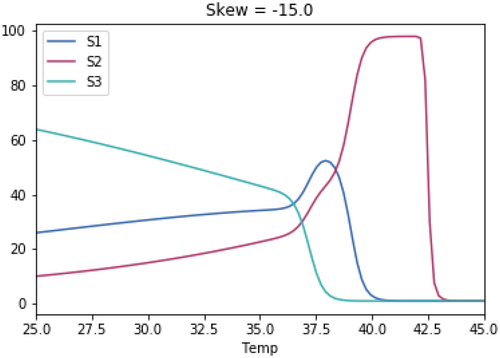
To determine how robust the model was to variations in number of competing species and temperature growth curves among competing species, we tested for the impacts of competing two versus three species by rerunning models across the tested temperature range for each pairwise combination of species (S1 vs. S2, S1 vs. S3, and S2 vs. S3). We then investigated the impact on model behavior of (1) normalization of the temperature–growth curves versus varying skewedness between species, (2) varying magnitude of skewedness in temperature–growth curves, and (3) varying the magnitude of the differences between the temperature optima of the curves (Figures A3-A25). Our model results were highly consistent across these variations, except when the magnitude of variation among competing species in the skewedness or temperature optima of temperature growth curves were extremely small or large. It is worth noting, however, that the extent of variations we applied across these different scenarios are beyond what would be reasonably expected of thermal performance curves for typical contemporary organisms, further demonstrating the robustness of these findings. The code for the model setup as well as code testing the impact of various parameters is available at https://github.com/jen-reeve/2024schipperetal.
Author Contributions
Louis A. Schipper: conceptualization (lead), formal analysis (equal), funding acquisition (lead), investigation (lead), methodology (supporting), project administration (lead), resources (lead), supervision (equal), visualization (supporting), writing – original draft (lead), writing – review and editing (lead). Jennifer L. Reeve: conceptualization (supporting), data curation (equal), formal analysis (equal), investigation (equal), methodology (equal), visualization (equal), writing – review and editing (equal). Vickery L. Arcus: conceptualization (equal), funding acquisition (lead), investigation (supporting), project administration (equal), resources (equal), writing – review and editing (equal). Terry Isson: conceptualization (supporting), investigation (supporting), writing – original draft (supporting), writing – review and editing (supporting). Erica J. Prentice: writing – original draft (supporting), writing – review and editing (supporting). Adele Williamson: writing – original draft (supporting), writing – review and editing (supporting). Andrew D. Barnes: conceptualization (lead), formal analysis (lead), investigation (equal), methodology (equal), supervision (lead), visualization (lead), writing – original draft (equal), writing – review and editing (equal).
Acknowledgments
This work was supported by the Marsden Fund (Grant Number MFPUOW1904 to VLA and LAS). We thank the editor and reviewers for helpful comments. Open access publishing facilitated by The University of Waikato, as part of the Wiley - The University of Waikato agreement via the Council of Australian University Librarians.
Conflicts of Interest
The authors declare no conflicts of interest.
Appendix A
A.1 Model setup
The growth rate–temperature relationships of the three species had both different optima as well as different skewedness levels. The code for the model setup as well as code testing the impact of various parameters is available at https://github.com/jen-reeve/2024schipperetal.
The relationships for each species were normalized to have the same maximum growth rate at each species' temperature optimum.
| Species | Temperature optimum (°C) | Skewedness |
|---|---|---|
| S1 | 37.1 | −10 |
| S2 | 39.9 | −15 |
| S3 | 33.8 | −5 |
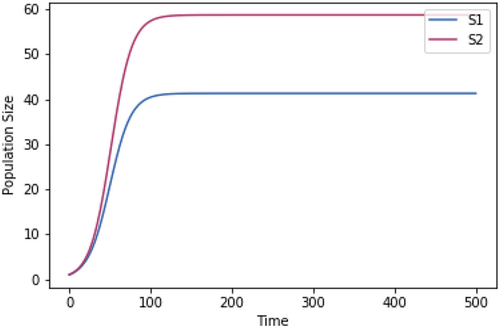
For each temperature tested, the competition model was run to steady state, as shown at 37°C in Figure A2 in example.
A.2 Model stress testing
A.2.1. 2 Species Competition
Competition models using the same growth rate temperature dependence but only two species at a time.
A.2.2. Impact of Normalizing the Growth Rates
Running the competition model with growth rate–temperature relationships that are identical to those used in Figure 1.3 except that they are not normalized to have the same growth rate at the temperature optimum.
A.2.3. Impact of Equal Skewedness of Growth Rate Temperature Relationships
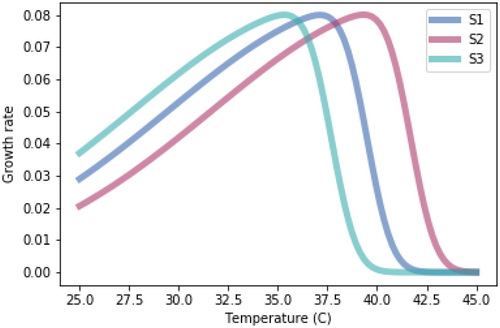
Running the competition model with growth rate-temperature relationships that are identical to those used in Figure 1.3 except that they have identical skewedness (skew = −10).
A.3 Impact of Magnitude of Skewedness of Growth Rate Temperature Relationships
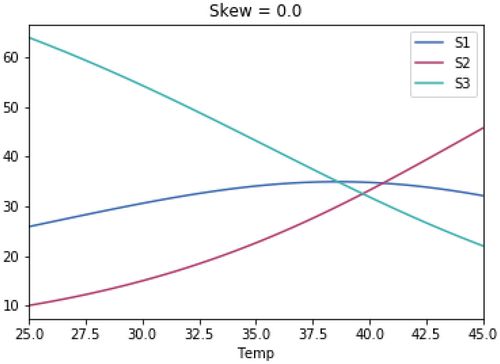
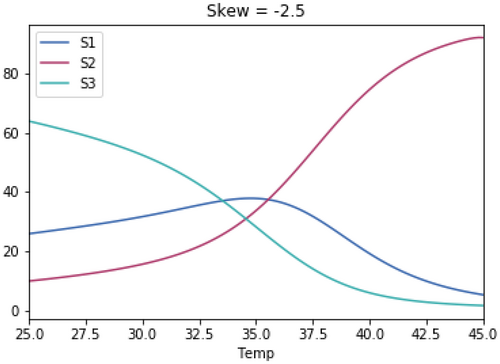
As with the previous test, the skewedness for all three species is the same in each test.
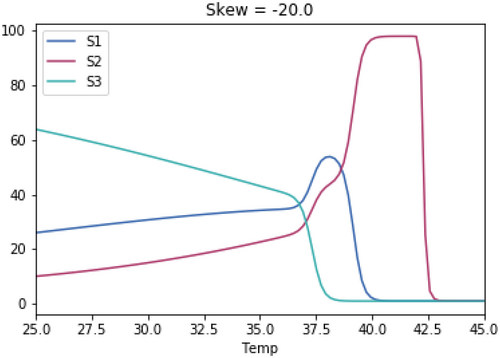
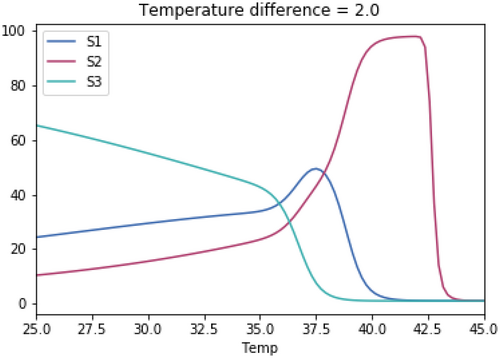
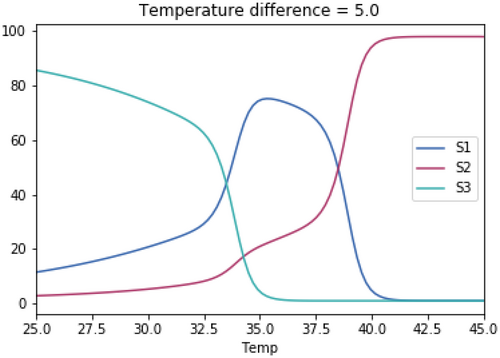
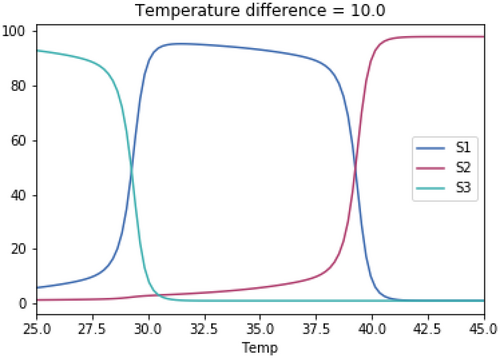
A.3.1. Impact of Varying the Differences in Temperature Between the Three Species
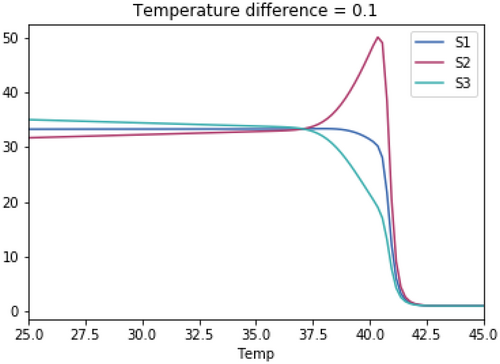
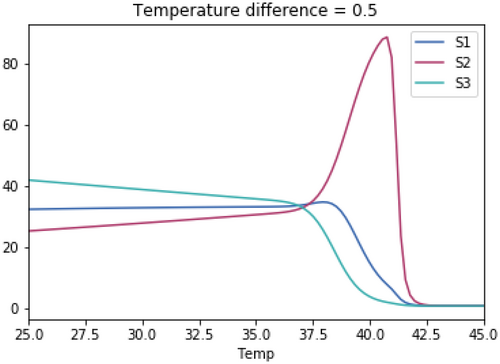
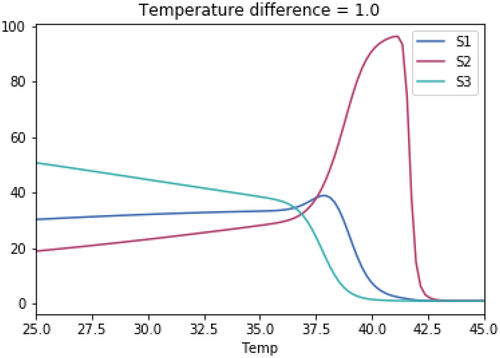
As with the previous tests, the skewedness for all three species is the same in each test. The temperature optimum for S1 in each test is 37.1°C. The temperature optimum for S2 for each test is 37.1°C + the temperature difference. The temperature optimum for S3 for each test is 37.1°C—the temperature difference.
Open Research
Data Availability Statement
The code for the model setup as well as code testing the impact of various parameters is available at https://github.com/jen-reeve/2024schipperetal.


