Item reduction of the 39-item Rotterdam Diabetic Foot Study Test Battery using decision tree modelling
Funding information: Nuts Ohra Fund, Grant/Award Number: 1002-042
Abstract
Aims
Pedal sensory loss due to diabetes-related neuropathy can be graded by testing static two-point discrimination (S2PD), moving two-point discrimination (M2PD), static one-point discrimination (S1PD; eg, 10-g monofilament), and vibration sense and is included in the Rotterdam Diabetic Foot (RDF) Study Test Battery. The aim of this study is to investigate if decision tree modelling is able to reduce the number of tests needed in estimating pedal sensation.
Methods
The 39-item RDF Study Test Battery (RDF-39) scores were collected from the prospective RDF study and included baseline (n = 416), first follow-up (n = 364), and second follow-up (n = 135) measurements, supplemented with cross-sectional control data from a previous study (n = 196). Decision tree analysis was used to predict total RDF-39 scores using individual test item data. The tree was developed using baseline RDF study data and validated in follow-up and control data. Spearman correlation coefficients assessed the reliability between the decision tree and original RDF-39.
Results
The tree reduced the number of items from 39 to 3 in estimating the RDF-39 sum score. M2PD (hallux), S2PD (first dorsal web, fifth toe), vibration sense (interphalangeal joint), and S1PD (first dorsal web, fifth toe) measurements proved to be predictive. The correlation coefficients to original scores were high (0.76 to 0.91).
Conclusions
The decision tree was successful at reducing the number of RDF Test Battery items to only 3, with high correlation coefficients to the scores of the full test battery. The findings of this study aids medical decision making by time efficiently estimating pedal sensory status with fewer tests needed.
1 INTRODUCTION
Diabetes-related neuropathy is the most important risk factor for diabetic foot ulceration (DFU) and is associated with amputations and falls, indicating that neuropathy is a serious medical and public health problem.1-5 Since diabetes-related neuropathy is prevalent, the annual incidence of DFU is high, ranging from 1.0% to 4.1%, with prevalence rates from 4.0% to 10.0%.6 Although poor outcomes in DFU disease have been reported, healing of the foot pathology is achieved in most patients, with major amputation (ie, above ankle level) necessary in less than 5% of all patients.7-9 Yet minor amputations (ie, below ankle level) occur more frequently, with rates ranging from 5% to 40%, conditional on the population studied.8, 9 Neuropathy-induced falls occur in up to 31% to 35% of older diabetic adults in a 5-year follow-up window, with a reported risk ratio of 1.64 (95% CI, 1.27-2.11) compared with that of healthy controls.10-12 The associated costs are high, with both American and Dutch studies reporting mean costs per fall of US$ 9463, nearing the in-hospital costs of a DFU episode (mean US$ 10 827).13, 14
Only few treatments exist targeting the underlying nerve damage of these three complications; therefore, prevention is the cornerstone of diabetes care.15 Recently published consensus documents emphasize the importance of providing foot care; identification of the at-risk foot; educating patients, family, and health care providers about foot care; and treatment of preulcerative signs.16 There is an important role for screening on sensory loss, as this does not necessarily correlate with experienced symptoms.17, 18 Recently, the 39-item Rotterdam Diabetic Foot Study Test Battery (RDF-39) was developed to create a valid and reliable tool for the objective assessment of sensory status of the feet.17, 18 The RDF-39 is a 40-point scale, ranging from 0 (no aberrant tests) to 39 (all tests aberrant), and includes tests on static and moving two-point discrimination (S2PD and M2PD, respectively), vibration sense, 10-g monofilaments, and cold stimuli that are applied on various sites of the feet, supplemented with information on experienced numbness, Romberg test, prior ulceration, and lower-extremity amputations. A low score on the RDF-39 represents little deafferentation (ie, sensory loss), while a high score represents severely diminished pedal perception that increasingly relates to risk of DFU development and falls.17, 19, 20
The RDF-39 is a dichotomized version of the full RDF Study Test Battery and takes about 10 minutes to complete.18 Since shorter measures can improve efficiency, especially in a busy outpatient clinic, reduction in the number of tests might be of benefit. Decision tree analysis is one of few methods to reduce item length of questionnaires or test batteries.21 A potential advantage of this analysis is its efficiency in data reduction.22, 23 The aim of this study is to investigate if item reduction techniques are able to reduce the number of tests needed in estimating the RDF-39 sum score, without compromising the psychometric performance of the full test battery.
2 MATERIALS AND METHODS
2.1 Study design and subjects
The current study is part of the RDF study, a prospective cohort study of unselected type 1 and type 2 diabetic patients followed at the outpatient Diabetes Clinic of the Franciscus Gasthuis & Vlietland Hospital, Rotterdam, the Netherlands. The aim of the RDF study is to investigate the natural history of neuropathy, including deterioration of sensation of the feet. The RDF study participants were recruited from patients visiting the specialized outpatient diabetes clinic. RDF study inclusion criteria were diabetes mellitus (treated with oral blood glucose–lowering drugs and/or insulin), older than 18 years, no significant cognitive impairment, speaks Dutch, and signed informed consent. Exclusion criteria were active radicular syndrome and neurological disease interfering with sensibility of the feet, as assessed at the interview and with the screening questionnaire. RDF study design and methods are described in more detail in previous articles.17, 24 Patients were subjected to an interview and a physical examination and were requested to fill in a questionnaire, which was repeated in follow-up visits 1 to 1.5 years later. The Medical Research Ethics Committee of Erasmus University Medical Center, Rotterdam, the Netherlands, approved the study (MEC-2009-148).
2.1.1 Healthy controls
A total of 196 healthy volunteers were tested with the same measurement instruments and the same protocol as the RDF study population, as part of a separate study to obtain normative data for cutaneous threshold and spatial discrimination in the feet.25 Volunteers were recruited from hospital and university personnel, and relatives and friends of patients visiting the outpatient clinic. Inclusion criteria included patients 18 years and older, with no significant cognitive impairment, who spoke Dutch or English, and provided signed informed consent. Exclusion criteria were a positive history of active radicular syndrome, a neurological disease that interfered with sensation in the feet, diabetes mellitus, thyroid malfunction, alcohol abuse, human immunodeficiency virus, or chemotherapy—all these were established at the interview using a screening questionnaire.
2.2 Data collection and tests
Lower-limb sensory status information (full RDF Study Test Battery) was collected at RDF study baseline and follow-up visits 1 and 2. Datasets of RDF study baseline measurements, follow-up visits, and cross-sectional data from a previous study on normative test data were combined for current analyses.
2.2.1 The RDF-39
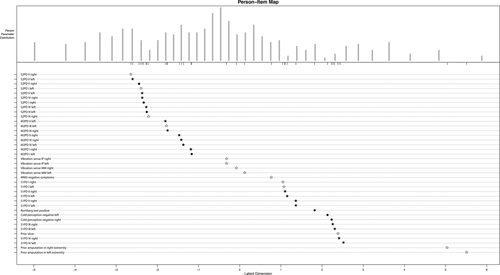
The RDF-39 includes both instruments and test sites to measure overall foot sensation and consists of 39 individual items that measure the unidimensional construct of foot sensation.17, 18 This scoring system contains dichotomized items on S2PD, M2PD, static one-point discrimination (S1PD), vibration sense, cold stimulus tests, Romberg test, experienced numbness, prior DFU, and prior amputation (see Table 1 for a clinical scoring sheet). Both feet were examined. S2PD and M2PD were tested with a Disk-Criminator (US Neurologicals LLC, Poulsbo, Washington), with the threshold set at 8 mm (abnormal: >8 mm), based on previously published normative values.25 S1PD was tested with a 10-g Semmes-Weinstein monofilament (Baseline Tactile, Minneapolis, Minnesota), on the basis of current international standards of medical care in diabetes.16 S2PD, M2PD, and S1PD test sites were chosen in concordance with the nerve territories of the foot: I, plantar hallux (medial plantar nerve [tibial nerve]); II, medial heel (calcaneal nerve [tibial nerve]); III, first dorsal web (deep peroneal nerve); IV, lateral foot (sural nerve); and V, plantar fifth toe (lateral planter nerve [tibial nerve]). Vibration sense was tested with a Rydel-Seiffer tuning fork (Martin, Tuttlingen, Germany) at the medial malleolus and dorsal interphalangeal joint of the hallux and compared with normative threshold data.26 Cold sensation was tested by applying a cold piece of metal to the arch of the foot. Information on numbness was derived from the Michigan Neuropathy Screening Instrument (MNSI), which was administered before the physical examination. Information on prior ulceration and/or amputation, as indicators of severe sensory loss, was derived from the patient interview. Sensory test items consisted of both a sensory test and a test location (eg, S1PD at the lateral foot [S1PD IV], S2PD at the plantar fifth toe [S2PD V]). All 39 individual items were scored with 1 or 0. A score of 1 indicated abnormality on a test item (ie, could not feel the stimulus). A patient's level of foot sensation is then estimated by taking the sum of the test item scores. The maximum score is 39 points (including both ankles and feet), with higher scores indicative of more severe sensory loss (Figure 1).17, 18
| Left Lower Extremity | Test result (0 = Nonaberrant, 1 = Aberrant) | Right Lower Extremity | Test result (0 = Nonaberrant, 1 = Aberrant) |
|---|---|---|---|
| S2PD II left | S2PD II right | ||
| S2PD I left | S2PD I right | ||
| S2PD III left | S2PD III right | ||
| S2PD V left | S2PD V right | ||
| S2PD IV left | S2PD IV right | ||
| M2PD II left | M2PD II right | ||
| M2PD III left | M2PD III right | ||
| M2PD IV left | M2PD IV right | ||
| M2PD I left | M2PD I right | ||
| Vibration sense IP left | Vibration sense IP right | ||
| Vibration sense MM left | Vibration sense MM right | ||
| S1PD I left | S1PD I right | ||
| S1PD V left | S1PD V right | ||
| Numbness | (Derived from MNSI) | ||
| S1PD II left | S1PD II right | ||
| S1PD III left | S1PD III right | ||
| S1PD IV left | S1PD IV right | ||
| Prior ulcer | (Scored for any extremity) | ||
| Cold stimulus left | Cold stimulus right | ||
| Romberg test | |||
| Amputation left | Amputation right | ||
| Subtotal | Subtotal | ||
| Total RDF-39 score |
- Note: Roman capitals are indicative of test locations: I, plantar hallux; II, medial heel; III, first dorsal web; IV, lateral foot; V, plantar fifth toe.
- Abbreviations: IP, interphalangeal joint; MM, medial malleolus; MNSI, Michigan Neuropathy Screening Instrument; M2PD, moving two-point discrimination; S1PD, static one-point discrimination (10-g Semmes-Weinstein monofilament); S2PD, static two-point discrimination.

 ) as indicators of items included in the 13-item scale. Note that all 13 RDF-13 items are included in the RDF-31 scale.18 The authors published this figure as part of an open access article, under the terms of the Creative Commons Attribution-NonCommercial-NoDerivatives 4.0 Licence18
2.3 Statistical analysis
Missing item data were replaced by imputed data using the procedure of expectation maximization, using 25 iterations. Statistical analysis was carried out using IBM SPSS Statistics version 24.0 (IBM Corp, Armonk, New York, USA) and R package 3.4.1 (R Foundation for Statistical Computing, Vienna, Austria). We considered P values below .05 (two-sided) to be statistically significant.
2.3.1 Decision tree analysis
The decision tree was created using the 39 individual test item scores from RDF study baseline (n = 416 patients). Classification and regression tree (CART) analysis was used to create a decision tree with the RDF-39 sum score as dependent outcome and all individual test items (n = 39) as independent variables. The CART method identifies the test item that provides the most equal split in patients' RDF-39 sum score. Within the consequent subgroups, CART will again identify the test item that provides an equal split, on the basis of the RDF-39 sum score. The algorithm will stop when a maximum of three splits (ie, the maximal number of questions that is allowed, called “depth”) has been executed or when no more than 20 patients remain in a subgroup.27, 28 Mean and standard deviations of RDF-39 scores per subgroup are given.
2.3.2 Validation
With the use of a 25-fold bootstrap, the decision tree was validated. Follow-up data of RDF study participants and data of healthy controls were used to internally validate the decision tree version of the RDF-39 (DT-RDF-39) in predicting the original RDF-39 sum score from the different cross-sectional measurements (n = 4).
2.3.3 Reliability and agreement
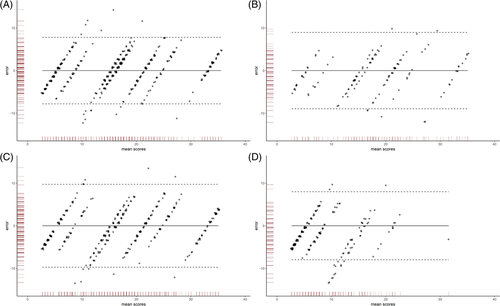
Bland-Altman plots were used to plot the differences between the original RDF-39 and predicted DT-RDF-39 sum scores. The plots describe whether the agreement between the predicted score and the original score is dependent on the original score and what the difference is, together with 95% confidence intervals.29 These comparisons were made for all cross-sectional measurements (baseline and follow-up year 1 and year 2 and in the healthy controls dataset). Additionally, Spearman correlations were calculated between the original RDF-39 and DT-RDF-39 sum scores.
3 RESULTS
3.1 Included subjects
Between January 2014 and July 2017, a total of 1111 individual patient measurements were completed in both diabetic subjects and healthy controls. A total of 416 diabetic patients were included in the RDF study of which the data of 364 patients at first follow-up and data of 135 patients at second follow-up, supplemented with data from 196 healthy controls, were available for current analyses.
3.2 Classification and regression tree
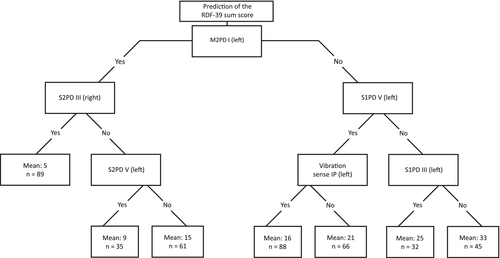
CART analyses reduced the number of test items from 39 to three to estimate the total RDF-39 sum score in 416 diabetic subjects, for which only a Disk-Criminator (S2PD and M2PD), Rydel-Seiffer tuning fork, and 10-g monofilament are needed. Patients in the lowest range of the RDF-39 sum score (mean [SD]: 5.4 points [3.7]) could be identified with only two tests: M2PD at the hallux (left) and S2PD at the first dorsal web (right). The full decision tree, together with predicted mean RDF-39 sum scores (SD) per subgroup, can be found in Figure 2.

The bootstrapped decision tree identified M2PD I left (plantar hallux of the left foot) as the most discriminating test (step 1). Patients who are unable to discriminate this moving 9-mm stimulus as two separate points on that particular site (M2PD I left) should be tested with the 10-g monofilament test at the left fifth toe (S1PD V left), which is then the most discriminating test (step 2). When this stimulus is felt, vibration sense at the left interphalangeal joint (vibration sense IP left) is tested. Finally, in patients who are insensate to the 10-g monofilament at the left fifth toe (S1PD V left), continuation of 10-g monofilament testing of the left first dorsal web (S1PD III left) is the most discriminative (step 3) in estimating overall pedal sensory status (ie, the RDF-39 sum score).
Patients who are able to discriminate the M2PD stimulus at the left hallux (step 1) then need to be tested with S2PD at the first dorsal web (S2PD III right, step 2). When the patient is unable to discriminate this static 9-mm stimulus as two separate points, the same test is applied at the left fifth toe (S2PD V left), as final step (step 3) to predict the RDF-39 sum score.
3.2.1 Validity, reliability, and agreement
Figure 3 shows the four Bland-Altman plots for which RDF study baseline measurements (panel A, n = 416), first follow-up (panel B, n = 364), second follow-up (panel C, n = 135), and cross-sectional data from healthy controls (panel D, n = 196) were used. All plots show that the differences between the original scores and DT-RDF-39 sum scores were marginal, in which the 95% confidence interval is at most ±10 points, with the difference between the two scores not being dependent of the RDF-39 sum score itself. Agreement is the highest for high and low scores, while for scores in the midrange area, sometimes the confidence limit threshold is exceeded. Spearman correlations between original scores and DT-RDF-39 scores were high (baseline measurement data, 0.91; first follow-up, 0.88; second follow-up, 0.88; and in data from controls, 0.76).

4 DISCUSSION
We showed that particular sites of sensibility testing could precisely categorize patients with diabetes according to the overall sensory status of their feet. The results of our study suggest that a high accuracy can be achieved by using only three instruments on a maximum of three test sites, reducing patient burden and aiding efficient medical decision making, at lower costs. The decision tree was found to be valid in predicting the RDF-39 sum score, after cross validation the tree in RDF study follow-up data and data from controls.
Current guidelines suggest the use of monofilament and/or tuning fork to assess loss of sensation in diabetic subjects.30 However, thresholds and cut-off values on how many test sites to be used for predicting, for example, first-onset DFU, are often conjectured.2, 31-33 A recent study using prospective RDF study data showed that particular sites of monofilament and vibratory testing outperformed composite scores of tuning fork (up to four test sites) and 10-g monofilaments (up to 10 test sites) in the prediction of ulcer-free survival.27 It is the combination of sensory test and test site that allows for staging of sensory loss, according to recently developed grading scales, with both test and test site having predictive properties regarding the degree of sensory loss observed.17, 18 The consecutive steps of the presented decision tree are in line with these grading scales, as these steps represent the modalities that are successively lost in the natural course of diabetes-related neuropathy.18
Previous literature has shown that peripheral nerve problems can be graded with an elaborate somatosensory examination.34-36 In its earliest forms, neuropathy could be detected when the pressure threshold to discriminate two static points increases. An abnormal innervation density, reflected by a widening two-point discrimination, is the next step in this process, which is followed by both an abnormal innervation density and a pressure threshold.37 Yet only computer-assisted devices are capable of detecting both pressure threshold and innervation density. In a portion of RDF study, participants' computer-assisted measurements were carried out, in which the same sequence of abnormality of functions was observed. However, it was concluded that these computer-assisted measurements are not ideal for larger population studies since it is time-consuming and a difficult test for both patient and operator.38
The RDF Study Test Battery consists of instruments that are able to grade patient's peripheral nerve problems in a more practical manner, by measuring a subset of the aforementioned somatosensory functions. Simple-to-use instruments examine innervation density by testing the function of large myelinated nerve fibres (slowly adapting fibre-receptor system [S2PD] and the quickly adapting fibre-receptor system [M2PD]), vibration sense (tuning fork), the presence of protective sensation (10-g monofilament), and C-fibre function (cold stimulus).17, 18 According to the developed grading scale of pedal sensory loss (RDF-39), the functional loss seen in diabetes-related neuropathy is clustered, which means that for all test sites on the feet, S2PD becomes aberrant before M2PD and vibration sense in the natural course of the disease.18 In the natural history of loss of sensory modalities, the loss of protective sensation differs per test site, with the first dorsal web and lateral foot becoming insensitive to the 10-g monofilament as last of all test locations. This is reflected in the presented decision tree of the current study, as being insensate to the 10-g monofilament at the first dorsal web is associated with a mean RDF-39 sum score of 33, the highest predicted mean sum score of the seven subgroups patients were allocated to. Since neuropathy is the most important factor in the cascade to DFU, we suggest from this study that patients should be stratified according to degree of sensory loss.39
Strengths of our study are the large amount of individual measurements from an unselected group of patients with diabetes, together with data from a control population, in which the decision tree was also found to be valid.17, 18 Moreover, the multisensory modalities included in the RDF-39 are reflected in the decision tree that was developed using modern statistical techniques. Decision tree analysis has been demonstrated useful in item reduction of questionnaires and test batteries and has been used in different fields of medicine.27, 40 Several caveats relating to our study are important to highlight. Firstly, the RDF-39 was developed to grade patients' overall lower-limb sensory status. The RDF-39 is a dichotomized version of the full RDF Study Test Battery, by which the exact thresholds at test locations are determined.18, 25 Consequently, some information is lost when using the RDF-39 alone. For a more thorough assessment of, for example, tibial nerve function, the full test battery is needed (S1PD, S2PD, and M2PD) at the respective test sites. In the present study, overall lower-limb sensory status could be estimated because of the high agreement between the RDF-39 and DT-RDF-39. The DT-RDF-39 is especially of use in the annual foot examination that diabetic patients are subjected to, since this approach is more a screening than full somatosensory assessment but presumably more accurate compared with current strategies.27, 30, 41 Secondly, no test-retest, inter-rater, and intra-rater studies of the RDF-39, as measures of reliability, have been executed yet. From current practice in-hospital settings, we observe that diabetic patients without neuropathy symptoms and intact spatial acuity have valid test results with low measurement error, suggesting high specificity (ie, the true-negative rate). This may especially be of importance in a screening setting, for example, at the general practitioner, by whom the majority of diabetic patients are annually evaluated regarding their risk of DFU development. However, if symptoms of neuropathy (eg, hyperalgesia and allodynia) are present, we often observe that S2PD and M2PD measurements are more difficult to conduct, resulting in aberrancy of test results. However, other RDF-39 items such as 10-g monofilament and vibratory testing are generally more tolerated and conducted with less measurement error. Future studies should assess the aforementioned measures of reliability, together with the use of parameters of measurement error, in different (clinical) settings and populations.21 We expect that correlation coefficients may differ depending on the sensory modality tested, with more unreliable results in the more-difficult-to-conduct tests (ie, S2PD and M2PD) that become aberrant first in the natural course of the disease.17, 18
In summary, this study may help the clinician by presenting a decision tree that quickly estimates patients' ability at the feet without the need of scoring all 39 items of the RDF-39. The decision tree suggests that patients can be categorized in subcategories of sensory loss in only three steps, which might be helpful in a busy outpatient clinic, reducing costs, and in improving patient's compliance.
GUARANTOR'S STATEMENT
Dr Willem D. Rinkel is the guarantor of this work and, as such, had full access to all the data in the study and takes responsibility for the integrity of the data and the accuracy of the data analysis.
FUNDING INFORMATION
Support for the RDF study was partially provided by Nuts Ohra Fund, the Netherlands, a nonprofit organization providing financial aid for medical research (grant no. 1002-042). Nuts Ohra did not have any influence on the design, analysis, or interpretation of this study.
CONFLICT OF INTEREST
No potential conflicts of interest relevant to this article were reported.
AUTHOR CONTRIBUTIONS
W.D.R. researched data and wrote the manuscript. M.vd.O. researched data. J.H.C. contributed to discussion and reviewed/edited the manuscript. All authors approved the final version of the manuscript and take responsibility for the integrity of the data and analysis.


