Imaging flow cytometry reveals a subset of TdT negative T-ALL blasts with very low forward scatter on conventional flow cytometry
Funding information: Danish Cancer Society, Grant/Award Number: R167-A11027; Max Wørzner & wife Inger Wørzner's Foundation; Danish Cancer Society
Abstract
Background
Studies in T-cell acute lymphoblastic leukemia (T-ALL) have shown that leukemic blast populations may display immunophenotypic heterogeneity. In the clinical setting, evaluation of measurable residual disease during treatment and follow-up is highly dependent on knowledge of the diversity of blast subsets. Here, we set out to evaluate whether variation in expression of the blast marker, TdT, in T-ALL blasts could correspond to differences in morphometric features.
Methods
We investigated diagnostic bone marrow samples from six individual T-ALL patients run in parallel on imaging flow cytometry (IFC) and conventional flow cytometry (CFC).
Results
Guided by the imagery available in IFC, we identified distinct TdTneg and TdTpos subpopulations with apparent differences in internal complexity. As TdTneg blasts predominantly displayed very low forward scatter (FSC) on CFC, these subsets were initially excluded from routine analysis as debris, elements of small diameter, apoptotic, and/or dead cells. However, IFC-based morphometric analyses demonstrated that cell size and shape of TdTneg blasts were comparable to the TdTpos cells and without morphometric apoptotic hallmarks, supporting that the TdTneg subpopulation corresponded to T-ALL blasts. Fluorescence in situ hybridization analyses substantiated the clinical relevance of TdTnegFSCvery-low cells by retrieving known diagnostic cytogenetic abnormalities at comparable frequencies in purified TdTnegFSCvery-low and TdTposFSCint subsets.
Conclusion
We highlight this finding as knowledge of phenotypic heterogeneity is of crucial importance in the clinical setting for delineation and quantification of blast subpopulations of potential biological relevance. We argue that the IFC imagery may allow for visual verification and improvement of applied gating strategies.
1 INTRODUCTION
Imaging flow cytometry (IFC) is an innovative flow cytometric technology currently explored in the field of hematology (Doan et al., 2020; Hui et al., 2018, 2019). The technique integrates the high-throughput capacity of conventional multicolor flow cytometry (CFC) with digital microscopy thereby enabling visual inspection of individual events coupled with traditional immunophenotyping. The IFC detection system generates a multichannel digital imagery that can include up to 10 fluorescent parameters as well as bright field (BF) and side scattered (SSC) light for every cell that passes through the system. This allows for subsequent quantification of image-based morphometric parameters, for example, size, shape, and texture of predefined cell regions such as cell cytoplasm or nucleus. Moreover, the imagery allows for visual verification of gating strategies.
Given these considerations, it is tempting to explore the value of this technology in a routine diagnostic setting, where the addition of morphometric evaluation to conventional immunophenotyping may add to our knowledge of sample heterogeneity in hematologic malignancies. In acute leukemia, it is well established that the neoplasms can consist of more than one subclone, and that blast populations varies considerably in morphology, in terms of both size and shape, and often present with several cell subsets with different immunophenotypic characteristics (Dworzak et al., 2018; Swerdlow et al., 2017). Knowledge of phenotypic heterogeneity is of crucial importance in the clinical setting, as disease monitoring by evaluation of measurable residual disease (MRD) during treatment and follow-up is highly dependent on capturing the phenotypic diversity of blast subsets. An example of such heterogeneity is observed in T-cell acute lymphoblastic leukemia (T-ALL), where the expression of the intranuclear DNA polymerase terminal deoxynucleotidyl transferase (TdT) — a marker of the precursor nature of leukemic blasts — varies considerably (Roshal et al., 2010; Zhou et al., 2013). This marker is used in the routine diagnostic evaluation of T-ALL, and in the determination of leukemia-associated immunophenotypes for monitoring MRD (Slaper-Cortenbach et al., 1988; Van Dongen et al., 2012).
In the present explorative study, we set out to evaluate whether variation in TdT expression in T-ALL blasts could correspond to differences in morphometric features. To address this, we compared data from six T-ALL patient samples acquired in parallel on the IFC platform and a conventional Navios™ flow cytometer.
2 MATERIALS AND METHODS
2.1 Patient material, sample preparation, and staining
Cryopreserved mononuclear bone marrow (BM) cells from six diagnostic T-ALL samples (ID-1-6, Table 1) from patients treated at the Department of Hematology, Aarhus University Hospital, Denmark (2004–2016) were thawed and stained with a panel of titrated monoclonal antibodies. First, surface staining with α-CD45 (KrO, clone J.33, Beckman-Coulter, Brea, CA) and α-CD3 (PE, clone UCHT1, Agilent, Santa Clara, CA) was performed, followed by fixation, permeabilization (IntraStain, Agilent), and staining for nuclear (Nu) TdT (FITC, clone HT-6, Agilent) as well as intracellular (ic) CD3 (PB, clone UCHT1, BioLegend, San Diego, CA). DRAQ5 (eBioScience, Santa Clara, CA) was used as a nuclear counterstain in a final concentration of 1.25 μM. The same staining panel was also applied on freshly prepared mononuclear BM cells from a patient newly diagnosed with T-ALL (ID-8, Table 1). For this sample a viability marker Zombie NIR (BioLegend) was also included to allow for the exclusion of dead cells. An additional patient sample (ID-7, Table 1) was used for the fluorescence-activated cell sorting experiments. This study was approved by the Danish Data Protection Agency (record number 1-16-02-359-19).
| Patient ID | Age | BM Blast (%) | Blast immunophenotype | Karyotype | Interphase FISH |
|---|---|---|---|---|---|
| 1 | 5 | 94 | icCD3+CD3–CD4–CD8+CD2+CD7+CD5+TdTdimCD99+CD1adim | 46,XX[25] | 90 % deletion STIL |
| 2 | 43 | 97 | icCD3+CD3–CD4–CD8+CD2+CD7+CD5dimTdT+CD99+CD1a– | 46,XY[25] | n.d. |
| 3 | 7 | 55 | icCD3+CD3–CD4–CD8-CD2dimCD7+CD5dimTdT+CD99+CD1adim | 47,XY,del(7)(p11),+8,add(14)(q32)[cp7]/46,XY[18] | n.d. |
| 4 | 49 | 96 | icCD3+CD3+CD4–CD8–CD2dimCD7+CD5–TdT+CD99+CD1a– | 46,XX,der(5)t(5;6)(q3?5;?),i(7)(q10),-21,+22[30] | n.d. |
| 5 | 3 | 90 | icCD3+CD3–CD4–CD8dimCD2+CD7+CD5+TdT+CD99+CD1a– | 46,XX,t(11;14)(p1?3;q11)[9]/46,XX[6] | 86 % TCRAD translocation |
| 6 | 21 | 96 | icCD3+CD3–CD4–CD8–CD2+CD7+CD5dimTdT+CD99+CD1a– | 46,XX[25] | n.d. |
| 7 | 13 | 83 | icCD3+CD3–CD4–CD8–CD2dimCD7highCD5–TdT+CD99+CD1a– | 52,XY,+8,+10,+12,+13,+15,+18,+19,+21,+22[cp21]/46,XY[4] | 85 % MYC duplication 84 % TCF3 duplication |
| 8 | 45 | 91 | icCD3+CD3–CD4+CD8+CD2+CD7+CD5+TdTdimCD99+CD1a+ | 47,XY,+8,del(9)(p21) [2]/46,XY [23] | n.d. |
- Abbreviations: BM, bone marrow; FISH, fluorescence in situ hybridization; icCD3, intracellular CD3; n.d., not determined.
2.2 Data acquisition and processing
Samples were divided in two for data acquisition on (A) IFC (ImageStream®X Mark II; laser configuration 405, 488, 561, and 642 nm; Luminex) and (B) CFC (Navios™, 10-colors, 405, 488, and 638 nm lasers, 5 + 3 + 2 PMT configuration; Beckman-Coulter). On both platforms, single-color-stained compensation beads (OneComp eBeads™, eBioScience) were included as compensation controls for the fluorochrome-conjugated monoclonal antibodies (MoAbs) and single-color-stained cells for DRAQ5. On IFC the fluorochromes were detected in the following channels: FITC, Channel 2; PE, Channel 3; PB, Channel 7; KrO, Channel 8; DRAQ5, Channel 11. SSC was detected in Channel 6. Subsequent fluorescence compensations and data analyses were performed with the IDEAS® (Image Data Exploration and Analysis Software) (version 6.2.187.0, Luminex) and FlowJo™ Data Analysis software (version 10.6.2, BD Bioscience, San Jose, CA). Blast enumeration and routine immunophenotyping were performed at diagnosis at the Department of Hematology, Aarhus University Hospital (Table 1). Leukemic blast populations were gated within nucleated singlets and identified as being CD45lowSSClowicCD3pos and surface CD3pos/neg in accordance with the immunophenotype at diagnosis (Figures S1 and S2; Table 1). The fractions of TdTpos/neg lymphoblasts were gated based on internal CD3neg lymphocyte control populations (Figure S1F). Moreover, the population contour was taken into consideration to avoid separating cells with similar TdT expression. For IFC data Object (tight) and Morphology masks were created to demarcate the cellular (Figure S3A) and nuclear (Figure S3B) region of nucleated lymphoblasts, respectively. Moreover, for the study of apoptotic nuclei a threshold was put on the nuclear mask to only encompasses the 30% brightest pixels intensity values within the intensity range (Figure S3B). Relevant morphometric features were calculated using these masks (Table S1). Following compensation and initial focus and single-cell gating in IDEAS®, IFC data were exported as .fcs files with all used features and analyzed in FlowJo™ to facilitate identical data scaling of IFC and CFC data.
2.3 Fluorescence-activated cell sorting
Cryopreserved BM mononuclear cells from three selected T-ALL patients with known cytogenetic aberrations (ID-1, 5, and 7; Table 1) were thawed and stained with Zombie NIR™ Fixable Viability dye (Biolegend) and pre-titrated MoAbs against surface antigens: α-CD45 (KrO, clone J.33, Beckman-Coulter), α-CD3 (PE, clone UCHT1, Agilent), and α-CD71 (PerCP-Cy5.5, clone CY14G, BioLegend). This was followed by fixation, permeabilization (IntraStain, Agilent), and staining for nuclear (Nu) TdT (FITC, clone HT-6, Agilent) and intracellular (ic) CD3 (PB, clone UCHT1, BioLegend). DRAQ5 (eBioScience) was used as a nuclear counterstain in a final concentration of 1.25 μM. Fluorescence-activated cell sorting was performed on a BD FACSAria™ III (BD Biosciences) equipped with four lasers; 405, 488, 561, and 633 nm. Compensation was set using unstained, DRAQ5, and Zombie NIR single-color-stained cells combined with single-color-stained compensation bead controls for the MoAbs. Using the gating strategy depicted in Figure S4, non-erythroid leukemic T-ALL blasts were identified as CD45lowSSClowCD71negicCD3posCD3neg and sorted into TdTposFSCint and TdTnegFSCvery-low subsets. In addition, CD45highCD3pos lymphocytes and CD45negCD71pos erythroblasts were sorted as negative control populations. The distinction between TdTpos/neg cells were set using a combination of internal negative controls (CD3neg lymphocytes and CD45negCD71pos erythroblasts) and FITC FMOs. For one patient (ID-1) surplus material was available for purity analyses. Sorting purity ranged from 94.5%–100% (Table S2).
2.4 Interphase FISH
Fluorescence in situ hybridization (FISH) analyses were performed as described in (Toft-Petersen et al., 2016). Briefly, cytospins were prepared after cell sorting and the following locus-specific directly fluorescent-labeled probe sets were used according to the manufacturer's instructions: SIL-TAL sub-deletion probe at 1p32 (Agilent Dako, Santa Clara, CA, USAcc), TCRAD break apart probe at 14q11.2 (Cytocell Ltd., Cambridge, UK), XL MYC BA probe at 8q24.21 (MetaSystems, Altlussheim, Germany), and E2A break apart probe at 19p13.3 (Cytocell Ltd.). For all sorted subsets a range of 77–100 interphase nuclei were scored (Table S3).
2.5 Statistical analyses
For comparison of continuous variables between TdTneg and TdTpos groups, the Wilcoxon matched-pairs signed-rank test was used. P-values <0.05 were considered significant. Calculations were conducted in GraphPad Prism version 7 (GraphPad Software, La Jolla, CA).
3 RESULTS
3.1 Initial analysis of blast TdT expression revealed discrepancies between CFC and IFC data
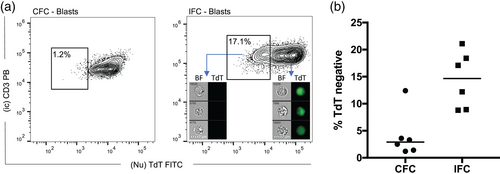
Analyzing samples run on CFC, the entire leukemic blast population appeared TdTpos in five out of six patient samples (ID-1, 2, 3, 5, and 6), whereas a small TdTdim/neg subset (12.4%) was present for patient ID-4 (Figure 1a,b). Next, we assessed TdT expression intensity on IFC data and found that in contrast to CFC data, the IFC results displayed a pronounced TdT expression heterogeneity with distinct TdTneg subpopulations (median: 14.6%; range: 8.8%–21.1%) (Figure 1a,b). Moreover, given that the IDEAS® software allows for image interrogation of single cells, we confirmed TdT negativity and positivity as the absence or presence of a clear nuclear staining pattern in the FITC channel (Figure 1a).

3.2 Morphometric characterization of TdTneg/pos blast populations lead to the identification of blasts with very low FSC in the CFC data
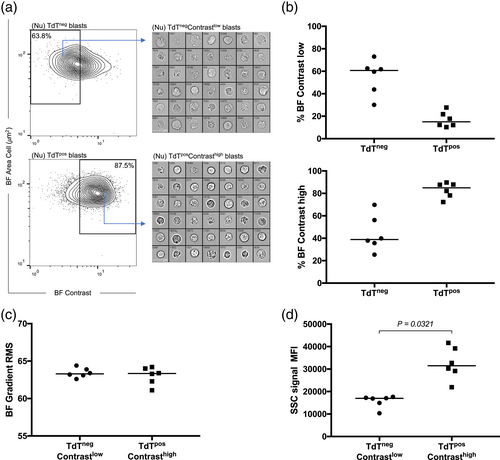
To investigate the discrepancy between IFC and CFC results, and to characterize the appearing TdTneg population, we inspected the imagery of both TdTneg and TdTpos cell subsets and observed visual differences in their BF images. We took advantage of the IDEAS® feature finder wizard to explore the BF channel for relevant features that could pinpoint potential morphometric differences between IFC-defined TdTneg and TdTpos cells. In brief, we identified features within the texture category, for example, BF Contrast, BF Bright Detail Intensity with a pixel radius of three, and BF Modulation, as the highest-ranking features for separating TdTneg and TdTpos subsets. The texture features measure pixel value variations within an image and are thus indicators of image complexity (IDEAS® ImageStream Analysis Software User's Manual). We quantified BF image contrast within the mask covering the entire cell and discriminated between contrast-low and -high blasts based on population contours where values below 5.5 generally defined events of low contrast (Figure 2a). Visual inspection of the BF imagery for TdTnegContrastlow populations demonstrated cells with very low internal complexity lacking intracellular granular structures (Figure 2a, upper panel) whereas TdTposcontrasthigh lymphoblasts displayed a much greater degree of internal complexity manifested as visible granular structures within the cell (Figure 2a, lower panel). The majority of TdTneg blasts were classified as contrast-low events (median: 61.0%; range: 32.7%–73%) whereas the majority of TdTpos blasts displayed contrast-high BF images (median: 84.8%; range 74%–89.7%) (Figure 2b). Moreover, comparison of BF image focus by measuring BF Gradient root mean squared (RMS) histograms showed comparable distributions for the TdTnegcontrastlow and TdTposcontrasthigh events, thus precluding that contrastlow events were just out-of-focus artifacts due to processing on the CCD-camera (Figure 2c). In addition, the observed difference in internal complexity translated into significantly decreased SSC intensity of TdTnegcontrastlow blasts compared to their TdTposcontrasthigh counterparts (Figure 2d).

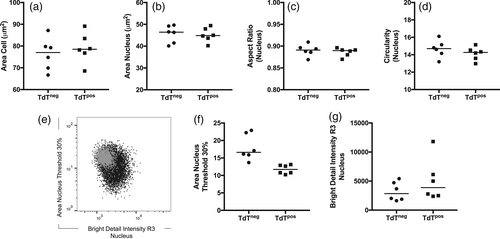
On CFC, particle size and refractive index are essential components of the forward scatter (FSC) signal. As the latter is influenced by cellular composition, objects of same size, but with varying internal complexity, may generate different FSC signal intensities (Shapiro, 2003). Based on the correlation between low BF contrast and SSC signal intensities, we speculated whether the visually confirmed reduction in cellular complexity would translate into diminished FSC signal in the CFC data files. In fact, going back to the CFC data, we identified FSCvery-low populations in the initial bivariate plots used for the identification of intact cells. Including these FSCvery-low subpopulations in the revised immunophenotypic lymphoblast analysis (Figure 3a, left and Figure S1, right panel) revealed the presence of TdTneg subpopulations in CFC acquired samples as well (median: 9.9%; range: 5.8%–18.1%) (Figure 3a, right and 3b). Due to their low FSC/SSC appearance, these FSCvery-low subpopulations were initially categorized as debris and/or dead cells and excluded from further analysis. However, assisted by the imagery available from parallel IFC acquisition, we could verify that the TdTneg subset indeed contained intact, live cells. Importantly, the cell and nuclear area (Figure 4a,b) and nuclear shape, that is, circularity score (Figure 4c) and aspect ratio (Figure 4d) of TdTneg and TdTpos cells were comparable, indicating that the TdTnegFSCvery-low events identified by CFC actually corresponded to T-ALL blasts. To further support the clinical relevance of TdTnegFSCvery-low cells, we performed FISH analyses of sorted TdTnegFSCvery-low and TdTposFSCint subsets from three individual T-ALL patients and retrieved known diagnostic cytogenetic aberrancies in both subsets for all three cases (Table S4). As cryopreservation may affect FSC properties (Dong et al., 2010; Okada, 2016; Shapiro, 2003) and antigen expression patterns of thawed cells, we applied the same staining panel and gating approach on freshly prepared mononuclear cells from a newly diagnosed T-ALL patient (ID-8, Table 1). In this sample 5% of the lymphoblasts displayed very-low FSC signal and of these 50% were TdTneg (Figure S2), thus confirming that our findings in the thawed samples were not a cryopreservation related-artifact. Assisted by the routine immunophenotypic panels, we found that the TdTneg FSCvery-low subpopulation shared the abnormal immunophenotype of the remaining blast population (Table 1). In the cryopreserved samples, we ruled out the presence of dead and apoptotic cells as the cause of the altered FSC signal intensity of the TdTneg cells (Shapiro, 2003) by including a live/dead stain during FACS analysis (Figure S4) and by assessing apoptosis-related morphometrics. The latter was done as described by Henery et al., where the authors show that IFC nuclear imagery features may be used for the identification of fragmented and condensed nuclei inherent to apoptotic cells (Henery et al., 2008). Specifically, fragmented and condensed nuclei will display small bright regions of localized nuclear staining and reduced nuclear areas compared to their normal counterparts. This may be quantified using the features Bright Detail Intensity R3 DRAQ5 and Area Nucleus Threshold 30% DRAQ5, as surrogate markers for apoptosis-related nuclear fragmentation and nuclear condensation, respectively. By thresholding the nuclear mask, it only encompasses the 30% brightest pixels intensity values within the intensity range of a given image which increases the area difference between normal and apoptotic nuclei (Henery et al., 2008). Collectively, apoptotic nuclei may be differentiated from normal nuclei by increased Bright Detail Intensity R3 DRAQ5 and decreased Area Threshold 30% DRAQ5. Visualization of these two morphometric apoptosis markers in bivariate plots revealed no signs of apoptotic nuclei in TdTneg cells when compared to their TdTpos counterparts (Figure 4e-g).


4 DISCUSSION
In this explorative study, employing T-ALL and TdT expression as a vehicle, we observed clear advantages of employing an image-based detection platform in the evaluation of leukemic blast heterogeneity. Specifically, by running diagnostic T-ALL samples in parallel on both IFC and CFC platforms, we identified a subpopulation of leukemic lymphoblasts that were erroneously excluded as debris, apoptotic, and/or dead cells based on FSC properties on the CFC platform. Interestingly, these FSCvery-low cells were predominantly TdTneg and displayed a low level of internal complexity as computed by the quantitative measurement of BF contrast in the IFC data (Figure 1b). Indeed, as the IFC technology measures the actual size of single cells in micrometers, we demonstrated that the TdTneg subpopulation was comparable in size to the remaining leukemic lymphoblasts (Figure 1d). Likewise, comparing shape features such as circularity score and aspect ratio, the shape of the TdTneg cells were comparable to the TdTpos blasts. Furthermore, and of crucial importance to the clinical relevance of the TdTneg cell subset, cytogenetic FISH analyses of sorted TdTnegFSCvery-low lymphoblasts retrieved the diagnostic cytogenetic abnormalities (Table 1 and Table S2).
Our results are a clear reminder that FSC is a complex parameter that does not equal size (Shapiro, 2003). However, in the every-day clinical setting, events with very low FSC are often excluded as being debris, apoptotic cells (Darzynkiewicz et al., 2001), or elements of small diameter, for example, thrombocytes or non-lysed erythrocytes. Here, the combination of a viability stain (in the FACS experiments) and the nuclear stain DRAQ5 together with immunophenotyping enabled us to verify that the FSCvery-low population actually contained intact viable leukemic blasts. It is important to stress this, as viability and nuclear stains are not always integrated in standard routine immunophenotyping, where the initial gating of intact live cells primarily is based on a FSC/SSC/CD45 gating (Chen & Wood, 2017; Van Dongen et al., 2012). This is most likely explained by limitations in hardware capacities and the need for panel optimization to include a wide range of valuable markers essential for immunophenotyping of various hematological neoplasms.
We see several advantages of IFC in a future routine set-up. Here, in the context of T-ALL, the IFC technique ensures that minor TdTneg blast subsets with low internal complexity are not unintentionally discarded. Even though cases of TdTneg T-ALL (defined as less than 10% TdTpos blasts) have been described, hitherto mostly in case reports (Faber et al., 2000), a recent study indicates TdT negativity is associated with high-risk features and poorer outcome (Zhou et al., 2013). Thus, as TdT negativity might hold prognostic information, our results highlight the importance of evaluating all possible neoplastic subclones, not least in monitoring residual disease. Adding further to the complexity of the longitudinal follow up of T-ALL patients is the fact that the expression of TdT and other immature markers are commonly down-regulated or lost with induction chemotherapy (Roshal et al., 2010). Whether such immunophenotypic changes are treatment related, including the use of high-dose steroids, or represents selective survival of more resistant antigen-negative subclones remains unknown (Roshal et al., 2010). Finally, research is investigating TdT as a potential future treatment target (Motea et al., 2012), and in this context, knowledge of TdTneg subpopulations is absolutely crucial.
In conclusion, we show that the direct visualization and morphometric evaluation of events offered by IFC ensures the correct identification of lymphoblastic subclones. This confirms and extends the literature on IFC, where reports have shown that employing IFC-based assays in the routine diagnostics and follow up of hematologic malignancies could be of profound value (Grimwade et al., 2017; Hui et al., 2018; Maguire et al., 2017; Minderman et al., 2012). Importantly, the imagery allows for visual verification of gating strategies, which adds to the evaluation of subclonal heterogeneity and is essential during follow up and subsequent clinical decision-making.
ACKNOWLEDGMENT
Orla Maguire is an ISAC Marylou Ingram Scholar. The authors thank the FACS Core Facility at Aarhus University, Denmark for access to the ImageStream®X Mark II and the FACS Aria III cell sorter. Furthermore, we thank Pia S. Kristensen, Aarhus University Hospital for excellent technical assistance. This work was supported by grants from the Danish Cancer Society and Max Wørzner & wife Inger Wørzner's Foundation. This work was supported by The Health Research Foundation of Central Denmark Region. [Correction added on January 22, 2021, after first online publication: Acknowledgment has been updated]
CONFLICT OF INTEREST
The authors declare no conflict of interests.
AUTHOR CONTRIBUTION
Carina A. Rosenberg, Marie Bill, Peter Hokland, and Maja Ludvigsen designed the research project; Carina A. Rosenberg performed the CFC and IFC experiments; Carina A. Rosenberg and Marianne A. Petersen completed the FACS experiments; Carina A. Rosenberg, Marie Bill, and Orla Maguire conducted the data analyses; Carina A. Rosenberg and Marie Bill wrote the first draft and made the figures; and all authors revised, read, and approved the final manuscript.


