CD180 overexpression in follicular lymphoma is restricted to the lymph node compartment
Abstract
Background
Altered Toll-like receptor (TLR) expression levels and/or mutations in its signaling pathway (such as MyD88 mutation) contribute to the pathogenesis of lymphoproliferative disorders (LPD). CD180 is an orphan member of the TLR family that modulates the signaling of several TLRs, but only limited studies have evaluated its expression by flow cytometry (FCM) in LPD.
Methods
Using a multiparameter FCM approach, we have assessed CD180 mean fluorescence intensity (MFI) in lymph nodes (LNs) and peripheral blood (PB) samples obtained from patients with follicular lymphoma (FL; LN/PB, n = 44/n = 15), chronic lymphocytic leukemia (CLL, n = 26/n = 21), mantle cell lymphoma (MCL, n = 13/n = 17), and marginal zone lymphoma (MZL, n = 16/n = 12). Specimens from non-tumoral PB and LN (n = 8/n = 12) were used as controls.
Results
In the LN specimens, FL and control B-cells showed similar CD180 expression (MFI = 1,049 vs. 1,381, P > 0.05; Mann–Whitney U-test). This level was markedly lower in the other LPDs, MCL (MFI = 396, P < 0.05), or CLL (MFI = 502 P < 0.05), and similar to MZL (MFI = 858, P > 0.05). However, the CD180 expression of FL B-cells assessed in PB was dim and/or negative, in the same range as MCL and CLL (FL MFI = 453, MCL MFI = 305, CLL MFI = 420, P > 0.05) but lower than in MZL (MFI = 895, P < 0.05). Therefore, these results suggest a modulation of CD180 expression by neoplastic FL B-cells based on the anatomical compartment.
Conclusion
These FCM data confirm the usefulness of CD180 in the accurate diagnosis of LPDs and emphasize the need to interpret this marker according to the origin of the sample. © 2015 Clinical Cytometry Society
The contribution of the microenvironment to the pathogenesis of lymphoproliferative disorders (LPDs) is well recognized. Next-generation sequencing studies of LPDs have described several molecular lesions in signaling pathways activated by downstream microenvironmental stimuli, including B-cell receptor (BCR) or Toll-like receptor (TLR) signaling 1. In addition to activating mutations in the MyD88 signaling protein, altered TLR expression levels also suggest a potential role for TLR in oncogenesis. The CD180 molecule, originally identified as Bgp95 in human B cells 2, is an orphan member of the TLR family 3. Although its function has not been completely elucidated, several studies have described its involvement in B-cell proliferation and humoral immune response 4, 5. Moreover, CD180 modulates the ligand-induced activity of TLR2 and TLR4 6 and may positively regulate CD19 signaling in murine models 7. Like many TLRs, CD180 appears to be more highly expressed by memory B cells than naïve B cells 8. Flow cytometry (FCM) analysis of peripheral blood (PB) has reported that the CD180 expression by B-cells in marginal zone lymphoma (MZL) is strong and find a markedly lower CD180 level in other LPDs, including chronic lymphocytic leukemia (CLL) and mantle cell lymphoma (MCL) 9. In lymphoid organs, the expression of CD180 has only been described by immunohistochemistry analysis on lymph node (LN) sections 10.
Gene expression profiling has indicated that FL cells retain features of normal germinal center (GC) B-cells, including dependence on BCR expression and activation, as well as interaction with T- and stromal cells in the follicular microenvironment, partly via the TLR2 pathway 11, 12. TLR2 is highly expressed by centroblasts in reactive GC and in the follicular structure of FL 13, 14. As CD180 is reported as a positive regulator of TLR2 6, TLR/CD180 signaling might contribute to the pathogenesis of FL driven by interaction with the microenvironment. These observations prompted us to study the CD180 expression by FCM in FL cells compared with other LPDs in PB specimens or LN samples.
MATERIALS AND METHODS
Patients and Samples
Ninety-nine LN and 65 PB samples obtained from patients diagnosed with LPDs in our institution between 2012 and 2014 were evaluated for CD180 expression by FCM. The diagnosis were made according to the WHO 2008 classification 11, including clinical and morphological analysis, immunophenotyping, and conventional and molecular cytogenetics (and/or fluorescent in situ hybridization) 15, 16. The diagnoses were follicular lymphoma (FL) (LN, n = 44; PB, n = 15), small lymphocytic lymphoma/chronic lymphocytic leukemia (SLL)/CLL (LN, n = 26; PB, n = 21), MCL (LN, n = 13; PB, n = 17), and MZL (LN, n = 16; PB, n = 12). All PB samples presented circulating neoplastic B-cells, and in several cases, the diagnosis was made at the same time in LN and PB (FL, n = 4; SLL/CLL, n = 18; MCL, n = 5; MZL, n = 6). Suspensions of LN from reactive hyperplasia (n = 8) and PB from healthy donors (n = 12) were used as a control group.
The FL cases (28 men and 16 women) presented with a median age of 58 years (range, 30–91 years). Five patients had anemia (hemoglobin < 120 g/L) and two thrombocytopenia (platelet count < 100 × 109/L). The median lymphocyte count was 1.45 × 10⁹/L (range, 0.53–6.70; two cases with lymphocytes count > 5.00 × 10⁹/L). Circulating FL cells were detected by cytology and immunological analysis in seven cases (one case with lymphocyte count above 5.00 × 10⁹/L). All patients had lymphadenopathy, and nine presented with splenomegaly. The FLIPI score was low (0–1) in seven patients, intermediate 2 in eight, and high (3–4) in 12 patients. Twenty-four cases presented with FL Grade 1 or 2 and 20 with FL Grade 3. The immunological profile by FCM showed strong CD10 expression in all but two cases. The results of t(14;18)(q32:q21) were detected in the 29 available cases on karyotype, including the two CD10-negative cases. An IGH-BCL2 fusion pattern was found by fluorescent in situ hybridization in most tested cases (15 of 17) (Table 1).
| Cases | Histology | Immunology (CD10) | Cytogenetic | |
|---|---|---|---|---|
| t(14;18)(q32;q21) | IGH/BCL2 fusion | |||
| 1 | FL Grade 1–2 | + | No clonal abnormalities | |
| 2 | FL Grade 3A | + | + | + |
| 3 | FL Grade 1–2 | + | + | nd |
| 4 | FL Grade 3A | + | + | + |
| 5 | FL Grade 1–2 | + | + | nd |
| 6 | FL Grade 3B | − | + | + |
| 7 | FL Grade 3A | + | + | nd |
| 8 | FL Grade 3B | + | − | BCL6 |
| 9 | FL Grade 3A | + | nd | nd |
| 10 | FL Grade 3A | + | - | nd |
| 11 | FL Grade 3A | + | + | + |
| 12 | FL Grade 1–2 | + | − | + |
| 13 | FL Grade 1–2 | + | + | nd |
| 14 | FL Grade 1–2 | + | No clonal abnormalities | |
| 15 | FL Grade 3A | + | + | nd |
| 16 | FL Grade 1 | + | nd | nd |
| 17 | FL Grade 3B | + | + | nd |
| 18 | FL Grade 1–2 | + | nd | nd |
| 19 | FL Grade 1–2 | + | + | nd |
| 20 | FL Grade 1–2 | + | nd | nd |
| 21 | FL Grade 1–2 | + | nd | nd |
| 22 | FL Grade 3A | + | + | + |
| 23 | FL Grade 3B | + | nd | nd |
| 24 (LN) | FL Grade 1–2 | + | + | nd |
| 24 (PB) | + | nd | nd | |
| 25 (LN) | FL Grade 3A | + | + | nd |
| 25 (PB) | + | nd | nd | |
| 26 | FL Grade 3A | − | + | + |
| 27 | FL Grade 1 | + | nd | nd |
| 28 (LN) | FL Grade 1–2 | + | + | + |
| 28 (PB) | − | + | nd | |
| 29 (LN) | FL Grade 3A | + | + | + |
| 29 (PB) | − | + | nd | |
| 30 | FL Grade 1–2 | + | + | nd |
| 31 | FL Grade 1–2 | + | + | nd |
| 32 | FL Grade 1–2 | + | + | nd |
| 33 | FL Grade 1–2 | + | nd | nd |
| 34 | FL Grade 1–2 | + | + | nd |
| 35 | FL Grade 1–2 | + | + | nd |
| 36 | FL Grade 1–2 | + | + | + |
| 37 | FL Grade 1–2 | + | + | nd |
| 38 | FL Grade 1–2 | + | − | nd |
| 39 | FL Grade 1–2 | + | + | nd |
| 40 | FL Grade 1–2 | + | + | + |
| 41 | FL Grade 3A | + | + | + |
| 42 | FL Grade 3A | + | nd | nd |
| 43 | FL Grade 3A | + | + | + |
| 44 | FL Grade 1–2 | + | + | + |
- LN = lymph node; PB = peripheral blood; nd = not done.
Immunophenotype Analysis by Flow Cytometry
Using a multiparameter FCM approach, we assessed the CD180 expression by our routine antigen panel in LN suspensions as well as in PB samples 17. Samples were analyzed on a BD FACSCanto II cytometer (BD FACS DIVA software; Becton Dickinson, San Jose, CA). The major antibodies used were as follows: CD19 (SJ25C1, Becton Dickinson; PercPCy5.5), CD5 (BL1a, Beckman-Coulter, Hialeah, FL; PE-Cy7), CD23 (EBVCS-5, Becton Dickinson; APC), FMC7 (FITC, Dako, Carpinteria, CA), CD22 (4KB128, Dako; PE), CD43 (DF-T1, Dako; FITC), CD10 (HI10a, Becton Dickinson; PE-Cy7), CD20 (L27, Becton Dickinson; APC-Cy7), CD38 (HIT2, Dako; PE), and CD180 (G28-8 Becton Dickinson; PE). A marker was considered positive if expressed by 30% or more of the cells 17. The fluorescence level for the different parameters by CD19-positive B-cells was also measured in arbitrary units, such as the mean fluorescence intensity (MFI).
Statistical Analysis
The Mann–Whitney U-test and Spearman test were used to compare the different studied parameters. A P-value below 0.05 was considered significant.
RESULTS
CD180 Expression in LN Suspensions
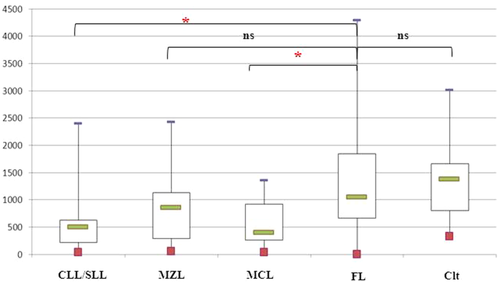
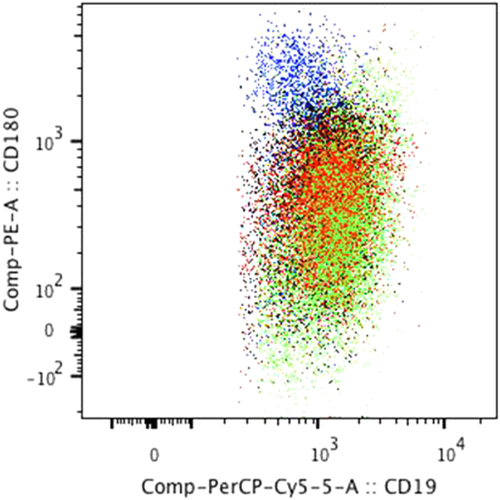
In all LN cases but one, neoplastic B-cells of FL expressed CD180 with an MFI median of 1,049 (range, 147–3,390). This expression was similar to our observations in control B-cells (MFI = 1,381; P = 0.72) or MZL cells (MFI = 858, P = 0.09) but higher than in neoplastic B-cells from MCL (MFI = 396, P < 0.05) or CLL (MFI = 502, P < 0.05) (Table 2, Figs. 1 and 2). The CD180 expression was the same regardless of the histological grading (FL Grade 1/2 MFI = 1,407 vs. FL Grade 3 MFI = 981; P = 0.06), the presence of circulating FL cells (FL with PB dissemination MFI = 900 vs. FL without PB dissemination MFI = 1,106; P = 0.33) or the CD4/CD8 ratio (CD4/CD8 ratio < 4 MFI = 1,121 vs. CD4/CD8 ratio ≥ 4 MFI = 807; P = 0.32).

CD180 expression in lymph node suspensions. The results were expressed as the mean fluorescence intensities (MFIs) obtained directly by the FACSDiva software of the flow cytometer. The box plot shows the median, 25th/75th percentiles, and extreme values. CLL/SLL = chronic lymphocytic leukemia/small lymphocytic leukemia, MZL = splenic marginal zone, MCL = mantle cell lymphoma, FL = follicular lymphoma, and Clt = control B-cells. *Statistically significant difference between FL cases and other LPD cases or controls using the Mann–Whitney test (P < 0.05). [Color figure can be viewed in the online issue, which is available at wileyonlinelibrary.com.]

CD180 expression vs. CD19 expression in lymph node suspensions. Bivariate dot-plot illustrating CD180 expression by CD19 B-cells in different LPD subtypes (merge of all data files): follicular lymphoma (blue) (n = 44), mantle cell lymphoma (red) (n = 13), small lymphocytic lymphoma/chronic lymphocytic leukemia (black) (n = 26), and marginal zone lymphoma (green) (n = 16) obtained by FlowJo software. This dot plot illustrated the higher CD180 and lower CD19 expression of neoplastic FL B-cells compared with neoplastic B-cells of the other LPDs.
| Lymph node suspensions | |||
|---|---|---|---|
| CD180 MFI | CD19 MFI | CD22 MFI | |
| FL (n = 44) | 1,049 (1–4,299) | 913 (231–2,218) | 1,595 (411–6,489) |
| CLL/LL (n = 26) | 502 (46–2,400)a | 1,744 (521–3,108)a | 680 (287–4,466)a |
| MZL (n = 16) | 858 (61–2,426) | 1,776 (832–4,704)a | 2,782 (337–7,071) |
| MCL (n = 13) | 396 (43–1,358)a | 1,501 (764–3,155)a | 1,595 (950–2,803) |
| Controls (n = 8) | 1,381 (331–3,014) | 1,131 (335–2,018) | 3,208 (2,669–4,836)a |
| Peripheral blood samples | |||
| CD180 MFI | |||
| FL (n = 15) | 453 (191–3,070) | ||
| CLL/LL (n = 21) | 420 (39–956) | ||
| MZL (n = 12) | 895 (267–3,236) | ||
| MCL (n = 17) | 305 (132–2,168) | ||
| Controls (n = 12) | 2,983 (637–5,775)a | ||
- FL = follicular lymphoma; CLL/LL = chronic lymphocytic leukemia/lymphocytic lymphoma; MZL = marginal zone lymphoma; MCL = mantle zone lymphoma.
- Results were expressed as MFI (mean fluorescence intensity) of gated B-cell subset (range).
- a Statistically significant difference between FL cases and other LPD cases or controls using the Mann–Whitney test (P < 0.05).
CD180 Expression in PB Samples
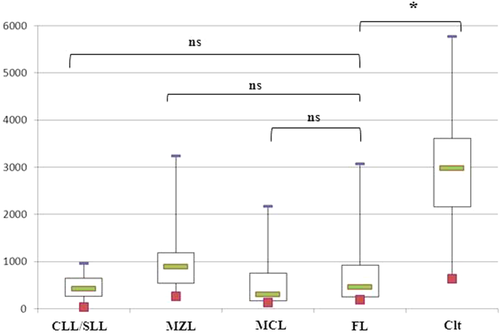
In PB specimens, neoplastic B-cells of FL displayed dim and/or negative CD180 expression, as in CLL and MCL (FL MFI = 453, MCL MFI = 305, and CLL MFI = 420; P = 0.20 and 0.44, respectively). This level of CD180 expression was lower than in the control B-cells (MFI = 2,983; P = 0.01) and MZL (MFI = 858 P = 0.09) (Table 2, Fig. 3). The down-regulation of CD180 expression by circulating FL-cells was confirmed in three of the four cases of FL samples examined at the same time in LN and PB (Fig. 4). This phenomenon seems restricted to FL, as no modulation of CD180 expression between blood and LN compartment was observed in other LPDs (MCL, n = 5; MZL, n = 6; and SLL, n = 18; Fig. 4).

CD180 expression in peripheral blood specimens. The results were expressed as the mean fluorescence intensities (MFIs) obtained directly by the FACSDiva software of the flow cytometer. The box plot shows the median, 25th/75th percentiles, and extreme values. CLL/SLL = chronic lymphocytic leukemia/small lymphocytic leukemia, MZL = splenic marginal zone, MCL = mantle cell lymphoma, FL = follicular lymphoma, and Clt = control B-cells. *Statistically significant difference between FL cases and other LPD cases or controls using the Mann–Whitney test (P < 0.05). [Color figure can be viewed in the online issue, which is available at wileyonlinelibrary.com.]

Differential CD180 expression according to the anatomical site. Flow cytometry histogram of CD180 obtained in peripheral blood (PB, white) and lymph node (LN, dark) samples from follicular lymphoma (blue), small lymphocytic lymphoma/chronic lymphocytic leukemia (black), marginal zone lymphoma (green), and mantle cell lymphoma (red). Only one informative pair for each of the entities has been represented.
CD19 and CD22 Expression in LN Suspensions
We also assessed the CD19 and CD22 expression in neoplastic B-cells because they were reported as being positive and negative regulators of BCR signaling, respectively, and also because positive regulation of CD19 signaling by CD180 has been described 7.
In LN specimens, CD19 expression by neoplastic FL B-cells was similar to control B-cells (MFI = 913 vs. MFI = 1,131; P = 0.59), but lower than B-cells of other LPDs (MCL MFI = 1,501, CLL MFI = 1,744, and MZL MFI = 1,776; P = 0.01; Fig. 2). The B-cells of FL expressed CD22 with the same intensities as B-cells of MCL or MZL (MFI = 1,595 vs. MFI = 1,595 and MFI = 2,782, respectively), but CD22 expression was lower than in control B-cells (MFI = 3,208; P = 0.01) and higher than in CLL B-cells (MFI = 680; P = 0.01) (Table 2). In this FL series, CD180 expression was not correlated with CD19 or CD22 expression (P = 0.93 and 0.07, respectively; data not shown).
DISCUSSION
This study confirms the relevance of CD180 expression in LPD diagnosis. As previously reported in PB compartment, we observed higher levels of CD180 expression in MZL 9, and for the first time, we describe the high expression of CD180 by neoplastic FL cells when they reside in the LNs. Accordingly, the use of CD180 as a diagnostic marker should consider the origin of the sample.
This observation is also interesting with regard to the development and progression of FL, which involve complex interactions between neoplastic B-cells and the microenvironment 12. As the expression of the CD180 may support interaction between lymphoma cells and their microenvironment, our findings suggest that this TLR member could potentially be playing a role in FL pathogenesis. FL is a mature lymphoma derived from GC B-cells that retain many of the morphological and immunophenotypic features of their normal counterparts 11. As TLR2 signaling has been reported to induce the formation of GC 13 and as CD180 is reported as a positive regulator of TLR2 6, TLR/CD180 signaling may contribute to the development of the specific histological features of FL that mimic GC formation. Moreover, CD180 has been reported as a positive regulator of CD19, involved in BCR signaling 7. Accordingly, the expression of CD19 is conserved by neoplastic FL B-cells, whereas the expression of the negative BCR regulator CD22 is down-regulated 18. These results are consistent with the importance of BCR signaling in FL pathogenesis and suggest a significant overlap between the TLR and BCR pathways. Thus, the TLR/CD180 pathway and its interaction with CD19 signaling could be involved in the enhanced BCR activity via the tyrosine kinase Syk described in FL 19. As it has now been well established that the tumor microenvironment is implicated in FL prognostics, CD180 expression might also contribute to LF progression 12. Here, CD180 expression by neoplastic FL B-cells in LN suspension was not correlated with any studied prognostic factor, but further studies with long-term follow-up of prospective cohorts will be required to answer this question.
FCM methodology with appropriate gating is a highly sensitive and specific approach that provides relevant information for the diagnosis, classification, and monitoring of leukemia/lymphoma and has acquired a prominent position in the current WHO classification 11. However, immunophenotyping requires the careful selection of combinations of individual markers based on the degree of specificity for the identification of a given cell lineage, maturation stage, and aberrant phenotype. The performance of the marker combinations is even more relevant than any single marker. Scoring systems of marker combinations have been proposed in the literature to improve the differential diagnosis of LPDs 20, 21. The data presented here emphasize that the potential modulation of the expression of specific markers according to the anatomical site must be explored before retaining them as specific markers. Indeed, although CD180 expression by neoplastic B-cells has been reported to be discriminative for MZL diagnosis in PB 9, these data demonstrate that it cannot be used in the LN compartment because its expression is also elevated in neoplastic FL B-cells. Nevertheless, the CD19/CD180 combination appears useful because of the significantly different CD19 expression between the two entities.
In conclusion, this study expands the understanding of CD180 expression in LPDs, giving further support for the inclusion of this marker in FCM panels for the differential diagnosis of LPDs. These observations also underline the influence of the microenvironment on the modulation of antigen expression, which may represent a pitfall in accurate LPD diagnosis.


