Imaging Flow Cytometry for Phylogenetic and MorphologicallyBased Functional Group Clustering of a Natural Phytoplankton Community over 1 Year in an Urban Pond
Abstract
Ponds are an insufficiently studied research object but represent a biodiversity hotspot and have a high value for ecosystem services like recreation, water retention, or angling. Especially urban ponds create a direct contact for citizens experiencing nature. But on the other side, these systems also suffer from several pressures caused by humans, for example, high nutrient and salt influxes or high temperatures. Phytoplankton organisms are a crucial part of ponds ecosystem and an understanding of community composition is crucial especially when eutrophication and high temperatures lead to dominance of unpleasant toxic cyanobacteria. With traditional microscopic methods for phytoplankton analysis, monitoring is not feasible with high spatial resolution and frequency. Therefore, a new approach of imaging flow cytometry to classify phytoplankton species in either taxonomic or morphologically based functional groups (MBFGs) is suggested. In this study, both classifications could be successfully applied to a natural phytoplankton community in an urban pond in Leipzig with minor modifications. Both classifications in combination provide a good mechanistic understanding of phytoplankton community dynamics. In addition, a great advantage of the measurements is the archivability of microscopic images allowing a comprehensive respective data analysis. Two examples of detailed trait and image analysis are demonstrated to investigate single-cell traits for cyanobacteria and chlorophytes/euglenophytes and to follow the fate of a cyanobacterial bloom affected by a fungal infection. © 2020 The Author. Cytometry Part A published by Wiley Periodicals, Inc. on behalf of International Society for Advancement of Cytometry.
Ponds in urban areas are direct ways of experiencing nature in form of recreation, bathing or fishery. Ponds as small water bodies with an approximate size of <5 ha (1, 2) are a diverse group of habitats from garden to ornamental or industrial ponds (2). It is estimated that millions of small ponds exist worldwide and that their total role in global biochemical cycles could be similarly important compared to large lakes (3). They are known to contain a high source of biodiversity (2-6) and are considered as an important link (stepping stone) between different aquatic habitats (5, 2). However, their relevance for maintaining species diversity is currently not acknowledged by binding regulations or global protection strategies (5, 6). Urban ponds in larger cities close to city centers are mostly of artificial structure, for example, in parks as landscape design elements. Their ecosystem structure and service in comparison to natural ponds is controversially discussed (2, 7). But water retention, cooling effects, fishery, and recreational ecosystem services are similarly applicable to artificial urban ponds. A specificity of ponds in urban areas is that they face several strong pressures, including habitat degradation, invasive species (2), high temperatures, eutrophication (8, 9), and road salts (10) by run-offs. Despite the value of ponds for biodiversity, stressors of these ecosystems could lead to destabilizing effects and potentially result in blooms of toxic phytoplankton species, like cyanobacteria. The high dominance of unpleasant taxa can counteract the societal need for a good water quality and pose serious health risks for citizens and pets (11, 12). As Waajen et al. (12) point out that monitoring of phytoplankton composition is a crucial aspect in reducing health risks for citizens using those urban ponds for recreation or fishery. In contrast to small water bodies, large water bodies with a size of >50 ha need to be regularly monitored by authorities in Europe according to the European Water Framework Directive (2000/60/EC). This means that sampling needs to take place six times a year during the vegetation period. Water will be analyzed chemically (nutrients, 45 priority chemicals as mercury or TBT, pH, oxygen concentration), physically (temperature, secchi depth) and biologically (flora [phytoplankton, macrophytes, phytobenthos] and fauna [macrozoobenthos, fishes]). Phytoplankton analysis as part of the biological quality component is performed with concentrated water samples via microscopy by a taxonomic expert, resulting in a species list. These kinds of analyses are simply not feasible for a high number of small ponds with respect to analysis time and costs. Therefore, investigation of phytoplankton ecology and intensive monitoring in urban ponds requires new tools for phytoplankton analysis. Measurements of remote sensing or fluorescent probes allow to get an estimate about the abundance of some taxonomic groups, for example, cyanobacteria or green algae, but do not provide detailed information about species composition, although this is a crucial information especially with respect to toxic species. Flow cytometry detects individual cells with high throughput. In the study by Dunker (13), laboratory grown phytoplankton were separated into taxonomic groups based on different pigmentation patterns using a special-order imaging cytometer. At the same time, brightfield and fluorescence images of every individual particles are captured, allowing to derive detailed single cell characteristics (traits) and to identify species (14).
Prediction of phytoplankton community composition is an important part of water quality management. There are different attempts to cluster species either according to phylogeny (15) or functional polyphyletic classifications (16-19) in order to better understand phytoplankton community composition. In a comprehensive study by Kruk et al. (20) including 211 lakes worldwide it was shown that the morphologically based functional classification (MBFG) by Kruk et al. (19) was best suited to predict phytoplankton community composition from environmental conditions in comparison to phylogenetic or functional group classifications (17, 21). The MBFG approach distinguishes seven different groups based on the morphological features volume, surface-to-volume ratio (S/V), longest axial distance, aerotopes, flagella, mucilage, heterocysts and siliceous exoskeletal structures. With these features functional groups are defined as “small organisms with high S/V" (MBFG I), “small flagellated organisms with siliceous exoskeletal structures” (MBFG II), “large filaments with aerotopes” (MBFG III), “organisms of medium size lacking specialized traits” (MBFG IV), “unicellular flagellates of medium to large size” (MBFG V), “non-flagellated organisms with siliceous exoskeletons” (MBFG VI), and “large mucilaginous colonies” (MBFG VII). Several authors applied the concept of MBFG as an effective tool to predict phytoplankton community from environmental variables (22-25). But there is also an example (26) showing that species-based classification was better suited for prediction of spatial processes in three freshwater lake regions in China.
In this study, I present how useful a special imaging flow cytometer configuration is to (1) perform high-frequency analyses of natural phytoplankton community dynamics, (2) derive phylogenetic classification and (3) classify morphologically based functional groups, and (4) perform functional trait and image analysis.
Materials and Methods
Field samples were taken from Bruckner Bassin (Leipzig, Germany, 51.3317° N/ 12.3595° E). The basin with a surface of 0.59 ha and a sandy ground is situated in a local recreation park close to the city center of Leipzig (Germany) and has been constructed for the Saxon-Thuringian Industrial and Commercial Exhibition in 1897. The pond is equipped with a water fountain running from spring to autumn. The park is an angling water and fish species like Anguilla anguilla, Esox lucius, Cyprinus carpio, Tinca tinca as well as white fish were reported to occur there (http://www.angelatlas-sachsen.de/#L10-133).
From March 2017 until March 2018, 50 ml of a water surface sample was collected 17 times. Only one sample was taken at the sampling point on each sampling day and some small-scale variability of the samples depending on the sampling point may be present. However, an attempt was made to consider the variability with regard to the time of day by always taking samples at a comparable time (around 08:00 a.m.). The frequency of sampling was adapted to the intensity of phytoplankton growth, meaning that during colder season and lower phytoplankton growth activity less samples were taken and vice versa. All samples were cooled for transport, prefiltered (CellTrics, Sysmex, Norderstedt, Germany) with 100 μm. The filtration size is a trade-off between exclusion of grazers, especially smaller copepods and of large phytoplankton species. For example, mesozooplankton was sampled with mesh sizes of 50 μm (27) and Hopcraft et al. (28) reported ta plankton net with 200 μm size missed half of the annual copepod biomass. Some large phytoplankton species (>100 μm, colonies and long-chains) are excluded from analysis by applying the filtration step. Their quantity was not subject of this study.
Cell concentrations were sufficiently high for all samples to be measured directly without concentration steps.
Flow Cytometric Measurements
The flow cytometric measurements were previously reported by Dunker (13). Briefly, the different samples were measured vital and unfixed shortly after sampling with a special order ImageStream®X Mk II (Luminex, Austin). The ImageStream®X Mk II was equipped with a 488 nm laser (200 mW), a 561 nm laser (200 mW), and a 785 nm laser (80 mW).
Red fluorescence was measured, excited by blue light (488 nm Ex/ 702/85 nm Em) or green light (561 nm Ex/ 702/85 nm Em). The excitation of either 488 nm or 561 nm excites pigments which efficiently transfer light energy to Chl a (29), resulting in a red fluorescence, mainly from Chlorophyll a (Chl a). Depending on the phytoplankton groups, phycobilin-containing species, like cyanobacteria and cryptophytes (both containing phycoerythrin/phycocyanin in variable amounts) will show a reliable high red fluorescence signal when excited with green light in contrast to nonphycobilin-containing species like chlorophytes/euglenophytes and Chl c/fucoxanthin-containing heterokontophytes/Chl c/peridinin-containing dinophytes (29). Based on their similar pigmentation, chlorophytes and euglenophytes cannot be further taxonomically separated by their fluorescence pattern. This applies for Chl c/fucoxanthin-containing chrysophytes, bacillariophytes and Chl c/peridinin-containing dinophytes, too.
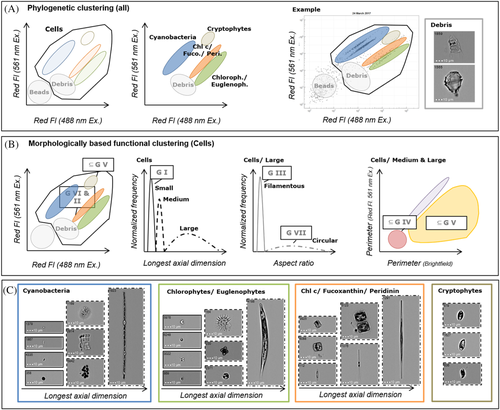
The ImageStream®X Mk II was equipped with a two CCD-camera-system and three interchangeable microscope objectives with 20× magnification (0.5 NA), 40× magnification (0.75 NA), and 60× magnification (0.9 NA). For the comparative measurement of this study only 40× magnification with a 60 × 256 μm field of view was used. The laser configuration is unique and especially adapted to the measurement of phytoplankton cells (patent submission WO 2019/068352 A 1). This requires a non-co-linear spatial arrangement of the two lasers (488 nm and 561 nm laser) on two different CCD-cameras to enable the simultaneous measurement of fluorescence emissions of an identical cell. This special configuration allows phylogenetic clustering based on differences in the pigmentation and respective autofluorescence of the species and a morphologically based functional clustering according to Kruk et al. (19) with morphological information derived from brightfield and fluorescence images.
For each measurement, 50–100 μl of samples were used. If sample concentration was high enough, 5,000 events or alternatively, if sample concentration was low, samples were analyzed for a maximum of 20 min. As sheath-fluid Dulbecco's phosphate buffered saline w/o calcium, w/o magnesium (Biowest, Nuaillé, France) was used.
Data Analysis
Most data analysis was performed with the IDEAS-Software (Amnis part of Luminex, Texas, Austin) with the software version 6.2.187.0. This software allowed gating and particle quantification according to the template as shown in Figure 1, but also morphological image analysis for exemplary traits, for example, longest axial diameter (length), aspect ratio, and perimeter. These features were extracted by automatic object recognition tools in the software, mainly including the masks “Adaptive Erode 75” and “Object, Tight.” Bivariate plots for Supporting Information Figure S2 were created with the following R software packages: ggplot2 (Wickham 2016), gridExtra (Auguie 2017), scales (Wickham 2018), viridis (Garnier 2018) and ggpointdensity (Kremer and Anders 2019).
Comparative CountCheck-Beads Test
For testing the quantification of particles with the ImageStream®X Mk II in comparison to microscopy, a comparative analysis was conducted. Therefore CountCheck-Beads (Sysmex, Norderstedt, Germany) with a particle concentration of 22,590 beads ml−1 (±2,259) were counted microscopically with a Zeiss Axioplane microscope (40× magnification) in a Bürker-chamber and with the ImageStream®X Mk II. Triplicate measurements were performed for both methods (microscopy and imaging flow cytometry) for a comparable number of particles (~500 particles).
Results
Application of Imaging Flow Cytometry for Analysis of Natural Phytoplankton Communities
The phylogenetic and morphologically clustering is represented in Figure 1. For all gating steps and the respective group assignment (phylogenetic and morphological groups) manual inspection of images for all sampling time points was performed to optimize gating. The phylogenetic clustering (Fig. 1A) takes advantage of taxon-specific pigment composition by red fluorescence emission excited with two different lasers. An example for phylogenetic group assignment is indicated in Figure 1A and outlined in detail by Dunker (13). Briefly, phycobilin-containing species like cyanobacteria and cryptophytes show higher red fluorescence signals with 561 nm excitation, while Chl c and fucoxanthin−/peridinin-containing species of the brown spectral group (bacillariophytes, chrysophytes, dinophytes) and the green spectral group (chlorophytes and euglenophytes) show a lower red emission. Calibration beads (Speed beads, Amnis part of Luminex, Texas, Austin) could be well separated from phytoplankton cells (“Cells”) due to minimal fluorescence. A high fraction of calibration beads was not measured, based on a threshold values on cell area and Chl a fluorescence intensity. A small fraction of beads and other indefinite small particles still remained (summarized as bead fraction). Debris could be similarly distinguished from cells by lower fluorescence than vital cells and slightly higher fluorescence than the beads.
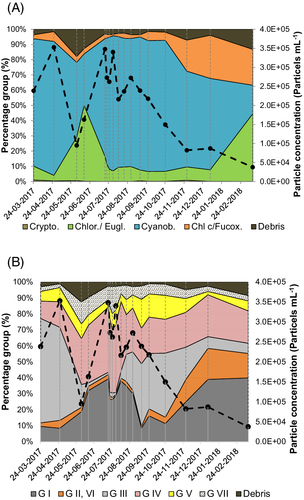
Throughout the whole sampling period cyanobacteria and the green group were abundant, albeit in varying quantities. Based on particle concentration, cyanobacteria were dominant in most of the samples (Figs. 2A and 3). Some exceptions were 14 June 2017 and 15 March 2018 with a dominance of chlorophytes/euglenophytes. The debris fraction was highest in the beginning of June and at the end of November. Cryptophytes were only present in high abundances in March 2017.
For morphologically based functional clustering (Fig. 1B), phylogenetic clustering is the first step to assign cryptophytes to MBFG V (unicellular flagellates of medium to large size) and Chl c/fucoxanthin-containing species to MBFG VI (nonflagellated organisms with siliceous exoskeletons) and MBFG II (small flagellated organisms with siliceous exoskeletal structures). For the other groups size clustering for small (MBFG I, small organisms with high S/V), medium and large cells have been performed based on longest axial dimension. For large cells filamentous species (MBFG III) and large colonies (MBFG VII) could be separated based on their aspect ratio (width/ height). A subset of MBFG IV and MBFG V was defined on the differences of perimeter of the brightfield image object and perimeter of the red fluorescence image object (Supporting Information Fig. S2). A higher perimeter of the brightfield object in comparison to perimeter of the red fluorescence image (Supporting Information Fig. S2) is indicative for a shape with protuberances like spines, bristles or flagella which have functional relevance for grazing resistance (30), buoyancy (31) or active movement (32). The subset of medium and large cells with a higher brightfield perimeter in comparison to red fluorescence perimeter has been assigned to group MBFG V and medium and large cells with a similar brightfield perimeter in comparison to red fluorescence perimeter to MBFG IV. The exemplary images of phytoplankton species in Figure 1C give an impression of the respective group assignment. In addition to these exemplary images, it is possible to create image-based plots, as described in the study by Dunker et al. (13), replacing all dots by the respective image.
Based on the flow cytometric measurements shown in Supporting Information Figure S2 and the scheme for taxonomic as well as functional group assignment in Figure 1, phytoplankton community composition could be derived for both classifications (Figs. 2 and 3). In Figures 2A and 3, illustrating the phylogenetic classification, it becomes clear, that the basin is dominated by cyanobacteria the whole year, but with varying abundance. Figure 2A does allow functional conclusions only at a limited extent, as cyanobacteria comprise a high morphological diversity. In contrast, Figure 2B reveals that during spring and autumn there was a high proportion of large filamentous species (MBFG III), while in summer small (MBFG I, II) and medium species (MBFG IV, V) had higher proportion, where chlorophytes/euglenophytes were more abundant. During autumn and winter more balanced proportion of Chl c/fucoxanthin-containing species as well as chlorophytes/euglenophytes was obvious, which is consistent with a balanced proportion of MBFGs I, II/VI, III, IV, V, and VII.
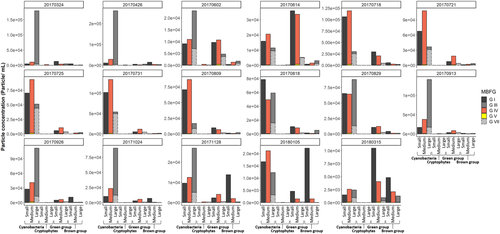
As a synthesis of both phylogenetic and morphological group assignment, Figure 3 reveals particle concentrations for five different morphological groups (MBFG I, III, IV, V, and VII) separated in size classes (small, medium, large) and assigned to phylogenetic groups (cyanobacteria, cryptophytes, green [chlorophytes and euglenophytes] and brown group [bacillariophytes, chrysophytes, dinophytes]) of all sampling timepoints. In Figure 3, it becomes obvious that in spring cyanobacteria comprise the largest particle fraction of filamentous species (MBFG III). These filamentous cyanobacteria are more and more replaced by smaller (MBFG I) and medium-sized (MBFG IV) cyanobacteria and green algae species with the beginning of summer. In August, some large filamentous and colonial cyanobacteria get more abundant again and comprise the largest particle fraction until November.
Functional Trait and Image Analysis
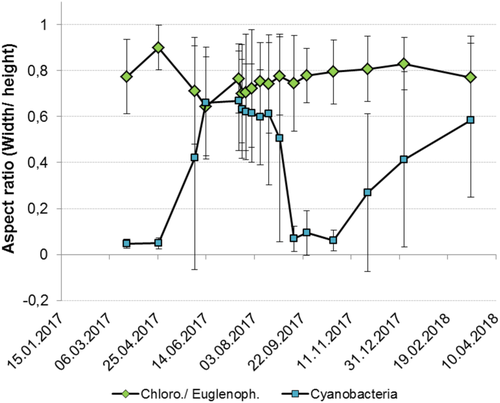
The morphological data derived from image analysis do not only allow to assign species to different MBFGs but also to perform a more detailed analysis of individual single particle traits and their respective variation on phylogenetic group level. As one example, the median single particle aspect ratio has been investigated for the two major taxonomic groups cyanobacteria and chlorophytes/euglenophytes throughout the whole sampling period (Fig. 4). It becomes obvious that species of both different phylogenetic groups show a different aspect ratio and different dynamics throughout the year. While measured chlorophyte/euglenophyte species generally tend to have high aspect ratio, meaning a rather round shape, cyanobacteria species showed a lower aspect ratio, indicating a less round shape. Chlorophytes/euglenophytes showed a relatively similar median aspect ratio and median absolute deviation (MAD) over time in contrast to cyanobacteria. Especially in spring and autumn, the median aspect ratio of total cyanobacteria population was close to zero. This is in line with a high proportion of filamentous species (MBFG III). The low MAD in spring is an indicator that almost no other shapes were present in the group of cyanobacteria. On 2 June, a higher aspect ratio and high MAD of cyanobacteria mirrors, the decline in filamentous species and a higher proportion of round shapes (MBFG I, II/VI, IV, V and VII). During summer, the median aspect ratio and MAD of cyanobacteria stayed stable, which is consistent with the stability of MBFG composition during that time. Based on high MAD, a high variability of shapes can be assumed for cyanobacteria during autumn and winter with a tendency to increase the aspect ratio toward spring.
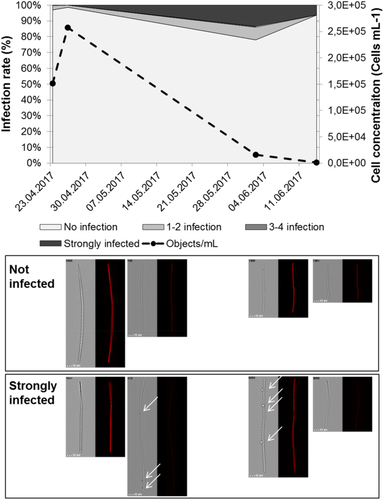
Besides morphological trait analysis, images provide additional details. As one example, fungal infections of Pseudanabaena limnetica (filamentous cyanobacteria [MBFG III]) have been manually recorded from all images starting from initial bloom conditions (24 March 2017), bloom peak (26 April 2017), and bloom collapse (2 and 14 June 2017) (Fig. 5). Bloom dynamics are derived from P. limnetica cell concentrations. Under initial bloom and bloom conditions, the highest proportions of no or moderate (1–2) infections occurred. Bloom collapse went along with increased proportion of moderate and strongly infected cells until almost total reduction of cell concentration and a stronger fragmentation of filaments.
Discussion
Application of Imaging Flow Cytometry for Analysis of Natural Phytoplankton Communities
Over a whole year, it could be demonstrated that frequent sampling and phytoplankton analysis were feasible for a small urban pond. Based on a comparative measurement of Count Check Beads with microscopy and imaging flow cytometry (ImageStream®X Mk II - ISX), it can be assumed that quantitative results of particle concentration in this study should be comparable to a microscopic analysis (Supporting Information Fig. S3). This needs to be verified for natural samples in more detail in further studies and was not the focus of the study. More generally, the flow cytometric setup was tested in this study to investigate the phytoplankton dynamics of community composition over time. According to the author's knowledge, the current study is the first to show the imaging flow cytometry with the ImageStream®X Mk II for a comprehensive analysis of a natural phytoplankton community. The seasonal succession of phytoplankton dynamics in this study can be generally well described with the phytoplankton ecology group (PEG) model of Sommer et al. (33, 34). In this model, a biomass peak occurs in eutrophic waters in spring as light and nutrient availability induce growth. This is followed by a “clear water” equilibrium phase due to herbivorous zooplankton grazing. After food limitation and grazing pressure on zooplankton, a new phytoplankton biomass peak is possible and subsequent biomass decline is related to grazing pressure again, but also nutrient limitation and lower light availability. In principal, this scheme can be also observed in the artificial basin, where three biomass peaks (related to objects/mL) can be observed. A “clear water” phase at the beginning of June is quite pronounced. This is surprising as based on the water use for fishery a high fish stock could be assumed which has an impact on grazing pressure for large zooplankton (27) capable of otherwise control for large-sized cyanobacterial species (35).
Phylogenetic and Morphologically Based Functional Groups
The flow cytometric pattern of a natural phytoplankton community (Supporting Information Fig. S1) could be translated into phylogenetic (Fig. 2A) and morphologically based functional groups (Fig. 2B/Fig. 3), based on autofluorescence signals (phylogenetic) and brightfield/ red fluorescence images (MGFG). Using these high-throughput techniques allows for easy and rapid phylogenetic and morphological phytoplankton analysis; an important step for the functional understanding of phytoplankton composition.
In early spring, a dominance of mainly filamentous cyanobacteria species (MBFG III) was observed. This could be connected with their adaptiveness to low light availability in early spring (Supporting Information Fig. S4) (19, 36). After the decline of those filamentous species, small species with high S/V (MBFG I) increase in quantity, which could be explained by their ability to grow fast and rapidly recover from intense grazing (19). In parallel to the increase of MBFG I, large mucilaginous colonies of Microcystis wesenbergii as potential toxic species and Merismopedia sp. (MBFG VII) develop. Their buoyant properties are useful when light penetration declines over the summer due to high biomass. They are assumed to be sensitive to low resource supply which probably increases over the summer (19). At the same time, chlorophytes/euglenophytes become present at the beginning of June with a high proportion of cells with a medium size, lacking specialized traits (MBFG IV). These species are associated with high grazing losses, as they have small to medium size (19). This pattern of community assembly of large cyanobacteria colonies (MBFG VII), small (MBFG I) and small/medium species without specialized traits (MBFG IV) stays relatively stable during the whole summer with a small interruption in the mid of July influenced by a slight increase in MBFG VII. The coexistence of these functionally different groups including r- and K-strategists could be related to the fact that this season is characterized by highest productivity and less pronounced light limitation and maybe a high variability between clear and turbid states occurred, like it is common for flat water bodies (37).
A high precipitation event around the first sampling in August (Supporting Information Fig. S5) could have been relevant for decline in particle concentration due to dilution effects but also for shifts in MBFGs. This is quite interesting as there seems to be almost no change of community composition based on the phylogenetic classification. From Figure 2B and Figure 3, it becomes obvious that there is again an increase of filamentous species (MBFG III), for example, Anabaena sp., meaning a functional shift of species within the phylogenetic group cyanobacteria. Maybe the preference of filamentous species is again an adaptation to lower light availability which results from biomass accumulation during summer and reduced sunshine duration (Supporting Information Fig. S4). After that period, proportion of small species (MBFG I) and MBFG (II, VI) increase during autumn and winter with low total particle concentration while at the same time phylogenetic analysis indicates that cyanobacteria dominance will be replaced by chlorophytes/euglenophytes, as well as Chl c/fucoxanthin-containing species abundance. Due to light limitation and grazing pressure, a low net primary production can be expected in autumn and winter, resulting in this low particle concentration (33). Interestingly, the phytoplankton composition and total particle concentration in the following spring (2018) is different from the year before. Instead of a dominance of filamentous cyanobacteria, a more balanced proportion of chlorophytes/euglenophytes, Chl c/fucoxanthin-containing species and cyanobacteria occur, with a higher proportion of small species with high S/V (MBFG I) and similar proportion of MBFG II, III, IV, V, VI, and VII. This finding underlines the importance of a regular monitoring of waters, as the dynamic of phytoplankton community composition is not simply repetitive every year. In addition, as phytoplankton species are by definition free-floating organisms, it can be assumed that the organisms are not homogeneously distributed over the water body but vary in their abundance on a small scale. This needs to be also considered when interpreting the results of this study, keeping in mind that differences in community composition could also be partially influenced by small-scale heterogeneity. But especially the high throughput of the method presented could be helpful in upcoming studies to better assess small-scale spatial variability. In future studies, water chemistry could be also valuable to be included as environmental variables explaining or predicting phytoplankton community composition/MBFGs like presented by Kruk et al. (20). The presence of small species (MBFG I), Microcystis colonies (MBFG VII) and large filamentous cyanobacteria (MBFG III) derived from flow cytometric measurements is an indicator that the instrument is useful to account for a large species size range from 1- up to ~100 μm (colonies)/250 μm (filaments) and herewith to monitor natural phytoplankton samples. Nevertheless, it would be important in further studies to quantify the filtration effects with an independent method, for example, Chl a-concentration, as colonies larger than ~100 μm and filaments larger than ~250 μm would be currently not included due to the necessity of a filtration step. This larger size fraction could be quantified by traditional microscopy or image analysis, as these cells or colonies could be easily identified and enumerated. Nevertheless, it would be also advisable to apply suitable methods to count individual cells from colonies, for example, via sonication (38, 39) and by that avoid potential problems related to large cell sizes. However, by using approaches to separate single cells, it needs to be kept in mind that the ecological relevant phenotype would be modified and therefore critical for morphological based classification shown in this work.
Imaging cytometry could be also ideal to extract biovolume as a better indicator for biomass instead of particle or Chl a concentration, but a challenge for that is, that cell morphology of phytoplankton is very diverse. A promising approach to solve this problem and avoid the use of shape-specific formulas is presented by Moberg and Sosik (40) by creating a pixel distance map from 2D microscopic images and converting these distance maps in cell volume predictions.
The MBFG classification of Kruk et al. (19) could be transferred to imaging flow cytometry data best for small organisms (MBFG I), filamentous species (MBFG III) and large mucilaginous colonies (MBFG VII). As chrysophytes (MBFG II) and bacillariophytes (MBFG VI) have a similar pigment composition, their differentiation was not possible. Therefore, MBFG II and VI were grouped together in this study, which is acceptable as the absolute particle concentration of both taxonomic groups was never high in the Bruckner Bassin during sampling period. Maybe the differentiation of both taxonomic groups is possible with automatic species recognition by deep learning as presented by Dunker et al. (14). But for that a respective comprehensive database is required to be usefully applied to natural communities. In addition, species recognition would be helpful to separate organisms of medium sized species lacking specialized traits (MBFG IV) and unicellular flagellates of medium to large size (MBFG V). As an alternative to the group definition by Kruk et al. (19), the differences of both groups have been defined by perimeter difference of brightfield and red fluorescence images, which provides a broader classification of species containing protuberances, spines or flagella and species lacking those. This differentiation should have similar functional meaning than MBFGs according to Kruk et al. (19), as protuberances, spines or flagella reduce the probabilities for high losses by or sinking. Morphological features like cellular protuberances and siliceous structures could not be deduced directly from the images. However, a comparable approach could be suggested by considering perimeter of brightfield in relation to the perimeter of the red fluorescence images. This alternative approach allowed to distinguish between compact cells without and cells with more pronounced larger cellular protuberances (MBFG IV and MBFG V), for example, spines (Supporting Information Fig. S2). In future studies, it needs to be tested with laboratory grown siliceous and nonsiliceous species, if the sideward scatter images or signals could be used for differentiation of these cell types.
In several studies, the concept of functional groups was applied to natural phytoplankton communities (22-25, 32, 41). In all these studies, phytoplankton species were first identified and subsequently assigned to one of the functional groups, for example, MBFGs. Species identification for the sole purpose of determining morphological groups can be considered a detour. In comparison, the approach presented in this study allows a direct determination of morphological group classification. A general advantage of MBFGs in comparison to other functional classifications, for example, classification by physiological traits (16) which are difficult if not impossible to extract from field samples, is that they can be much easier assessed from morphological features and without detailed taxonomic knowledge (19, 42). The flow cytometric approach opens up the possibility for the first time, that MBFGs can be directly extracted from high-throughput measurements allowing a better understanding for phytoplankton dynamics without detailed knowledge of the species. However, determining species identity provides equally important information (43). Each species has an evolutionary justification to exist and therefore a unique combination of certain traits. It is not without reason that regular monitoring is based on the indicator species concept, considering the unique habitat requirements of a certain species. There is the risk of functional classifications that many species appear to be redundant (43). Further development work toward automated species identification using imaging flow cytometry and deep learning could enable simultaneous phylogenetic and functional morphological group assignment in addition to species identification alone. A first proof-of-principle shows promising results (14) but needs further work to be applicable for complex natural phytoplankton communities, as demonstrated in a comprehensive approach of Sosik and Olson (44) for marine species.
Functional Trait and Image Analysis
Besides phylogenetic and MBFG assignment based on fluorescence signals and morphological details of the images taken, the images itself bear further relevant information. Only two examples were selected to demonstrate the information content of the images. But it can be assumed with certainty that there is much more potential to exploit the whole data set for relevant information.
Shape and more specifically the aspect ratio (width/height) has several relevant implications for resource acquisition and predator avoidance (16), optical properties (45) and light absorption, but also for grazing and sinking speed (46). The distortion from spherical shape results in a greater surface area to an unchanged volume, increasing nutrient uptake and light absorption as well as reduction of sedimentation rates (46). Tolerance of filaments for low light availability in spring and autumn (Supporting Information Fig. S4) could be responsible for the preference of a low aspect ratio (19) of cyanobacterial shape during this time. Sinking velocity is assumed to have only minor relevance in the shallow basin investigated. An additional explanation for filamentous cyanobacteria dominance in spring and autumn could be a selective advantage for prevention of ingestion by grazers, but it is believed that zooplankton biomass is strongly top-down regulated by high fish stocks (angling water) and low zooplankton activity during that time results from low temperatures (5–10°C) (Supporting Information Fig. S6). Chlorophytes/euglenophytes were shown to have a more spherical shape throughout the whole year but maybe this could be a reason for their low abundances associated with lower competitiveness in low light conditions and a higher grazing potential.
An additional example of exploiting the information content of the images was presented by fungal infections of Pseudanabaena limnetica. The collapse of early spring phytoplankton biomass is frequently associated with the increase of grazing activity, resulting in a “clear water” stage (33, 34). But another explanation for cyanobacterial decline in our study is the occurrence of Chytridiomycota (47-49). Gerphagnon et al. (47) demonstrated the cyanobacterial bloom decline by infections of Chytridyomycota in the field. In the actual study, similarities with these findings (Fig. 5) can be seen. A maximal infection rate of 28% was determined on 02 June 2017 from the brightfield images collected with the imaging flow cytometer, while in the study of Gerphagnon et al. (47) an infection rate of 6% was stated. Fungal infections were described by the authors to induce mechanic fragmentation of filaments which was also observed in our study by a reduction of filament size on 14 June 2017 from ~100 μm (23 March, 26 April, 2 June) to 62 μm and a high debris fraction. The images taken during the measurements and archived for every individual particle add further value, especially for different retrospective analyses. The selected example shows nicely that the method makes it possible to follow the fate of individual species, enabling a better process understanding, which is crucial for management. It is also promising for modeling approaches by enabling modeler to describe trophic interaction and loss rates in more quantitative terms.
Conclusion and Outlook
The value for biodiversity conservation, increasing pressures, relevance for health of citizens and easy accessibility make urban ponds a relevant model system to study. Imaging flow cytometry could be demonstrated to be a valuable tool to study phytoplankton dynamics in high detail in this system. Ideally, the imaging flow cytometric approach would reveal species identity via deep learning, species quantity, and biovolume calculation, phylogenetic and MBFG classification, as well as detailed analysis of single cell traits and their variation in one single measurement automatically. The value of phylogenetic and MBFG classification, as well as image and trait analysis were already presented in this study. The speed of measurement and respective high throughput represents a valuable tool for short time and large-scale interval sampling and better understanding of phytoplankton community dynamics.
Acknowledgment
The author wants to acknowledge the Helmholtz Association for funding. Andreas Kruspe (City of Leipzig, Amt für Stadtgrün und Gewässer) for permission to collect samples in the Bruckner Bassin. The German weather service for the provision of publicly available climate data. They were downloaded from https://www.dwd.de/DE/leistungen/klimadatendeutschland/klarchivtagmonat.html?nn=16102#buehneTop, on 25 November 2019.
Conflict of interest
The patent submission could create a potential conflict of interest. But until now no financial benefit accrued from patent submission.


