Prognosis-related gene signature is enriched in cancer-associated fibroblasts in the stem-like subtype of gastric cancer
Dear Editor
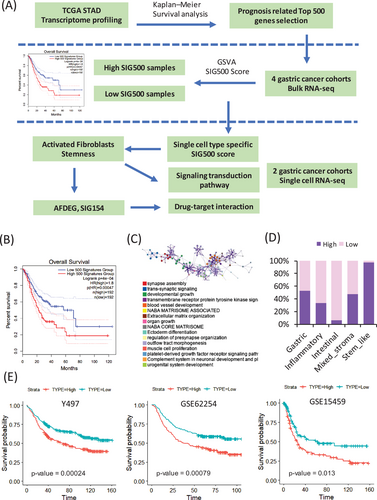
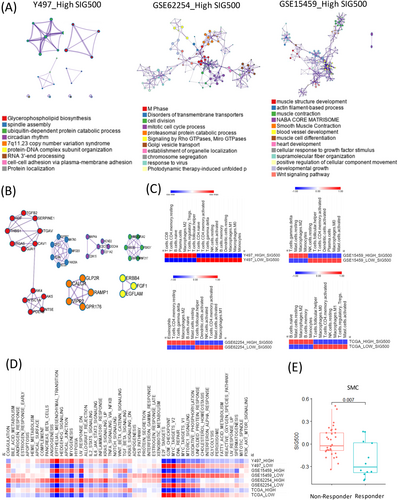
Prognostic markers in gastric cancer1 are not only used to clinically classify patients into groups but are also being studied extensively for assessing cancer progression and drug development. Hence, the mechanisms by which genes associated with different prognoses in gastric cancer affect stem-like molecular subtypes require further investigation. We selected the top 500 genes with significantly different prognostic values for stomach adenocarcinoma in The Cancer Genome Atlas (TCGA) (Figure 1A, Table S1). The genes differed significantly between the high and low expression samples (Figure 1B). Most of these 500 genes were enriched during synapse assembly, trans-synaptic signalling, and developmental growth (Figure 1C). The frequency of SIG500 detection in each molecular subtype of gastric cancer was determined, and 99% of the genes were found to be present in the stem-like molecular subtype corresponding to the high group (Figure 1D). The generated Kaplan–Meier plot showed that the group with a high SIG500 score had poor prognosis in three cohorts (Y497, GSE62254 and GSE15459) (Figure 1E). Additionally, we analysed the enriched biological pathways in each cohort in the high SIG500 group. Thus, we observed that in the Yonsei Hospital cohort,2 biological pathways related to glycerophospholipid biosynthesis were enriched; in the GSE62254 cohort, pathways related to the M phase were enriched, while in the GSE15459 cohort, pathways related to muscle structure development and the NABA core matrix were enriched (Figure 2A). Thirty-two master regulators of cancer, blood vessel morphogenesis, NABA core matrisome,3 insulin-like growth factor (IGF) transport, and uptake by IGF binding proteins were enriched in SIG500 genes (Figure 2B). Reportedly, signalling pathways that drive epithelial to mesenchymal transition (EMT) and the IGF1/IGF1 receptor pathway are substantially active in mesenchymal gastric cancer.4 Additionally, a high extracellular matrix score is associated with a poor prognosis for gastric cancer,5 and proteoglycans and glycosaminoglycans are regulators of cancer stem cell (CSC) function.6 In general, the SIG500 genes were enriched in pathways associated with CSCs and the mesenchymal subtype of gastric cancer. We analysed the different immune environments in the high and low SIG500 samples corresponding to four gastric cancer cohorts. Naïve B and inactivated T cells of the innate immunity pathway and immunosuppressive M2 and T regulatory cells were observed in all four cohorts (Figure 2C). High SIG500 samples showed enrichment of EMT, angiogenesis and myogenesis, whereas low SIG500 samples showed enrichment of E2F targets, G2M checkpoint, MYC targets and DNA repair (Figure 2D). We also compared the results of the immune checkpoint inhibitor response,7 assuming that high SIG500 is related to the immunosuppressive function associated with adaptive innate immunity, and found that SIG500 was significantly higher in nonresponders (p = .007) (Figure 2E). To overcome the limitations associated with bulk samples, we analysed the association between specific cells and SIG500 at the single-cell level. In total, 12 422 single cells corresponding to eight cell types (cohort 1) and 5927 single cells corresponding to another eight cell types (cohort 2) were analysed as gastric cancer samples. In particular, we observed that the SIG500 score was the highest in fibroblasts, followed by endothelial cells (Figure 3A,B).
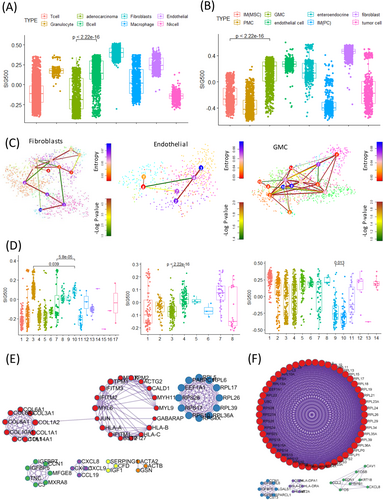
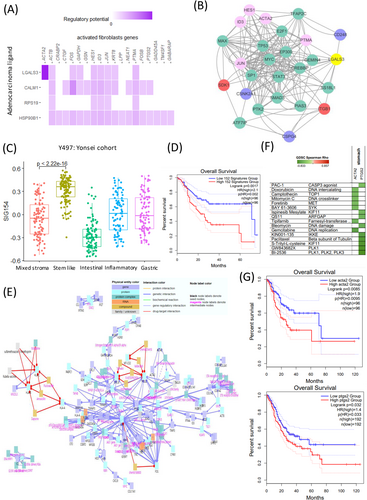
We analysed the relationship between cell type stemness and the SIG500 score at the single-cell level. Thus, we observed that for fibroblasts, the higher the entropy, the lower the SIG500 score; the high fibroblast entropy group (cluster 10) showed significantly higher expression for 154 genes, which were identified as the differentially expressed genes in activated fibroblasts. The high SIG500 score corresponding to nonactivated fibroblasts was indicative of improperly functioning cancer-associated fibroblasts (CAFs). In this study, CAFs tended to have higher SIG500 scores as stemness increased; however, a group with a lower SIG500 score showing lower stemness was also observed (Figure 3C,D). Gland mucous cells (GMCs) with high stemness had the lowest SIG500 score. Conversely, SIG500 had a high proportion in cells with low stemness. This trend suggested that cells with high GMC stemness are possibly adult stem cells, although we inferred that the expression of SIG500 genes is low before tumourigenesis (Figure 3C,D). In activated fibroblasts with high stemness, the expression of 154 differentially expressed genes (Table S2) was high, and in protein–protein interaction (PPI) analysis using MCODE, NABA core matrix, senescence and autophagy in cancer and smooth muscle contraction were enriched (Figure 3E). In activated endothelial cells, 169 differentially expressed genes were enriched for eukaryotic translational elongation, ribosome cytoplasmic biogenesis and peptide chain elongation (Figure 3F). Furthermore, the pathways enriched in endothelial cells were not related to those associated with SIG500 but to those associated with activated fibroblasts. We performed signal pathway analysis at the single-cell level. Pathways involved in intercellular communication were predicted using NicheNet.8 Thus, LGALS3 was predicted to be the adenocarcinoma ligand, while the ITGB1 fibroblast receptor was predicted to be the fibroblast ligand (Figure 4A,B). Moreover, 154 genes that were significantly and highly expressed in stem-like activated fibroblasts were identified. SIG154 was also found to be most highly expressed in the stem-like type of the Y497 bulk sample (Figure 4C). Moreover, these genes were predominantly enriched in the NABA core matrix and during senescence, autophagy in cancer, and smooth muscle contraction, as indicated in the PPI network (Figure 3E). Kaplan–Meier plots showed the overall survival rates corresponding to the high and low SIG154 groups (p = .0017) (Figure 4D). Additionally, we analysed 154 gene target–drug interaction networks using CPDB9 and predicted several significant candidate target genes, including PTGS2 (Figure 4E). Drugs such as BI-2536, GW843682X and S-trityl-L-cysteine were predicted using Genomics of Drug Sensitivity in Cancer (GDSC) (Figure 4F). In the TCGA STAD data set, a high expression level of PTGS2 was found to be associated with poor prognosis (Figure 4G). Although the drug-target interaction was low, ligand–receptor analysis indicated that actin and aortic smooth muscle (ACTA2) acted as mesenchymal stem-cell- and lineage-specific markers, indicating that they can be important drug targets. Our results also indicated for the first time that 154 activated fibroblast-related genes contribute to the establishment of a stem-like molecular subtype.
ACKNOWLEDGEMENTS
This research was supported by a grant from the KHIDI, funded by the Ministry of Health and Welfare, Republic of Korea (HI14C1324).
CONFLICT OF INTEREST
The authors declare that they have no competing interests.


