Data curation in the Internet of Things: A decision model approach
Funding information: Ministerio de Ciencia e Innovación, RTI2018-094283-B-C33; Research group FQM 211 (Categorías, Computación y Teoría de Anillos)
Abstract
Current Internet of Things (IoT) scenarios have to deal with many challenges especially when a large amount of heterogeneous data sources are integrated, that is, data curation. In this respect, the use of poor-quality data (i.e., data with problems) can produce terrible consequence from incorrect decision-making to damaging the performance in the operations. Therefore, using data with an acceptable level of usability has become essential to achieve success. In this article, we propose an IoT-big data pipeline architecture that enables data acquisition and data curation in any IoT context. We have customized the pipeline by including the DMN4DQ approach to enable us the measuring and evaluating data quality in the data produced by IoT sensors. Further, we have chosen a real dataset from sensors in an agricultural IoT context and we have defined a decision model to enable us the automatic measuring and assessing of the data quality with regard to the usability of the data in the context.
1 INTRODUCTION
Internet of Things (IoT) is more realistic than ever. It is common to find hundreds and thousands of devices connected to the Internet and to each other in different contexts. Nowadays, IoT is used as a service1 in big data pipelines2 as a mechanism to integrate large amounts of data-centric services. As a consequence, the data generated by sensors in IoT contexts3 can easily reach the three dimensions of big data. In this respect, IoT must tackle multiple challenges in a pipeline of big data concerning the activities related to data acquisition or data curation. Nevertheless, the use of poor-quality data (i.e., data with problems) can produce terrible consequences,4-6 for example, incorrect decision-making, damaging the performance in the operations, increasing costs. Therefore, to use and reach data with an expected/desired level of usability has become crucial to achieving success.7
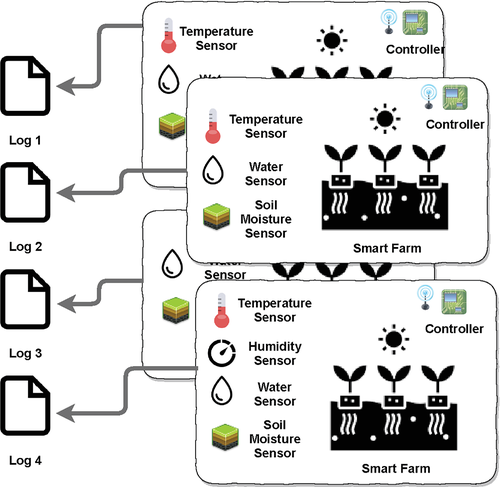
In general, the integration of the IoT with big data is carried out in the data acquisition activity in the context of a big data pipeline.8 Thus, the IoT requires the integration of numerous devices through networks. In this context, the communication protocols are essential.9 Nevertheless, not only the communications are important since there exist a huge variability of sensors10 that can produce data in multiple formats and stored with different data schemas and data storage typologies. An example is the application of IoT in the context of the agri-food sector by transforming farms into smart farms11 as shown in Figure 1. Therefore, on the one hand, we need to aggregate the heterogeneous data provided for sensors (i.e., data curation) but ensuring the data quality. And, on the other hand, sensors can be affected by external o internal problems by compromising the quality of the data produced,12 for example, missing values due to power interruptions. Thereby, we need to evaluate the quality of the data in the process of data curation in order to avoid poor-quality data in afterwards tasks.
- Define an IoT-big data pipeline architecture that enables the data acquisition and data curation in device connected contexts.
- Include in the pipeline an approach to measure and evaluate data quality in the data produced by sensors.
- Locate a real case study to apply our proposal.
The rest of the article is organized as follows: Section 2 briefly presents the proposed big data pipeline for IoT scenarios. Section 3 briefly introduces the data quality approach integrated in the pipeline. Section 4 introduces a particular case study for the application of the approach as well as the decision models are explained for the case study. The related work is discussed in Section 5. Finally, the article is summarized, and the conclusions and future work are presented in Section 6.
2 IOT-BASED DATA PIPELINE APPROACH
A big data pipeline is a process composed of a set of activities whose objective is to extract value from data.8 Following the approach presented in References 2, 8, 13-15 we have defined the next IoT-based data framework depicted in Figure 2.
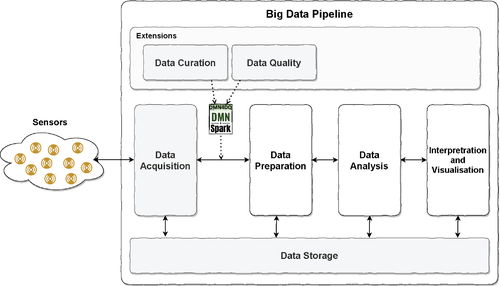
- Data acquisition. It is intended to collect the information from different data sources and to ingest data in order to transport it to the next activity in the pipeline. A prior quality filter can be applied before the ingestion.
- Data preparation. The objective of this activity is to prepare data for its processing in the next activities by formatting, cleaning or fixing it. Six tasks implement techniques that enable data preparation: data integration, data fusion, data transformation, extract-transform-load (ETL), data wrangling and data cleaning. However, in Reference 14 these tasks are included into the data curation and data analysis activities.
- Data analysis. The data analysis intends to extract value from data by mining it. Both business intelligence and data science can be applied in order to reach it.
- Interpretation and visualization. It is intended to be the final activity in a big data pipeline. It aims to report the value extracted from data through the pipeline to benefit the business activities which require it.
- Data storage. This is also a traversal activity. Its objective is to persist and provide access to the data when required.
-
Extensions. It comprises a set of activities that can be carried out in parallel or integrated with the other activities in the pipeline. The extensions included here must guarantee the quality, security and legal requirements over the whole process. Although multiple activities can be included as extensions such as data security, provenance, and so forth. We have included only two activities to comply with our objectives:
- Data curation. In Reference 16 define this activity as “the act of discovering a data source of interest, cleaning and transforming the new data, semantically integrating it with other local data sources, and de-duplicating the resulting composite”. It is concerned about data quality, the usefulness of data in the future, and the preservation of its value
- Data quality. Reference 17 is a condition of data which is assessed by using a set of variables called data quality dimensions. The data quality task is meant to monitor and measure such condition.
As we can see in Figure 2 to include data curation and quality extensions, we propose a systematic approach based on the DMN4DQ18 methodology and the DMN4SPark tool suite*.
3 DMN4DQ IN A NUTSHELL
DMN4DQ18 is a methodology that enables the automatic generation of recommendations on the potential usability of data in terms of its level of data quality. As shown in Figure 3, DMN4DQ relies on establishing a hierarchy of business rules for data quality which enables the validation of data attributes, the measurement of data quality dimensions, and the assessment of the level of data quality. This hierarchy of business rules is supported by the decision model and notation paradigm (DMN).19
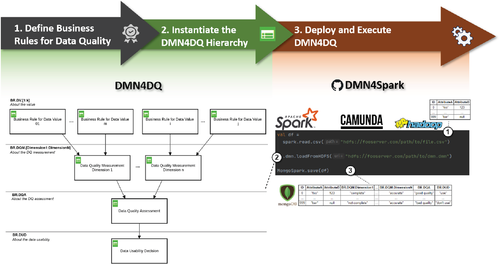
DMN is the modeling language and standard notation defined by OMG to describe decision rules. These rules take the form of the “if-then” structure of traditional programming languages. From the definition of a data model that is supported by a set of engines, for example, Camunda–DMN Engine, we see in this combination a possibility for the development of the study and the assessment of data quality.
- Instantiate the business rules for data values (BR.DV) hierarchy level;
- Instantiate the business rules for data quality measurement (BR.DQM) hierarchy level;
- Instantiate the business rules for data quality assessment (BR.DQA) hierarchy level; and
- Instantiate the business rules for data usability decision (BR.DUD) hierarchy level.
- The dataset is loaded into Apache Spark as a DataFrame.
- The DMN file (decision model) with the hierarchy of tables is loaded.
- Finally, the DataFrame is either persisted in a database or employed for further procedures.
The DMN4Spark source code can be downloaded for free at https://github.com/IDEA-Research-Group/dmn4spark.
A complete example of decision model and those business rules are instantiated or a particular use case in the next section.
4 DECISION MODEL FOR A CASE STUDY: IOT AGRICULTURAL FIELD
In our study, we propose to use our approach for IoT-big data pipeline in a real case study. First, we propose to choose a case study base on the real dataset in Reference 20. This dataset includes data extracted from several sensors (with different frequency) in an agricultural farm. Subsequently, we want to apply DMN4DQ for the dataset to evaluate the usability of the data in terms of the data quality to discard those that do not provide sufficient information and include in the final catalog the dataset that has obtained an adequate evaluation according to the data quality requirements, carried out by means of the defined decision rules. To do this, we have to define the decision model to be used.
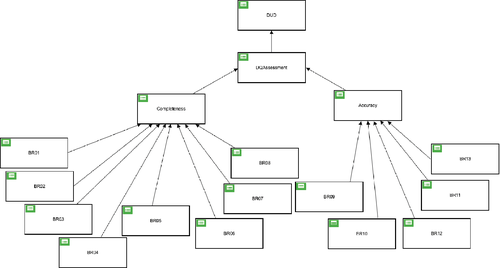
The decision model (i.e., DMN model) proposed for the case study is shown in Figure 4. This decision model is focused on two quality dimensions completeness and accuracy. Thus, incompleteness and inaccuracy of the data could cause confusion, leading to incorrect or unrealistic values being entered into the system and leading to inappropriate decisions being made when further processing the collected data.
In the next subsections, the different parts of the DMN4DQ methodology are explained in details for our particular case study.
4.1 Define data context
As aforementioned, the dataset gathers information of sensors, distributed in an agricultural farm. Sensors provide measurements (hourly and daily) of volumetric water content, soil temperature, and bulk electrical conductivity, collected at 42 monitoring locations and five depths (30, 60, 90, 120, and 150 cm) across the farm. The information is saved plain text files separated by sensor, day, and hour.
4.2 Describe the dataset
At the time of running the case study, the dataset was composed of 1,048,581 records. Each record contains the following fields: location is the name of the sensor; date of data reading; time of data reading; cm is the humidity at a depth of 30 cm; cm is the humidity at a depth of 60 cm; cm is the humidity at a depth of 90 cm; cm is the humidity at a depth of 120 cm; cm is the humidity at a depth of 150 cm; cm is temperature at a depth of 30 cm; cm is the temperature at a depth of 60 cm; cm is the temperature at a depth of 90 cm; cm is temperature at a depth of 120 cm; cm is temperature at a depth of 150 cm.
4.3 Identify data quality dimensions and define business rules for data values (BR.DV)
As previously mentioned in the presentation, the objective is to evaluate the completeness and accuracy. In this respect, we have grouped the data validation for each of the business rules BR01 to BR13 into the two quality dimensions: completeness and accuracy.
Completeness. Missing some relevant data from the dataset may lead to undesirable results. In this case, we define business rules BR01 to BR08. The first three rules: BR01, BR02, and BR03 are in charge of ensuring that the location, Date and Time fields contain data other than null, empty or blank; thereby for these three rules, the returned result will be false if the data field is null, empty or blank, and true otherwise. In the case of BR04 to BR08 rules refer to the sensors of the different depths (30, 60, 90, 120, and 150 cm). Taking the 30 cm depth sensor as an example, as shown in Figure 5, the BR04 rule takes humidity ( cm) and temperature ( cm) as inputs so that when the inputs are null, the result will be 0 (i.e, S30 null); if either of the two values is other than null or contains the empty field or the string “NA”, the result will be 1 (i.e., S30 not available); in any other case, the result value will be 2 (S30 Data), which indicates that it contains data that can be accepted. In the list of rules, which are numbered, at this level of business rules, the first one that meets the imposed conditions, that is, the hit policy first (F) shall be triggered, not evaluating the following ones.

Accuracy. In this case, we are interested in detecting those cases in which the values collected by the sensors are not reliable due to the extreme values. BR09 to BR13 rules deal with this case for sensors located at different depths. For instance, the BR09 given in Figure 6 takes as input values the humidity ( cm) and temperature ( cm) data in such a way that: (1) if the humidity is in the range of 0.150 to 0.700 and the temperature between 1 and 45 degrees the result will be “realistic”; (2) in the case where the temperature is below 1 degree or above 45, it will take as a result “unusual”; (3) in the case where the humidity is above 0.700 it will also give a result “unusual”; (4) in any other case not covered, the result will be “unrealistic”.

The results obtained from the data validation of the business rules, that is, BR01 to BR13, will be delivered to the higher level where the data quality measurement is performed.
4.4 Define business rules for data quality measurement (BR.DQM)
The result of the completeness dimension (BR.DQM.Completeness) measurement depends on the output values from BR01 to BR08 rules. Each line of the decision table will be triggered if the content of the fields BR01, BR02, and BR03 plus a value greater than or equal to 2 for the values coming from the validation of the data of the readings of each of the depth sensors BR04 to BR08. In this way, we will know how many readings are considered complete. These rules are evaluated following the hit policy C#, which returns the number of conditions that are met as given in Figure 7.

In relation to the measurement of the accuracy dimension (BR.DQM.Accuracy) the following conditions are defined: given the inputs BR09 to BR13, a value of 20 is assigned as result to each entry containing the string “realistic”, so that the hit policy C+ sums up the output values of each condition line that is fulfilled. This result gives a readable accuracy in terms of percentage, with the value of 100 being the fact of having valid readings in all the sensors coming from a register as given in Figure 8.

4.5 Define business rules for data quality assessment (BR.DQA)
For the data quality assessment, we have defined the decision table shown in Figure 9. The possible outputs of the data quality assessment are set as follows: (1) “suitable” for those records that have a completeness measure greater than or equal to 5 and accuracy greater than or equal to 100, it means that the record contains complete and accurate data from all sensors; (2) “enough quality” when there is at least a value equal to or greater than 3 in the completeness dimension and greater than or equal to 60 in the accuracy dimension, it means that 3 or 4 sensors have provided complete and accurate readings; (3) “bad quality” result is given by complete readings from one or two sensors or with a precision below 60, and; (4) “nonusable” in any other case. In this decision table, the hit policy first (F) are applied, thus the first entry that match is returned, disregarding the rest.

4.6 Define business rules for the usability of data (BR.DUD)
In this final step, the quality level of the data is decided in consequence we can decide to include or not the data records in the final catalog. Figure 10 shows the decision table for BR.DUD. In our case, we have defined as usable data those that have reported as a result of the data quality assessment (BR.DQA) values of “suitable” or “enough quality”, returning a result value of “use”. The rest are discarded as not exceeding the preset minimum, labeled as “do not use".

This decision model enables us to powerful decision-making based on usability by means of measuring and assessing the data quality of every record in the dataset of new ones generated in the case study.
4.7 Evaluation of the decision model
As a first pre-evaluation, we have executed the decision model using DMN4Spark tool and we obtained the usability recommendations in Table 1. The results reveal that 54.20% of the records can be used with guarantees, but the rest 45.80% can be used but with the risk that the level of quality is under the expected one.
| Usability recommendation | Number of records | Percentage (%) |
|---|---|---|
| use | 1,828,413 | 54.20% |
| do not use | 1,545,286 | 45.80% |
5 RELATED WORK
Several authors have put their efforts into studying IoT within the big data paradigm.1, 3, 21 Cecchinel et al.21 proposed an architecture based on a similar idea but at a lower level. It consists of the connection of different groups of sensors in sensor boards. They are connected to each other in bridges. These are responsible for aggregating data from the sensor boards and sending them to the cloud. Marhani et al.3 offered a higher-level view of IoT architectures in big data environments. It consists of four layers: (i) IoT devices, which includes the devices responsible for capturing data; (ii) network devices, responsible for the interconnection between sensors and other IoT devices; (iii) IoT gateway, responsible for storing data in the cloud; and (iv) big data analytics, where data is processed to extract value. The real-time data processing and the big data pipeline that is applied in these cases do not differ from the exposed until now. Taherkordi et al.1 specified the components of a big data architecture that would enable to process of data from IoT devices. Regarding real-time processing architectures, some authors in the literature use the lambda architecture to process the data captured by the IoT devices.22, 23
Regarding data curation, this concept is widely employed in the literature16, 24-32 to define the task which implies managing the data so that it keeps its usability during its life cycle, for example, by cleaning, enriching, transforming the data acquired, and integrating it with other data sources . They agree on the importance of the data cleaning process in data-curation workflows. Some of the latest data curation solutions proposed in the literature are reviewed next, focusing on how they face up the data cleaning challenge.
Yan et al.30 devised a cloud-based IoT architecture to support data curation processes, pointing out the importance of data being accurate. For this reason, the architecture they propose contemplates the cleaning of the data through, among other things, the detection of errors. They point out the lack of new methods for this task. We think that our proposal can contribute favorably to the architecture that they propose.
The data curation process involves several tasks which must work together so that the desired result is achieved. Beheshti et al.28 highlights the extraction, classification and enriching of data, among others. They proposed an integration of APIs which facilitate the use of features to assists users in achieving the desired curated data. In other studies, Behesti et al.33, 34 developed a curation pipeline for data from social networks. They also highlight the importance of data cleaning to support the curation process. Their proposal on data cleaning is based on repairing text data (generally correcting misspellings). They propose an automatic approach which is able to learn from the knowledge of the users and other sources.
Rehm et al.29 proposed a platform to support data curation workflows in different scenarios. They incorporate data quality features in an effort to filter bad-quality data in text documents is threefold: (i) by ensuring that data follow a specific schema; (ii) by assessing the data quality by means of machine learning algorithms; and (iii) by improving the credibility of data by using reference sources.
Murray et al.31 presented a data curation tool applied to the field of COVID-19 symptoms in numerous patients. They highlighted the necessity of cleaning raw data, and the complexity this task involves. They proposed a data cleaning process based on: (i) defining the schema of the data; (ii) establishing the data type of the attributes, and (ii) repairing the format of categorical fields, numeric fields, among others. Their proposal can be applied and reproduced in different systems. The data quality analysis process that we propose can complement their repairing and reproducibility proposal by means of the use of systematic business rules for data quality, and by associating repairing techniques to data that fail to meet the rules.
To the best of our knowledge, our proposal is the first that proposes the use of a proven methodological framework in the field of data quality to monitor the quality of data during its life cycle through context-aware business rules, being systematically applicable to different use cases within the IoT paradigm.
6 CONCLUSIONS AND FUTURE WORK
Current IoT scenarios have to deal with many challenges especially when a large amount of heterogeneous data sources are integrated. In this respect, the use of poor-quality data (i.e., data with problems) can produce terrible consequence from incorrect decision-making to damaging the performance in the operations. Therefore, to use and reach data with an acceptable level of usability has become essential to achieve success.
To overcome this necessity, in this article, we have proposed an IoT big data pipeline architecture that enables data acquisition and data curation in any IoT context. We have customized the pipeline by including the DMN4DQ approach to enable us the measuring and evaluating data quality in the data produced by sensors. Further, we have chosen a real dataset with data from sensors in an agricultural IoT context and we have defined the decision models (DMN) to enable us the automatic measuring and assessing of the data quality with regard to the usability of the data in the context.
As future work, this is the first step toward so in the next steps, we propose to evaluate in depth the data curation by running the decision model using the DMN4Spark tool. This will enable us to do a statistical analysis of the dataset in terms of data quality.
ACKNOWLEDGEMENT
This work has been funded by the projects AETHER-US (PID2020-112540RB-C44/AEI/10.13039/501100011033) and COPERNICA (P20-01224 by Junta de Andalucía).
CONFLICT OF INTEREST
All the authors are responsible for the concept of the article, the results presented and the writing. All the authors have approved the final content of the manuscript. No potential conflict of interest was reported by the authors.
Biographies

Francisco José de Haro-Olmo is PhD Candidate in Computer Science at the University of Almería, Spain. MSc in Computer Science & University Expert in Criminology. He currently teaches computer systems and cybersecurity in vocational training ( https://iescelia.org/ciberseguridad). His research interests include cybersecurity, cybercrime, forensics, privacy, anonymization techniques, and blockchain.

Álvaro Valencia-Parra obtained his BS degree in Software Engineering at the University of Seville in 2017. In 2019, he graduated with honors from the University of Seville with an MSc degree in Computer Engineering. Currently, he is a PhD student at Universidad de Sevilla, Dpto. Lenguajes y sistemas informáticos–Spain. His research areas include the improvement of different activities in the big data pipeline, such as data transformation, data quality, and data analysis. The scenarios he is facing up are mainly focused on the process mining paradigm. Hence, his goal is to improve the way in which final users deal with data preparation and specific scenarios in which configuring a big data pipeline might be tricky. For this purpose, he is working on the improvement of these processes by designing Domain-Specific Languages, user interfaces, and semiautomatic approaches in order to assist users in these tasks. He has participated in prestigious congresses such as the BPM Industry Forum or the International Conference on Information Systems (ICIS).

Ángel Jesús Varela-Vaca received a BS degree in Computer Engineering at the University of Seville (Spain) and graduated in July 2008. MSc in Software Engineering and Technology (2009) and obtained his PhD with honors at the University of Seville (2013). He is currently working as Associate Professor at the Languages and System Informatics Department at the Universidad Sevilla and belongs to the Idea Research Group. He has and led various private projects and participated in several public research projects and he has published several impact papers. He was nominated as a member of Program Committees such as ISD 2016, BPM Workshops 2017, SIMPDA 2018, SPLC 2019, and SPLC 2020. He has been a reviewer for international journals such as the Journal of Supercomputing, International Journal of Management Science and Engineering Management Multimedia Tools and Applications, Human-Centric Computational and Information Sciences, Mathematical Methods in Applied Sciences among others.

José Antonio Álvarez-Bermejo is Tenured Professor at Universidad de Almería, Dpto. Informática–Spain. His experience in the private industrial sector led him to get a position in Universidad de Almería, at the Department of Computer Architecture and Electronics in 2001, where he actually serves as Tenured Professor. His teaching has been mainly in the College of Engineering of the University of Almeria. His research career has been carried out within the Supercomputing: Algorithms group, from 2001 to 2018, and in the FQM-211 categories, computation and ring theory, researching in cybersecurity until today, him strongly collaborates with the multidisciplinary research group ECSens ( https://wpd.ugr.es/ecsens/). His research is mainly devoted to cybersecurity and cryptographic protocols. He was previously focused on the supercomputing scenario and Human-Computer Interaction (HCI) where he was awarded twice with national awards mentions. All his work led to the publication of 26 papers in indexed journals (Q1 and Q2), more than 70 contributions to international conferences, the supervision of 1 PhD dissertation as well as several technology-transfer contracts and three patents. His teaching activity led to having more than 30 papers and 6 books. He is now a member of the European Cybersecurity Training Education Group, where he develops training for law enforcement agencies across European state members, collaborating with CEPOL, EUROPOL, OSCE, and other International Institutions focused on securing the digital world. Member of the ECTEG project Decrypt.
REFERENCES
- * DMN4DQ: http://www.idea.us.es/dmn4dq/


